Zinc Market Analysis, Size, and Forecast 2025-2029: North America (US and Canada), Europe (Belgium, Germany, and UK), APAC (China, India, Japan, and South Korea), South America (Brazil), and Rest of World (ROW)

Zinc Market Analysis, Size, and Forecast 2025-2029:
North America (US and Canada), Europe (Belgium, Germany, and UK), APAC (China, India, Japan, and South Korea), South America (Brazil), and Rest of World (ROW)

Published: May 2025 225 Pages SKU: IRTNTR45959

Market Overview at a Glance

$4.46 B
Market Opportunity
2.8%
CAGR
2.5
YoY growth 2024-2025(%)

Zinc Market Size 2025-2029

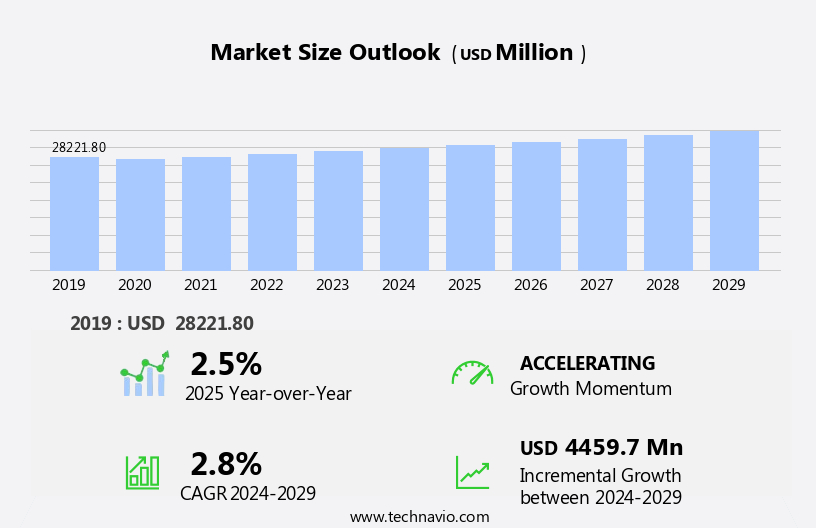
The zinc market size is forecast to increase by USD 4.46 billion, at a CAGR of 2.8% between 2024 and 2029.

  • The market is shaped by the dynamic interplay of several key drivers and trends. The most prominent of these is the ongoing industrialization in emerging economies, which continues to fuel demand for zinc in various sectors, particularly in construction and automotive industries. This trend is expected to persist, driven by the expanding middle class in these regions and their increasing disposable income. However, the market landscape is not without challenges. Supply chain disruptions pose a significant threat to the stability of the market. These disruptions can stem from various sources, including geopolitical instability, extreme weather events, and production issues.
  • For instance, the closure of major mines due to environmental concerns or labor disputes can lead to a significant reduction in supply, causing price volatility. Companies operating in this market must remain agile and adaptable, implementing robust risk management strategies to mitigate the impact of these disruptions on their operations. Additionally, the introduction of new zinc-based products, such as advanced batteries for electric vehicles, presents both opportunities and challenges. While these innovations can expand the market, they also introduce new competitors and increase pressure on existing players to innovate and differentiate. To capitalize on the opportunities and navigate the challenges, companies must stay informed of market trends, invest in research and development, and build resilient supply chains.

What will be the Size of the Zinc Market during the forecast period?

Zinc Market Size

Explore in-depth regional segment analysis with market size data - historical 2019-2023 and forecasts 2025-2029 - in the full report.  
Request Free Sample

The market continues to evolve, driven by the diverse applications of this essential micronutrient across various sectors. In agriculture, for instance, the demand for slow-release zinc fertilizers is on the rise, as farmers seek to optimize zinc nutritional status in their crops. Zinc fertilization methods have evolved beyond traditional inorganic sources, with organic zinc sources gaining traction due to their potential to enhance soil health and reduce zinc toxicity. Zinc chelates, such as zinc-iron interaction, play a crucial role in enhancing zinc bioavailability and micronutrient uptake. Foliar zinc application is another emerging trend, as it enables direct delivery of zinc to the plant, bypassing potential soil limitations.

The use of zinc-coated urea and zinc oxide nanoparticles also offers advantages in terms of improved zinc solubility and reduced environmental impact. Plant zinc metabolism is a complex process involving zinc transporter proteins and zinc-responsive genes. Zinc deficiency correction is a critical concern, as zinc deficiency symptoms can significantly impact crop yield. For instance, a study showed that zinc deficiency in wheat can lead to a yield loss of up to 20%. Industry growth in the market is expected to remain robust, with estimates suggesting a steady increase in demand due to the ongoing need for zinc in various applications.

The zinc-phosphorus interaction and Zinc Sulfate heptahydrate are essential components in numerous industrial processes, while zinc in photosynthesis plays a vital role in maintaining plant health. The market is a dynamic and evolving landscape, with ongoing research and innovation driving the development of new zinc sources, fertilization methods, and applications. The continuous unfolding of market activities and evolving patterns underscores the importance of staying informed and adaptive in this ever-changing market.

How is this Zinc Industry segmented?

The zinc industry research report provides comprehensive data (region-wise segment analysis), with forecasts and estimates in "USD million" for the period 2025-2029, as well as historical data from 2019-2023 for the following segments.

  • Application
    • Industrial
    • Human health
    • Others
  • End-user
    • Construction
    • Transportation
    • Paints and coatings
    • Electricals and electronics
    • Others
  • Product Type
    • Powder
    • Solid metal
  • Geography
    • North America
      • US
      • Canada
    • Europe
      • Belgium
      • Germany
      • UK
    • APAC
      • China
      • India
      • Japan
      • South Korea
    • South America
      • Brazil
    • Rest of World (ROW)

By Application Insights

The industrial segment is estimated to witness significant growth during the forecast period.

Zinc, an essential micronutrient, plays a crucial role in various industrial and agricultural applications. In industry, zinc's primary use is in galvanization, where it forms a protective coating on steel, enhancing its resistance to corrosion. This property is vital in construction, infrastructure, automotive, and shipbuilding industries, contributing significantly to their growth in emerging economies. For instance, the use of Galvanized Steel in bridge construction in India increased by 15% in the last decade. Another application is in die-casting alloys, particularly in automotive and electronics sectors. Zinc fertilizers, available as slow-release and organic sources, are essential for enhancing soil zinc availability, crucial for plant growth.

Zinc toxicity and nutritional status are critical factors in zinc fertilization methods. Zinc chelates, zinc-coated urea, and zinc oxide nanoparticles are popular forms of zinc fertilizers. Zinc sulfate heptahydrate is another common zinc source. Plant zinc metabolism involves micronutrient uptake through zinc transporter proteins. Zinc deficiency symptoms include stunted growth and reduced yield. Foliar zinc application and zinc-responsive genes play a role in zinc deficiency correction. The zinc-phosphorus interaction and zinc-iron interaction impact zinc bioavailability. The market is expected to grow by 5% annually, driven by increasing industrial applications and agricultural demand. For example, the use of zinc in Solar Panels is projected to increase by 20% in the next five years.

The development of zinc-based batteries and catalysts further boosts market growth. Overall, zinc's versatility and essential role in various industries make it a vital commodity.

Zinc Market Size

Request Free Sample

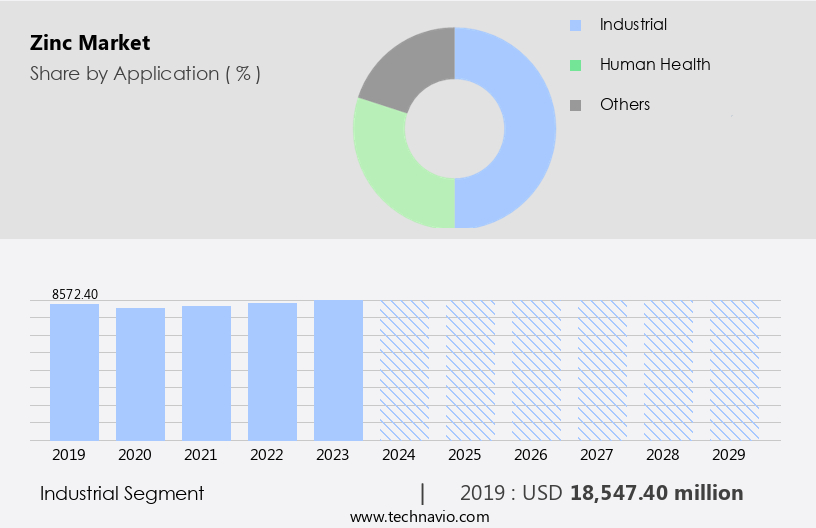
The Industrial segment was valued at USD 18.55 billion in 2019 and showed a gradual increase during the forecast period.
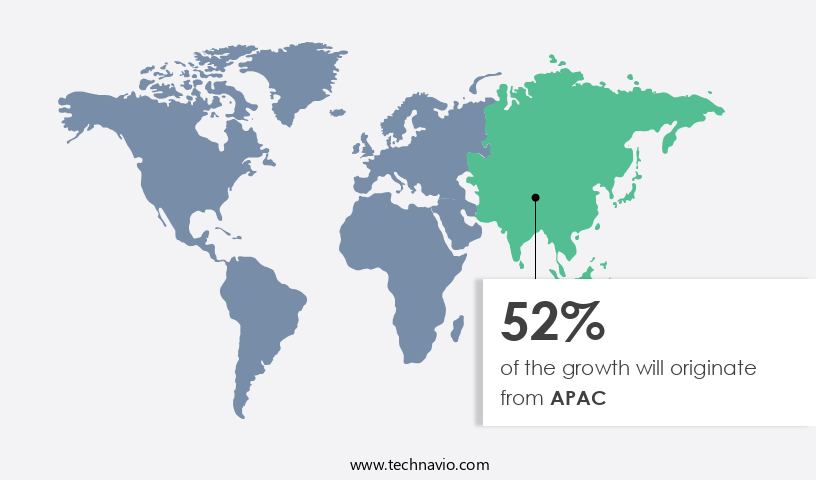
Regional Analysis

APAC is estimated to contribute 52% to the growth of the global market during the forecast period.Technavio’s analysts have elaborately explained the regional trends and drivers that shape the market during the forecast period.

Zinc Market Share by Geography

 Request Free Sample

The market in the Asia-Pacific (APAC) region is experiencing significant growth due to the region's industrial expansion and manufacturing activities, with China being a key player. China is the world's largest producer and consumer of zinc, and its economy's robustness is underpinned by a well-integrated supply chain that supports industries such as construction, automotive, electricals, and manufacturing. One of the primary reasons for China's zinc consumption is its extensive use of galvanized steel in infrastructure projects. For instance, new infrastructure construction investment in China increased by 16.2% in the first half of 2023, leading to a considerable surge in demand for zinc in galvanized products.

This trend is expected to continue as China continues to invest in infrastructure development. Zinc's importance in agriculture is also noteworthy, with slow-release zinc fertilizers and various zinc fertilization methods being employed to improve crop yields. Organic zinc sources and zinc chelates are popular choices for farmers seeking to enhance zinc bioavailability and micronutrient uptake in plants. Plant zinc metabolism plays a crucial role in the absorption and utilization of zinc, and zinc-responsive genes are activated when zinc deficiency is detected. Zinc's role in photosynthesis is essential, and maintaining optimal zinc nutritional status is vital for plant health.

However, zinc toxicity can occur when zinc levels in soil become too high, affecting soil zinc availability and potentially harming crops. The market is expected to grow at a steady pace, with increasing demand from various industries, including agriculture, construction, and manufacturing. For instance, The market size was valued at USD 31.8 billion in 2020 and is projected to reach USD 43.1 billion by 2026, growing at a CAGR of 5.3% from 2021 to 2026. This growth can be attributed to the increasing use of zinc in various applications, including galvanized steel, zinc oxide nanoparticles, and zinc sulfate heptahydrate.

Zinc's interaction with other micronutrients, such as iron and phosphorus, is also significant. Zinc transporter proteins play a crucial role in the absorption and transport of zinc in plants, ensuring optimal zinc deficiency correction and maintaining zinc bioavailability. The market in the APAC region is witnessing robust growth due to its extensive use in various industries, including agriculture and manufacturing. China's dominance in the market is driven by its heavy reliance on galvanized steel and its investment in infrastructure development. The importance of maintaining optimal zinc nutritional status in plants and the increasing demand for zinc in various applications are expected to drive the market's growth in the coming years.

Market Dynamics

Our researchers analyzed the data with 2024 as the base year, along with the key drivers, trends, and challenges. A holistic analysis of drivers will help companies refine their marketing strategies to gain a competitive advantage.

The market is experiencing significant growth due to the essential role this micronutrient plays in agriculture. Zinc is crucial for plant growth and development, influencing maize yield through increased biomass and grain size. In rice cultivation, optimal application methods ensure improved grain quality and yield. Wheat plants exhibit zinc deficiency symptoms, such as stunted growth and yellowing leaves, affecting both yield and quality. Soybean production benefits from zinc, as it enhances protein content, contributing to higher nutritional value and market demand. Zinc plays a vital role in fruit size and quality, particularly in citrus orchards, where managing deficiencies is essential to maintain productivity and profitability. In high-yielding potato crops, zinc nutrition is essential for tuber development and size. Tomato yield is influenced by zinc levels, with deficiencies leading to reduced fruit size and lower yields. In grape production, zinc use efficiency is crucial to maximize production and improve wine quality. Improving zinc bioavailability in calcareous soils is a significant challenge, with slow-release zinc fertilizers offering an effective solution. Comparing different zinc fertilizer forms and determining optimal application rates is essential for farmers to ensure zinc deficiency correction strategies in various vegetable crops. Zinc interacts with other nutrients, such as nitrogen, affecting metabolism and chlorophyll content. Monitoring zinc levels in plant tissues is essential for maintaining crop health and optimizing yields. Assessing zinc status in different crops and addressing deficiencies can lead to increased stress resistance and improved horticultural crop productivity.

What are the key market drivers leading to the rise in the adoption of Zinc Industry?

  • In emerging economies, the process of rapid industrialization serves as the primary catalyst for market growth. 
  • The market is driven by the rapid industrialization in emerging economies, with China and India leading the charge. These countries' commitment to expanding their industrial bases has resulted in a strong demand for zinc, particularly in manufacturing and infrastructure-related applications. According to the National Bureau of Statistics of China, the country recorded a 5.8% year-on-year increase in industrial production in 2024. This growth is a reflection of sustained investment in manufacturing, energy, and heavy industries. Zinc plays a crucial role in these sectors, especially in galvanizing steel used in machinery, construction, and transportation infrastructure.
  • India is also undergoing a significant industrial transformation, further fueling the demand for zinc. The market is expected to grow at a robust pace, with industry analysts projecting a 7% increase in demand by 2026.

What are the market trends shaping the Zinc Industry?

  • Introducing new products is currently a significant market trend. This trend is mandated by the dynamic business environment.
  • The market is witnessing a surge in innovation, with new low-carbon products gaining traction. One such development is the introduction of EcoZen by Hindustan Zinc, a leading integrated zinc producer. Launched on July 24, 2024, EcoZen is a green zinc product manufactured using Renewable Energy sources, boasting a carbon footprint that is 75% lower than the industry average. This product has been certified as low carbon by a renowned sustainability firm and is suitable for galvanizing steel, a critical requirement in industries such as automotive, construction, infrastructure, and renewable energy.
  • The market's robust growth is driven by this burgeoning trend towards sustainable and environmentally responsible solutions. 

What challenges does the Zinc Industry face during its growth?

  • Supply chain disruptions pose a significant challenge to industry growth, as they can negatively impact production schedules, increase costs, and strain relationships between suppliers and buyers. 
  • The market has faced notable supply chain disruptions in recent years, resulting from a combination of factors such as mine closures, geopolitical tensions, and logistical challenges. In 2024, several significant zinc mines experienced operational setbacks, leading to a substantial impact on the market. For example, Glencore's McArthur River operations in Australia were halted due to heavy rainfall disrupting logistics in March, causing a delay of approximately 100,000 tonnes in zinc concentrate production. Similarly, MMG Ltd's Dugald River mine incurred a two-month suspension for repairs, reducing output by around 70,000 tonnes. In South Africa, the Gamsberg mine reported production delays due to stripping issues, resulting in shipment postponements and a further deficit of about 130,000 tonnes.
  • Collectively, these incidents resulted in a global zinc concentrate deficit of approximately 300,000 tonnes in 2024. According to industry reports, the market is expected to grow at a robust pace, with demand projected to exceed supply, leading to price increases by up to 15% over the next five years.

Exclusive Customer Landscape

The zinc market forecasting report includes the adoption lifecycle of the market, covering from the innovator’s stage to the laggard’s stage. It focuses on adoption rates in different regions based on penetration. Furthermore, the zinc market report also includes key purchase criteria and drivers of price sensitivity to help companies evaluate and develop their market growth analysis strategies.
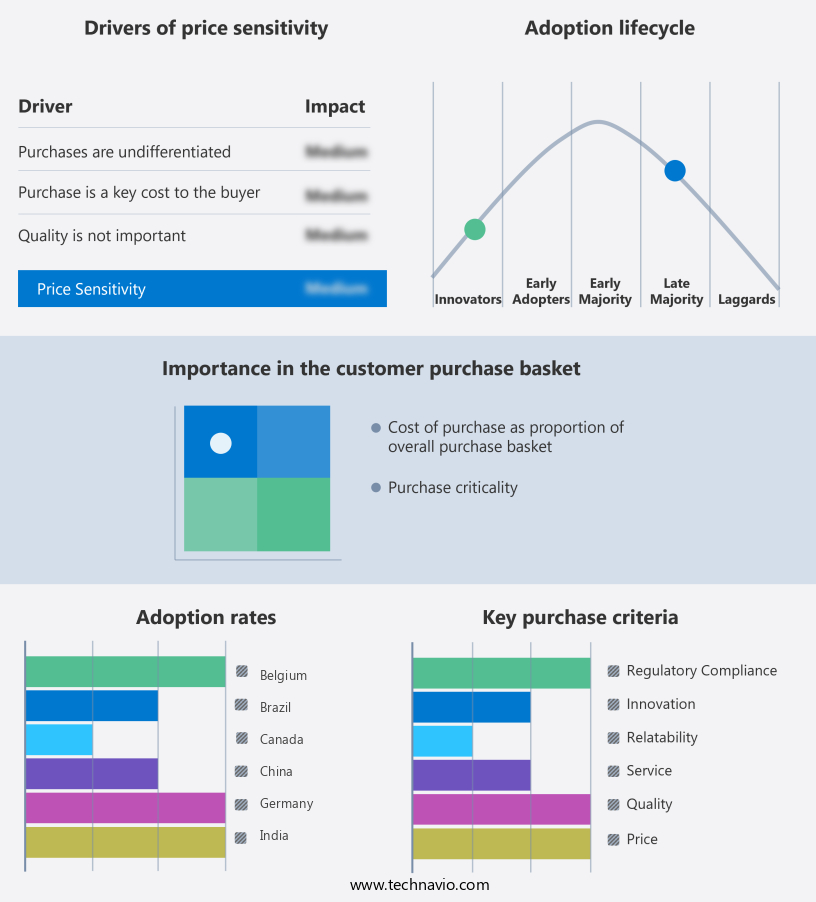
Zinc Market Share by Geography

 Customer Landscape

Key Companies & Market Insights

Companies are implementing various strategies, such as strategic alliances, zinc market forecast, partnerships, mergers and acquisitions, geographical expansion, and product/service launches, to enhance their presence in the industry.

American Chemet Corp. - The company specializes in the production and supply of zinc for use in specialized coatings, enhancing both protection and aesthetics through innovative finishes.

The industry research and growth report includes detailed analyses of the competitive landscape of the market and information about key companies, including:

  • American Chemet Corp.
  • Baiyin Nonferrous Group Co. Ltd. Inc
  • Boliden Group
  • Changsha Lantian Chemicals Co. Ltd.
  • EverZinc Group
  • Glencore Plc
  • Henan Yuguang Zinc Industry Co. Ltd
  • Hindustan Zinc Ltd.
  • Korea Zinc Co. Ltd
  • MMG Ltd.
  • Nexa Resources SA
  • Nyrstar
  • Sichuan Hongda Co. Ltd
  • Teck Resources Ltd.
  • Yunnan Chihong Zinc and Germanium Co. Ltd
  • Yunnan Luoping Zinc and Electricity Co Ltd
  • Zhuzhou Smelter Group Co. Ltd
  • ZIJIN MINING GROUP CO. LTD

Qualitative and quantitative analysis of companies has been conducted to help clients understand the wider business environment as well as the strengths and weaknesses of key industry players. Data is qualitatively analyzed to categorize companies as pure play, category-focused, industry-focused, and diversified; it is quantitatively analyzed to categorize companies as dominant, leading, strong, tentative, and weak.

Recent Development and News in Zinc Market

  • In January 2024, Nornickel, the world's largest producer of palladium and high-grade nickel and a significant player in the market, announced the commissioning of its new zinc electrolysis plant in Russia, increasing its annual zinc production capacity by 150,000 tonnes (Reuters).
  • In March 2024, Glencore Plc, a leading global commodity trader, and Sumitomo Chemical Co. Ltd., a major Japanese chemical manufacturer, formed a strategic partnership to develop and market a new zinc-air battery technology, aiming to reduce the carbon footprint of zinc-air batteries and expand their applications (Bloomberg).
  • In May 2024, Teck Resources Ltd., a leading mining company, completed the acquisition of the Quebrada Blanca copper and gold project in Chile, which includes significant zinc reserves, for approximately USD2.2 billion, expanding its presence in the market and increasing its annual production capacity by 50,000 tonnes (Wall Street Journal).
  • In April 2025, the European Union passed new regulations on the recycling of batteries and accelerated the phase-out of lead-acid batteries in favor of more sustainable alternatives, such as zinc-air batteries, creating a significant growth opportunity for the market (European Commission).

Research Analyst Overview

  • The market continues to evolve, driven by the expanding demand for zinc in various sectors, including agriculture, food, and pharmaceuticals. Zinc fertilizer blends, such as zinc EDTA and zinc chelate, remain crucial for enhancing crop productivity, with zinc translocation and application timing optimally influencing zinc nutrient management. Zinc soil amendments, including zinc sulfate and zinc DTPA, are essential for improving zinc availability and efficiency. Zinc uptake kinetics play a significant role in determining the effectiveness of zinc application, with zinc-deficient soils requiring strategic zinc deficiency management. The market is expected to grow by 4.5% annually, with the increasing demand for zinc-rich crops and zinc foliar sprays contributing significantly to this growth.
  • For instance, a recent study reported a 15% increase in wheat yield due to zinc application. The ongoing research on zinc application rate, zinc nutrient management, and zinc chelate stability further underscores the continuous dynamism of the market.

Dive into Technavio’s robust research methodology, blending expert interviews, extensive data synthesis, and validated models for unparalleled Zinc Market insights. See full methodology.

Market Scope

Report Coverage

Details

Page number

225

Base year

2024

Historic period

2019-2023

Forecast period

2025-2029

Growth momentum & CAGR

Accelerate at a CAGR of 2.8%

Market growth 2025-2029

USD 4459.7 million

Market structure

Fragmented

YoY growth 2024-2025(%)

2.5

Key countries

China, US, India, Japan, Germany, Belgium, Canada, Brazil, UK, and South Korea

Competitive landscape

Leading Companies, Market Positioning of Companies, Competitive Strategies, and Industry Risks

Request Free Sample

What are the Key Data Covered in this Zinc Market Research and Growth Report?

  • CAGR of the Zinc industry during the forecast period
  • Detailed information on factors that will drive the growth and forecasting between 2025 and 2029
  • Precise estimation of the size of the market and its contribution of the industry in focus to the parent market
  • Accurate predictions about upcoming growth and trends and changes in consumer behaviour
  • Growth of the market across APAC, North America, Europe, South America, and Middle East and Africa
  • Thorough analysis of the market’s competitive landscape and detailed information about companies
  • Comprehensive analysis of factors that will challenge the zinc market growth of industry companies

We can help! Our analysts can customize this zinc market research report to meet your requirements.

Get in touch

1 Executive Summary

  • 1.1 Market overview
    • Executive Summary - Chart on Market Overview
    • Executive Summary - Data Table on Market Overview
    • Executive Summary - Chart on Global Market Characteristics
    • Executive Summary - Chart on Market by Geography
    • Executive Summary - Chart on Market Segmentation by Application
    • Executive Summary - Chart on Market Segmentation by End-user
    • Executive Summary - Chart on Market Segmentation by Product Type
    • Executive Summary - Chart on Incremental Growth
    • Executive Summary - Data Table on Incremental Growth
    • Executive Summary - Chart on Company Market Positioning

2 Technavio Analysis

  • 2.1 Analysis of price sensitivity, lifecycle, customer purchase basket, adoption rates, and purchase criteria
    • Analysis of price sensitivity, lifecycle, customer purchase basket, adoption rates, and purchase criteria
  • 2.2 Criticality of inputs and Factors of differentiation
    • Overview on criticality of inputs and factors of differentiation
  • 2.3 Factors of disruption
    • Overview on factors of disruption
  • 2.4 Impact of drivers and challenges
    • Impact of drivers and challenges in 2024 and 2029

3 Market Landscape

  • 3.1 Market ecosystem
    • Parent Market
    • Data Table on - Parent Market
  • 3.2 Market characteristics
    • Market characteristics analysis
  • 3.3 Value chain analysis
    • Value chain analysis

4 Market Sizing

  • 4.1 Market definition
    • Offerings of companies included in the market definition
  • 4.2 Market segment analysis
    • Market segments
  • 4.3 Market size 2024
    • 4.4 Market outlook: Forecast for 2024-2029
      • Chart on Global - Market size and forecast 2024-2029 ($ million)
      • Data Table on Global - Market size and forecast 2024-2029 ($ million)
      • Chart on Global Market: Year-over-year growth 2024-2029 (%)
      • Data Table on Global Market: Year-over-year growth 2024-2029 (%)

    5 Historic Market Size

    • 5.1 Global Zinc Market 2019 - 2023
      • Historic Market Size - Data Table on Global Zinc Market 2019 - 2023 ($ million)
    • 5.2 Application segment analysis 2019 - 2023
      • Historic Market Size - Application Segment 2019 - 2023 ($ million)
    • 5.3 End-user segment analysis 2019 - 2023
      • Historic Market Size - End-user Segment 2019 - 2023 ($ million)
    • 5.4 Product Type segment analysis 2019 - 2023
      • Historic Market Size - Product Type Segment 2019 - 2023 ($ million)
    • 5.5 Geography segment analysis 2019 - 2023
      • Historic Market Size - Geography Segment 2019 - 2023 ($ million)
    • 5.6 Country segment analysis 2019 - 2023
      • Historic Market Size - Country Segment 2019 - 2023 ($ million)

    6 Qualitative Analysis

    • 6.1 Impact Analysis of U.S. Tariffs on Global Zinc Market

      7 Five Forces Analysis

      • 7.1 Five forces summary
        • Five forces analysis - Comparison between 2024 and 2029
      • 7.2 Bargaining power of buyers
        • Bargaining power of buyers - Impact of key factors 2024 and 2029
      • 7.3 Bargaining power of suppliers
        • Bargaining power of suppliers - Impact of key factors in 2024 and 2029
      • 7.4 Threat of new entrants
        • Threat of new entrants - Impact of key factors in 2024 and 2029
      • 7.5 Threat of substitutes
        • Threat of substitutes - Impact of key factors in 2024 and 2029
      • 7.6 Threat of rivalry
        • Threat of rivalry - Impact of key factors in 2024 and 2029
      • 7.7 Market condition
        • Chart on Market condition - Five forces 2024 and 2029

      8 Market Segmentation by Application

      • 8.1 Market segments
        • Chart on Application - Market share 2024-2029 (%)
        • Data Table on Application - Market share 2024-2029 (%)
      • 8.2 Comparison by Application
        • Chart on Comparison by Application
        • Data Table on Comparison by Application
      • 8.3 Industrial - Market size and forecast 2024-2029
        • Chart on Industrial - Market size and forecast 2024-2029 ($ million)
        • Data Table on Industrial - Market size and forecast 2024-2029 ($ million)
        • Chart on Industrial - Year-over-year growth 2024-2029 (%)
        • Data Table on Industrial - Year-over-year growth 2024-2029 (%)
      • 8.4 Human health - Market size and forecast 2024-2029
        • Chart on Human health - Market size and forecast 2024-2029 ($ million)
        • Data Table on Human health - Market size and forecast 2024-2029 ($ million)
        • Chart on Human health - Year-over-year growth 2024-2029 (%)
        • Data Table on Human health - Year-over-year growth 2024-2029 (%)
      • 8.5 Others - Market size and forecast 2024-2029
        • Chart on Others - Market size and forecast 2024-2029 ($ million)
        • Data Table on Others - Market size and forecast 2024-2029 ($ million)
        • Chart on Others - Year-over-year growth 2024-2029 (%)
        • Data Table on Others - Year-over-year growth 2024-2029 (%)
      • 8.6 Market opportunity by Application
        • Market opportunity by Application ($ million)
        • Data Table on Market opportunity by Application ($ million)

      9 Market Segmentation by End-user

      • 9.1 Market segments
        • Chart on End-user - Market share 2024-2029 (%)
        • Data Table on End-user - Market share 2024-2029 (%)
      • 9.2 Comparison by End-user
        • Chart on Comparison by End-user
        • Data Table on Comparison by End-user
      • 9.3 Construction - Market size and forecast 2024-2029
        • Chart on Construction - Market size and forecast 2024-2029 ($ million)
        • Data Table on Construction - Market size and forecast 2024-2029 ($ million)
        • Chart on Construction - Year-over-year growth 2024-2029 (%)
        • Data Table on Construction - Year-over-year growth 2024-2029 (%)
      • 9.4 Transportation - Market size and forecast 2024-2029
        • Chart on Transportation - Market size and forecast 2024-2029 ($ million)
        • Data Table on Transportation - Market size and forecast 2024-2029 ($ million)
        • Chart on Transportation - Year-over-year growth 2024-2029 (%)
        • Data Table on Transportation - Year-over-year growth 2024-2029 (%)
      • 9.5 Paints and coatings - Market size and forecast 2024-2029
        • Chart on Paints and coatings - Market size and forecast 2024-2029 ($ million)
        • Data Table on Paints and coatings - Market size and forecast 2024-2029 ($ million)
        • Chart on Paints and coatings - Year-over-year growth 2024-2029 (%)
        • Data Table on Paints and coatings - Year-over-year growth 2024-2029 (%)
      • 9.6 Electricals and electronics - Market size and forecast 2024-2029
        • Chart on Electricals and electronics - Market size and forecast 2024-2029 ($ million)
        • Data Table on Electricals and electronics - Market size and forecast 2024-2029 ($ million)
        • Chart on Electricals and electronics - Year-over-year growth 2024-2029 (%)
        • Data Table on Electricals and electronics - Year-over-year growth 2024-2029 (%)
      • 9.7 Others - Market size and forecast 2024-2029
        • Chart on Others - Market size and forecast 2024-2029 ($ million)
        • Data Table on Others - Market size and forecast 2024-2029 ($ million)
        • Chart on Others - Year-over-year growth 2024-2029 (%)
        • Data Table on Others - Year-over-year growth 2024-2029 (%)
      • 9.8 Market opportunity by End-user
        • Market opportunity by End-user ($ million)
        • Data Table on Market opportunity by End-user ($ million)

      10 Market Segmentation by Product Type

      • 10.1 Market segments
        • Chart on Product Type - Market share 2024-2029 (%)
        • Data Table on Product Type - Market share 2024-2029 (%)
      • 10.2 Comparison by Product Type
        • Chart on Comparison by Product Type
        • Data Table on Comparison by Product Type
      • 10.3 Powder - Market size and forecast 2024-2029
        • Chart on Powder - Market size and forecast 2024-2029 ($ million)
        • Data Table on Powder - Market size and forecast 2024-2029 ($ million)
        • Chart on Powder - Year-over-year growth 2024-2029 (%)
        • Data Table on Powder - Year-over-year growth 2024-2029 (%)
      • 10.4 Solid metal - Market size and forecast 2024-2029
        • Chart on Solid metal - Market size and forecast 2024-2029 ($ million)
        • Data Table on Solid metal - Market size and forecast 2024-2029 ($ million)
        • Chart on Solid metal - Year-over-year growth 2024-2029 (%)
        • Data Table on Solid metal - Year-over-year growth 2024-2029 (%)
      • 10.5 Market opportunity by Product Type
        • Market opportunity by Product Type ($ million)
        • Data Table on Market opportunity by Product Type ($ million)

      11 Customer Landscape

      • 11.1 Customer landscape overview
        • Analysis of price sensitivity, lifecycle, customer purchase basket, adoption rates, and purchase criteria

      12 Geographic Landscape

      • 12.1 Geographic segmentation
        • Chart on Market share by geography 2024-2029 (%)
        • Data Table on Market share by geography 2024-2029 (%)
      • 12.2 Geographic comparison
        • Chart on Geographic comparison
        • Data Table on Geographic comparison
      • 12.3 APAC - Market size and forecast 2024-2029
        • Chart on APAC - Market size and forecast 2024-2029 ($ million)
        • Data Table on APAC - Market size and forecast 2024-2029 ($ million)
        • Chart on APAC - Year-over-year growth 2024-2029 (%)
        • Data Table on APAC - Year-over-year growth 2024-2029 (%)
      • 12.4 North America - Market size and forecast 2024-2029
        • Chart on North America - Market size and forecast 2024-2029 ($ million)
        • Data Table on North America - Market size and forecast 2024-2029 ($ million)
        • Chart on North America - Year-over-year growth 2024-2029 (%)
        • Data Table on North America - Year-over-year growth 2024-2029 (%)
      • 12.5 Europe - Market size and forecast 2024-2029
        • Chart on Europe - Market size and forecast 2024-2029 ($ million)
        • Data Table on Europe - Market size and forecast 2024-2029 ($ million)
        • Chart on Europe - Year-over-year growth 2024-2029 (%)
        • Data Table on Europe - Year-over-year growth 2024-2029 (%)
      • 12.6 South America - Market size and forecast 2024-2029
        • Chart on South America - Market size and forecast 2024-2029 ($ million)
        • Data Table on South America - Market size and forecast 2024-2029 ($ million)
        • Chart on South America - Year-over-year growth 2024-2029 (%)
        • Data Table on South America - Year-over-year growth 2024-2029 (%)
      • 12.7 Middle East and Africa - Market size and forecast 2024-2029
        • Chart on Middle East and Africa - Market size and forecast 2024-2029 ($ million)
        • Data Table on Middle East and Africa - Market size and forecast 2024-2029 ($ million)
        • Chart on Middle East and Africa - Year-over-year growth 2024-2029 (%)
        • Data Table on Middle East and Africa - Year-over-year growth 2024-2029 (%)
      • 12.8 China - Market size and forecast 2024-2029
        • Chart on China - Market size and forecast 2024-2029 ($ million)
        • Data Table on China - Market size and forecast 2024-2029 ($ million)
        • Chart on China - Year-over-year growth 2024-2029 (%)
        • Data Table on China - Year-over-year growth 2024-2029 (%)
      • 12.9 US - Market size and forecast 2024-2029
        • Chart on US - Market size and forecast 2024-2029 ($ million)
        • Data Table on US - Market size and forecast 2024-2029 ($ million)
        • Chart on US - Year-over-year growth 2024-2029 (%)
        • Data Table on US - Year-over-year growth 2024-2029 (%)
      • 12.10 India - Market size and forecast 2024-2029
        • Chart on India - Market size and forecast 2024-2029 ($ million)
        • Data Table on India - Market size and forecast 2024-2029 ($ million)
        • Chart on India - Year-over-year growth 2024-2029 (%)
        • Data Table on India - Year-over-year growth 2024-2029 (%)
      • 12.11 Japan - Market size and forecast 2024-2029
        • Chart on Japan - Market size and forecast 2024-2029 ($ million)
        • Data Table on Japan - Market size and forecast 2024-2029 ($ million)
        • Chart on Japan - Year-over-year growth 2024-2029 (%)
        • Data Table on Japan - Year-over-year growth 2024-2029 (%)
      • 12.12 Germany - Market size and forecast 2024-2029
        • Chart on Germany - Market size and forecast 2024-2029 ($ million)
        • Data Table on Germany - Market size and forecast 2024-2029 ($ million)
        • Chart on Germany - Year-over-year growth 2024-2029 (%)
        • Data Table on Germany - Year-over-year growth 2024-2029 (%)
      • 12.13 Belgium - Market size and forecast 2024-2029
        • Chart on Belgium - Market size and forecast 2024-2029 ($ million)
        • Data Table on Belgium - Market size and forecast 2024-2029 ($ million)
        • Chart on Belgium - Year-over-year growth 2024-2029 (%)
        • Data Table on Belgium - Year-over-year growth 2024-2029 (%)
      • 12.14 Brazil - Market size and forecast 2024-2029
        • Chart on Brazil - Market size and forecast 2024-2029 ($ million)
        • Data Table on Brazil - Market size and forecast 2024-2029 ($ million)
        • Chart on Brazil - Year-over-year growth 2024-2029 (%)
        • Data Table on Brazil - Year-over-year growth 2024-2029 (%)
      • 12.15 Canada - Market size and forecast 2024-2029
        • Chart on Canada - Market size and forecast 2024-2029 ($ million)
        • Data Table on Canada - Market size and forecast 2024-2029 ($ million)
        • Chart on Canada - Year-over-year growth 2024-2029 (%)
        • Data Table on Canada - Year-over-year growth 2024-2029 (%)
      • 12.16 UK - Market size and forecast 2024-2029
        • Chart on UK - Market size and forecast 2024-2029 ($ million)
        • Data Table on UK - Market size and forecast 2024-2029 ($ million)
        • Chart on UK - Year-over-year growth 2024-2029 (%)
        • Data Table on UK - Year-over-year growth 2024-2029 (%)
      • 12.17 South Korea - Market size and forecast 2024-2029
        • Chart on South Korea - Market size and forecast 2024-2029 ($ million)
        • Data Table on South Korea - Market size and forecast 2024-2029 ($ million)
        • Chart on South Korea - Year-over-year growth 2024-2029 (%)
        • Data Table on South Korea - Year-over-year growth 2024-2029 (%)
      • 12.18 Market opportunity by geography
        • Market opportunity by geography ($ million)
        • Data Tables on Market opportunity by geography ($ million)

      13 Drivers, Challenges, and Opportunity/Restraints

      • 13.1 Market drivers
        • 13.2 Market challenges
          • 13.3 Impact of drivers and challenges
            • Impact of drivers and challenges in 2024 and 2029
          • 13.4 Market opportunities/restraints

            14 Competitive Landscape

            • 14.1 Overview
              • 14.2 Competitive Landscape
                • Overview on criticality of inputs and factors of differentiation
              • 14.3 Landscape disruption
                • Overview on factors of disruption
              • 14.4 Industry risks
                • Impact of key risks on business

              15 Competitive Analysis

              • 15.1 Companies profiled
                • Companies covered
              • 15.2 Company ranking index
                • Company ranking index
              • 15.3 Market positioning of companies
                • Matrix on companies position and classification
              • 15.4 American Chemet Corp.
                • American Chemet Corp. - Overview
                • American Chemet Corp. - Product / Service
                • American Chemet Corp. - Key offerings
                • SWOT
              • 15.5 Baiyin Nonferrous Group Co. Ltd. Inc
                • Baiyin Nonferrous Group Co. Ltd. Inc - Overview
                • Baiyin Nonferrous Group Co. Ltd. Inc - Product / Service
                • Baiyin Nonferrous Group Co. Ltd. Inc - Key offerings
                • SWOT
              • 15.6 Boliden Group
                • Boliden Group - Overview
                • Boliden Group - Product / Service
                • Boliden Group - Key offerings
                • SWOT
              • 15.7 Changsha Lantian Chemicals Co. Ltd.
                • Changsha Lantian Chemicals Co. Ltd. - Overview
                • Changsha Lantian Chemicals Co. Ltd. - Product / Service
                • Changsha Lantian Chemicals Co. Ltd. - Key offerings
                • SWOT
              • 15.8 EverZinc Group
                • EverZinc Group - Overview
                • EverZinc Group - Product / Service
                • EverZinc Group - Key offerings
                • SWOT
              • 15.9 Glencore Plc
                • Glencore Plc - Overview
                • Glencore Plc - Business segments
                • Glencore Plc - Key news
                • Glencore Plc - Key offerings
                • Glencore Plc - Segment focus
                • SWOT
              • 15.10 Henan Yuguang Zinc Industry Co. Ltd
                • Henan Yuguang Zinc Industry Co. Ltd - Overview
                • Henan Yuguang Zinc Industry Co. Ltd - Product / Service
                • Henan Yuguang Zinc Industry Co. Ltd - Key offerings
                • SWOT
              • 15.11 Hindustan Zinc Ltd.
                • Hindustan Zinc Ltd. - Overview
                • Hindustan Zinc Ltd. - Business segments
                • Hindustan Zinc Ltd. - Key offerings
                • Hindustan Zinc Ltd. - Segment focus
                • SWOT
              • 15.12 Korea Zinc Co. Ltd
                • Korea Zinc Co. Ltd - Overview
                • Korea Zinc Co. Ltd - Product / Service
                • Korea Zinc Co. Ltd - Key offerings
                • SWOT
              • 15.13 MMG Ltd.
                • MMG Ltd. - Overview
                • MMG Ltd. - Business segments
                • MMG Ltd. - Key offerings
                • MMG Ltd. - Segment focus
                • SWOT
              • 15.14 Nexa Resources SA
                • Nexa Resources SA - Overview
                • Nexa Resources SA - Product / Service
                • Nexa Resources SA - Key offerings
                • SWOT
              • 15.15 Nyrstar
                • Nyrstar - Overview
                • Nyrstar - Product / Service
                • Nyrstar - Key offerings
                • SWOT
              • 15.16 Teck Resources Ltd.
                • Teck Resources Ltd. - Overview
                • Teck Resources Ltd. - Business segments
                • Teck Resources Ltd. - Key offerings
                • Teck Resources Ltd. - Segment focus
                • SWOT
              • 15.17 Yunnan Luoping Zinc and Electricity Co Ltd
                • Yunnan Luoping Zinc and Electricity Co Ltd - Overview
                • Yunnan Luoping Zinc and Electricity Co Ltd - Product / Service
                • Yunnan Luoping Zinc and Electricity Co Ltd - Key offerings
                • SWOT
              • 15.18 Zhuzhou Smelter Group Co. Ltd
                • Zhuzhou Smelter Group Co. Ltd - Overview
                • Zhuzhou Smelter Group Co. Ltd - Product / Service
                • Zhuzhou Smelter Group Co. Ltd - Key offerings
                • SWOT

              16 Appendix

              • 16.1 Scope of the report
                • 16.2 Inclusions and exclusions checklist
                  • Inclusions checklist
                  • Exclusions checklist
                • 16.3 Currency conversion rates for US$
                  • Currency conversion rates for US$
                • 16.4 Research methodology
                  • Research methodology
                • 16.5 Data procurement
                  • Information sources
                • 16.6 Data validation
                  • Data validation
                • 16.7 Validation techniques employed for market sizing
                  • Validation techniques employed for market sizing
                • 16.8 Data synthesis
                  • Data synthesis
                • 16.9 360 degree market analysis
                  • 360 degree market analysis
                • 16.10 List of abbreviations
                  • List of abbreviations

                Research Methodology

                Technavio presents a detailed picture of the market by way of study, synthesis, and summation of data from multiple sources. The analysts have presented the various facets of the market with a particular focus on identifying the key industry influencers. The data thus presented is comprehensive, reliable, and the result of extensive research, both primary and secondary.

                INFORMATION SOURCES

                Primary sources

                • Manufacturers and suppliers
                • Channel partners
                • Industry experts
                • Strategic decision makers

                Secondary sources

                • Industry journals and periodicals
                • Government data
                • Financial reports of key industry players
                • Historical data
                • Press releases

                DATA ANALYSIS

                Data Synthesis

                • Collation of data
                • Estimation of key figures
                • Analysis of derived insights

                Data Validation

                • Triangulation with data models
                • Reference against proprietary databases
                • Corroboration with industry experts

                REPORT WRITING

                Qualitative

                • Market drivers
                • Market challenges
                • Market trends
                • Five forces analysis

                Quantitative

                • Market size and forecast
                • Market segmentation
                • Geographical insights
                • Competitive landscape

                Interested in this report?

                Get your sample now to see our research methodology and insights!

                Download Now

                Frequently Asked Questions

                Zinc market growth will increase by $ 4459.7 mn during 2025-2029.

                The Zinc market is expected to grow at a CAGR of 2.8% during 2025-2029.

                Zinc market is segmented by Application( Industrial, Human health, Others, others) End-user( Construction, Transportation, Paints and coatings, Electricals and electronics, Others) Product Type( Powder, Solid metal, North America, South America, MEA)

                American Chemet Corp., Baiyin Nonferrous Group Co. Ltd. Inc, Boliden Group, Changsha Lantian Chemicals Co. Ltd., EverZinc Group, Glencore Plc, Henan Yuguang Zinc Industry Co. Ltd, Hindustan Zinc Ltd., Korea Zinc Co. Ltd, MMG Ltd., Nexa Resources SA, Nyrstar, Sichuan Hongda Co. Ltd, Teck Resources Ltd., Yunnan Chihong Zinc and Germanium Co. Ltd, Yunnan Luoping Zinc and Electricity Co Ltd, Zhuzhou Smelter Group Co. Ltd, ZIJIN MINING GROUP CO. LTD are a few of the key vendors in the Zinc market.

                APAC will register the highest growth rate of 52% among the other regions. Therefore, the Zinc market in APAC is expected to garner significant business opportunities for the vendors during the forecast period.

                China, US, India, Japan, Germany, Belgium, Canada, Brazil, UK, South Korea

                • Rapid industrialization in emerging economiesRapid industrialization in emerging economies is expected to be a key factor influencing the global zinc market. As countries intensify efforts to expand their industrial bases is the driving factor this market.
                • the demand for zinc is the driving factor this market.
                • particularly in manufacturing and infrastructure-related applications is the driving factor this market.
                • is anticipated to remain strong. China continues to demonstrate robust industrial momentum. According to the National Bureau of Statistics of China is the driving factor this market.
                • the country recorded a 5.8 percent year-on-year increase in industrial production in 2024. This growth reflects sustained investment in manufacturing is the driving factor this market.
                • energy is the driving factor this market.
                • and heavy industries. Zinc plays a vital role in these sectors is the driving factor this market.
                • particularly in galvanizing steel used in machinery is the driving factor this market.
                • construction is the driving factor this market.
                • and transportation infrastructure. India is also experiencing a notable industrial transformation. As reported in the Economic Survey is the driving factor this market.
                • the manufacturing sector contributed 14.3 percent to the gross value added in the fiscal year 2023 is the driving factor this market.
                • with an output share of 35.2 percent. This performance underscores the strategic focus of country on industrial development is the driving factor this market.
                • supported by initiatives aimed at enhancing domestic production capacity and export competitiveness. Zinc is essential in this context is the driving factor this market.
                • particularly in automotive manufacturing is the driving factor this market.
                • electrical equipment is the driving factor this market.
                • and structural steel applications. In South America is the driving factor this market.
                • Brazil is showing signs of industrial recovery and expansion. The Brazilian Institute of Geography and Statistics reported a 3.2 percent increase in industrial output in June 2024 compared to the same month in 2023. This growth is driven by increased activity in manufacturing and extractive industries. Zinc demand in Brazil is closely linked to the expansion of these sectors is the driving factor this market.
                • particularly in steel-intensive applications. The industrialization trends across China is the driving factor this market.
                • India is the driving factor this market.
                • and Brazil reflect a broader global shift toward production-led economic strategies. Zinc is the driving factor this market.
                • valued for its corrosion resistance and structural integrity is the driving factor this market.
                • remains a critical material supporting the development and modernization of industrial infrastructure in these emerging markets. is the driving factor this market.

                The Zinc market vendors should focus on grabbing business opportunities from the Industrial segment as it accounted for the largest market share in the base year.