Wound Care Biologic Market Analysis, Size, and Forecast 2025-2029: North America (US, Canada, and Mexico), Europe (Germany, UK, and France), APAC (China, Japan, and India), South America (Brazil), Middle East and Africa (Saudi Arabia, UAE, and South Africa), Asia, Rest of World (ROW)

Wound Care Biologic Market Analysis, Size, and Forecast 2025-2029:
North America (US, Canada, and Mexico), Europe (Germany, UK, and France), APAC (China, Japan, and India), South America (Brazil), Middle East and Africa (Saudi Arabia, UAE, and South Africa), Asia, Rest of World (ROW)

Published: Dec 2025 311 Pages SKU: IRTNTR81124

Market Overview at a Glance

$701.3 Mn
Market Opportunity
5.5%
CAGR 2024 - 2029
37%
North America Growth
$825.2 Mn
Skin substitutes segment 2023

Wound Care Biologic Market Size 2025-2029

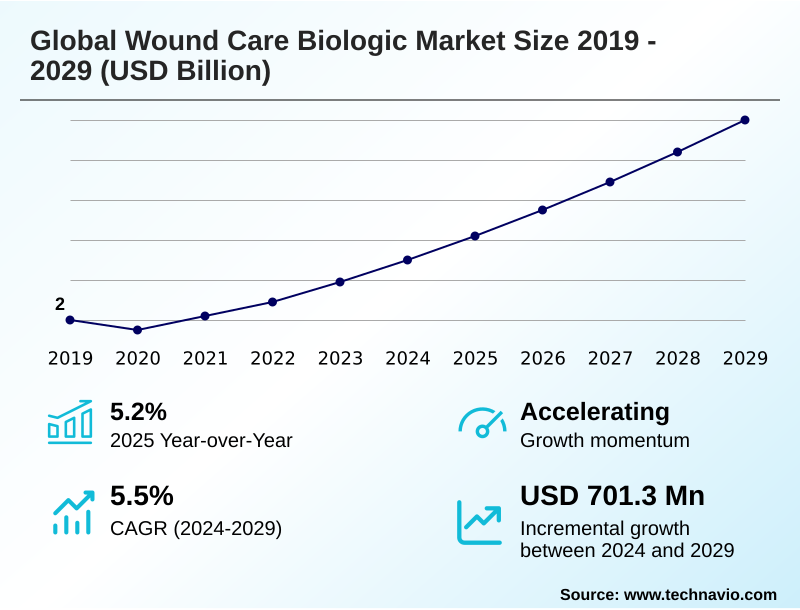
The wound care biologic market size is valued to increase by USD 701.3 million, at a CAGR of 5.5% from 2024 to 2029. Increasing prevalence of chronic diseases and aging population will drive the wound care biologic market.

Major Market Trends & Insights

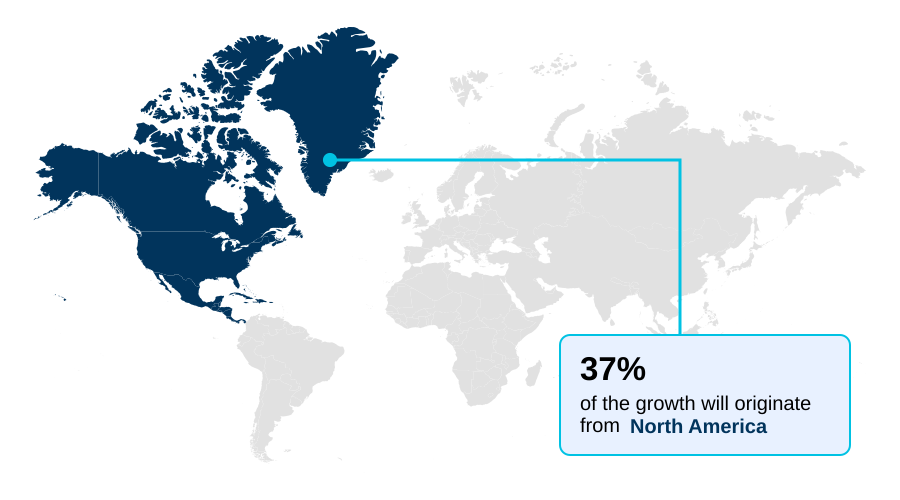
  • North America dominated the market and accounted for a 37% growth during the forecast period.
  • By Product - Skin substitutes segment was valued at USD 825.2 million in 2023
  • By Application - Ulcers segment accounted for the largest market revenue share in 2023

Market Size & Forecast

  • Market Opportunities: USD 1.00 billion
  • Market Future Opportunities: USD 701.3 million
  • CAGR from 2024 to 2029 : 5.5%

Market Summary

  • The wound care biologic market is defined by a continuous push toward therapies that actively participate in the healing process. Unlike passive dressings, these solutions, which include placental biologic products and advanced dermal repair technologies, are designed to address the biological deficits in chronic wounds such as diabetic foot ulcers and pressure ulcers.
  • Key drivers include the global rise in chronic diseases and an aging population, creating a sustained need for more effective treatments. A major trend is the shift in the point of care from hospitals to home settings, spurring innovation in user-friendly products for advanced wound management, such as portable negative pressure wound therapy systems.
  • For instance, a hospital's value analysis committee might evaluate a new cryopreserved placental membrane based not just on its higher upfront cost but on its demonstrated ability to reduce total treatment duration and prevent readmissions, impacting overall budget allocation.
  • However, market adoption faces challenges from the high cost of therapies like bioengineered tissues and complex, evolving reimbursement frameworks that can create uncertainty for providers and limit patient access to these critical innovations.

What will be the Size of the Wound Care Biologic Market during the forecast period?

Get Key Insights on Market Forecast (PDF) Request Free Sample

How is the Wound Care Biologic Market Segmented?

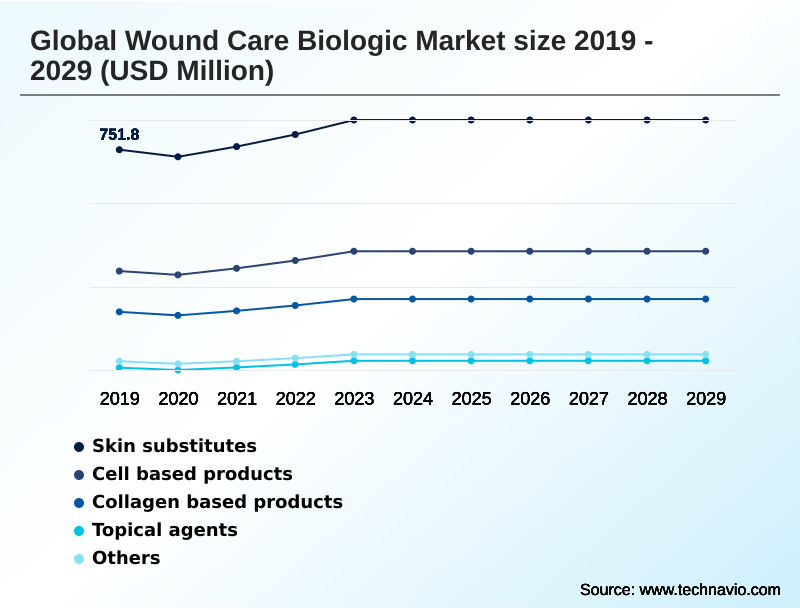
The wound care biologic industry research report provides comprehensive data (region-wise segment analysis), with forecasts and estimates in "USD million" for the period 2025-2029, as well as historical data from 2019-2023 for the following segments.

  • Product
    • Skin substitutes
    • Cell based products
    • Collagen based products
    • Topical agents
    • Others
  • Application
    • Ulcers
    • Surgical and traumatic wounds
    • Burns
    • Others
  • End-user
    • Hospitals and clinics
    • ASCs
    • Burn centers and wound clinics
    • Others
  • Geography
    • North America
      • US
      • Canada
      • Mexico
    • Europe
      • Germany
      • UK
      • France
    • Asia
    • Rest of World (ROW)

By Product Insights

The skin substitutes segment is estimated to witness significant growth during the forecast period.

The skin substitutes segment is a dynamic component of the market, engineered to mimic natural skin function for severe wounds like burns and chronic ulcers.

This segment includes both cellular substitutes with living cells and acellular options that provide a decellularized scaffold. North America's dominance is driven by high healthcare spending and favorable reimbursement.

Innovation is demonstrated by products like lyophilized human amniotic fluid allograft, a liquid biologic for topical application. These advancements in allogeneic cell-based therapies and human cells tissues are critical.

The focus is on creating clinically effective and convenient bioengineered tissues for various care settings, which can improve healing rates in venous leg ulcers by over 30% compared to traditional methods, showcasing the value of advanced dermal repair and biomimetic matrix technology.

Request Free Sample

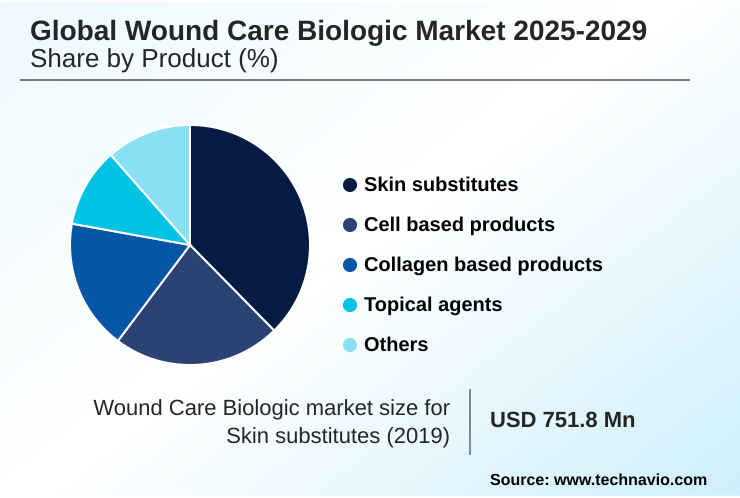
The Skin substitutes segment was valued at USD 825.2 million in 2023 and showed a gradual increase during the forecast period.

Request Free Sample

Regional Analysis

North America is estimated to contribute 37% to the growth of the global market during the forecast period.Technavio’s analysts have elaborately explained the regional trends and drivers that shape the market during the forecast period.

See How Wound Care Biologic Market Demand is Rising in North America Request Free Sample

North America leads the market, accounting for 37% of the opportunity, driven by sophisticated healthcare infrastructure and high demand for advanced wound bioactives for conditions like diabetic foot ulcers.

The region is a hub for innovation in dermal regeneration technologies and placental biologics.

Meanwhile, Asia is the fastest-growing region, with its market expanding faster than the 5.5% global average, fueled by rising healthcare expenditure and a large patient population requiring burn care biologics.

The adoption of biologic scaffolds and biologically active dressings is increasing. Europe, representing 26% of the landscape, shows steady demand for collagen-based products and engineered tissue products.

The Rest of World (ROW) focuses on cost-effective solutions, with gradual adoption of advanced wound dressings and marine-derived grafts for surgical and traumatic wounds.

Market Dynamics

Our researchers analyzed the data with 2024 as the base year, along with the key drivers, trends, and challenges. A holistic analysis of drivers will help companies refine their marketing strategies to gain a competitive advantage.

  • The strategic application of advanced therapies is becoming increasingly specific to wound etiology, influencing treatment pathways and procurement decisions. For instance, biologics for diabetic foot ulcers treatment are selected based on their ability to address underlying ischemia and neuropathy, moving beyond simple moisture management.
  • In burn units, skin substitutes for burn care management are critical when autografting is limited, providing life-saving temporary coverage. The use of a collagen matrix for surgical wounds prevention is becoming standard in high-risk patients to mitigate dehiscence and infection.
  • Similarly, the application of an amniotic membrane for chronic wounds healing provides a rich source of growth factors to restart a stalled inflammatory process. In cases of persistent venous leg ulcers, cell-based therapy for venous leg ulcers offers a regenerative approach where other modalities have failed.
  • The focus on advanced dressings for pressure ulcer care is driven by the need to reduce both patient suffering and the high costs associated with these preventable injuries. This is part of a broader shift toward biologics in home healthcare wound management, which requires products that are both effective and easy for non-specialists to apply.
  • Extracellular matrix for soft tissue reconstruction provides a robust scaffold for complex trauma cases, while managing complex wounds with biologic therapies is now a core competency in specialized centers.
  • The cost-effectiveness of wound care biologics is a central consideration, with studies showing that while initial costs are higher, the reduction in healing time and complication rates, sometimes by over 25%, can lead to significant overall savings.

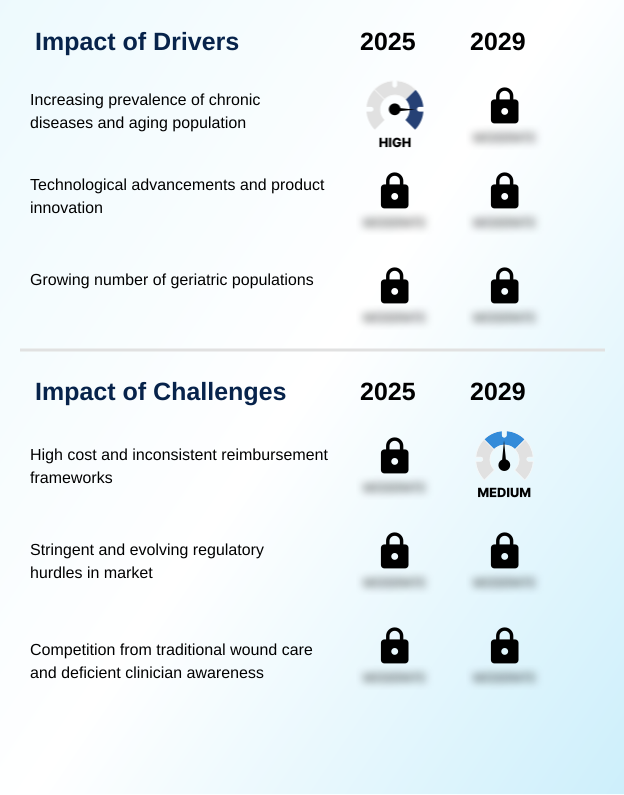
What are the key market drivers leading to the rise in the adoption of Wound Care Biologic Industry?

  • The increasing prevalence of chronic diseases, compounded by a globally aging population, serves as a fundamental driver for the wound care biologic market.

  • The market's primary driver is the confluence of rising chronic disease prevalence and an aging global population.
  • By 2030, one in six people will be over 60, increasing susceptibility to chronic wounds and demand for tissue-based dressings and advanced wound bioactives.
  • The expanding diabetic population directly correlates with a growing patient base requiring specialized treatments for diabetic foot ulcers. Technological innovation is another critical engine, with R&D yielding advanced skin substitutes and cellular and tissue-based therapies.
  • This innovation pipeline is demonstrated by companies achieving 18% net sales growth on placental biologic products.
  • These proactive therapies, including three-dimensional resorbable wound matrix and solutions for surgical and traumatic wounds, can shorten healing times and reduce the overall economic burden of chronic wound care.

What are the market trends shaping the Wound Care Biologic Industry?

  • A prominent trend is the rise of combination therapies and bioactive dressings. These sophisticated solutions address multiple facets of the complex wound healing process simultaneously.

  • A dominant trend is the shift toward combination therapies and bioactive dressings, moving beyond single-action products. Innovations in cryopreserved placental membrane and hydrofiber and silver technologies create solutions that address inflammation and microbial load simultaneously. This is seen in products offering a 31% higher healing rate for venous leg ulcers.
  • Another key trend is the decentralization of care from hospitals to home settings, driving demand for user-friendly systems for negative pressure wound therapy and advanced wound management. This shift alters how biologics are distributed and used.
  • Furthermore, market consolidation through mergers and acquisitions is reshaping the landscape, as major players acquire firms with unique technologies like intact fish skin technology and flowable graft technology to expand their portfolios in areas like complex wound surgery.

What challenges does the Wound Care Biologic Industry face during its growth?

  • The high cost of wound care biologics, coupled with inconsistent and evolving reimbursement frameworks, presents a significant challenge to widespread market adoption and growth.

  • A primary impediment is the high cost of wound care biologics and inconsistent reimbursement, which limits access. The complex manufacturing of biologic dressings and polymer-assisted scaffolds contributes to prices substantially higher than traditional dressings. Navigating reimbursement is a critical challenge, exemplified by a 3.37% reduction in the Medicare physician fee schedule conversion factor, impacting provider payment.
  • Stringent regulatory pathways also pose hurdles. The FDA's classification of products like AXIOFILL as needing a full biologics license application, rather than being regulated as a human cells tissues product, can add significant cost and delay market entry.
  • Finally, competition from traditional products, which still command a market segment representing several billion in annual sales, and a lack of clinician awareness about advanced therapies remain significant barriers to adoption.

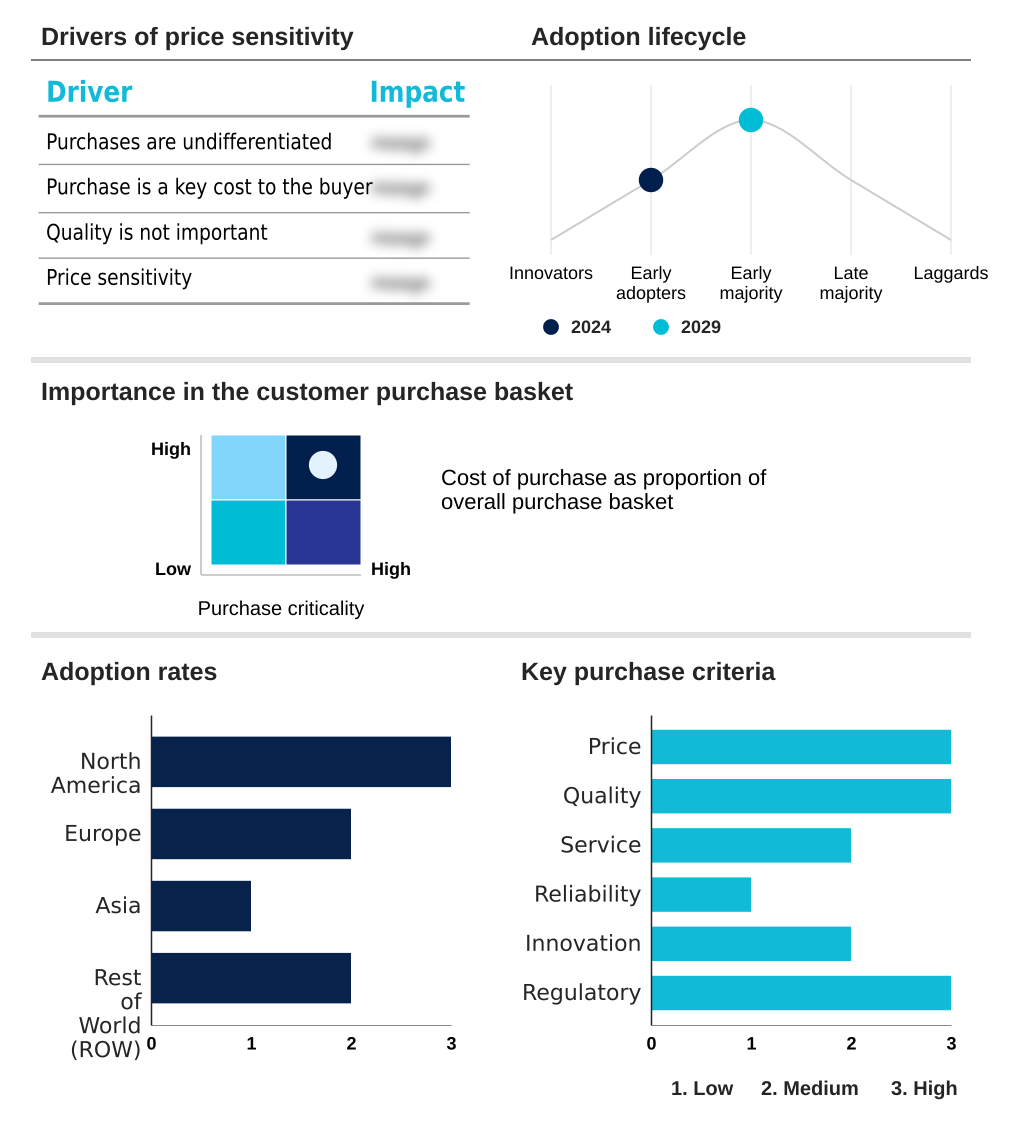
Exclusive Technavio Analysis on Customer Landscape

The wound care biologic market forecasting report includes the adoption lifecycle of the market, covering from the innovator’s stage to the laggard’s stage. It focuses on adoption rates in different regions based on penetration. Furthermore, the wound care biologic market report also includes key purchase criteria and drivers of price sensitivity to help companies evaluate and develop their market growth analysis strategies.

Customer Landscape of Wound Care Biologic Industry

Competitive Landscape

Companies are implementing various strategies, such as strategic alliances, wound care biologic market forecast, partnerships, mergers and acquisitions, geographical expansion, and product/service launches, to enhance their presence in the industry.

Amnio Technology LLC - Offers wound care biologics derived from amniotic tissues and membranes, providing biologic matrices designed to support healing and modulate inflammation in advanced wound care applications.

The industry research and growth report includes detailed analyses of the competitive landscape of the market and information about key companies, including:

  • Amnio Technology LLC
  • Aroa Biosurgery Ltd.
  • Avita Medical Inc.
  • B.Braun SE
  • Celularity Inc.
  • Coloplast AS
  • ConvaTec Group Plc
  • Derma Sciences Inc.
  • Integra LifeSciences Corp.
  • Kerecis Ltd.
  • Marine Polymer Technologies Inc.
  • Medline Industries LP
  • MiMedx Group Inc.
  • Molnlycke Health Care AB
  • Organogenesis Holdings Inc.
  • Skye Biologics Holdings LLC
  • Smith and Nephew plc
  • Stryker Corp.
  • Vericel Corp.

Qualitative and quantitative analysis of companies has been conducted to help clients understand the wider business environment as well as the strengths and weaknesses of key industry players. Data is qualitatively analyzed to categorize companies as pure play, category-focused, industry-focused, and diversified; it is quantitatively analyzed to categorize companies as dominant, leading, strong, tentative, and weak.

Recent Development and News in Wound care biologic market

  • In April, 2024, Smith and Nephew plc launched its RENASYS EDGE negative pressure wound therapy system in the US, a lightweight and compact device designed for patients receiving wound care at home.
  • In May, 2024, ConvaTec Group Plc announced results from a multinational randomized controlled trial showing its AQUACEL Ag plus Extra dressing was 31% more likely to heal venous leg ulcers compared to standard care.
  • In July, 2025, Gel4Med, Inc. announced it received a small business innovation research award from the National Institutes of Health to advance its portfolio of advanced wound care and surgical reconstruction products.
  • In August, 2025, Gel4Med, Inc. announced its G4Derm Plus, a biomimetic matrix technology, was assigned a unique HCPCS Level II code by the Centers for Medicare and Medicaid Services, facilitating reimbursement.

Dive into Technavio’s robust research methodology, blending expert interviews, extensive data synthesis, and validated models for unparalleled Wound Care Biologic Market insights. See full methodology.

Market Scope
Page number 311
Base year 2024
Historic period 2019-2023
Forecast period 2025-2029
Growth momentum & CAGR Accelerate at a CAGR of 5.5%
Market growth 2025-2029 USD 701.3 million
Market structure Fragmented
YoY growth 2024-2025(%) 5.2%
Key countries US, Canada, Mexico, Germany, UK, France, Russia, Italy, The Netherlands, Spain, China, Japan, India, South Korea, Singapore, Indonesia, Thailand, Brazil, Saudi Arabia, UAE, Australia, South Africa and Turkey
Competitive landscape Leading Companies, Market Positioning of Companies, Competitive Strategies, and Industry Risks

Request Free Sample

Research Analyst Overview

  • The wound care biologic market is characterized by a dynamic innovation cycle focused on bioactive acellular biomaterials and cellular and tissue-based products. These advanced solutions, including everything from a three-dimensional resorbable wound matrix to topical growth factors, are designed to actively intervene in the healing process.
  • Boardroom-level strategy is increasingly influenced by the trend of shifting care to home settings, which necessitates the development of user-friendly products like autologous blood clot systems and flowable graft technology that do not require complex clinical oversight. This requires rethinking product design around enzymatic debridement and wound bed preparation for non-specialist use.
  • The development of advanced materials such as porcine small intestine submucosa, processed human tissue allografts, and decellularized marine-derived matrices is driven by the need for more effective tissue regeneration scaffolds. Evidence demonstrating that certain hydrofiber and silver technologies can improve healing rates by over 30% directly impacts budgeting and procurement decisions, justifying the higher cost of these therapies.
  • This clinical validation is essential for market penetration of placental extracellular matrix devices, bioengineered tissues, and other innovations like intact fish skin technology.

What are the Key Data Covered in this Wound Care Biologic Market Research and Growth Report?

  • What is the expected growth of the Wound Care Biologic Market between 2025 and 2029?

    • USD 701.3 million, at a CAGR of 5.5%

  • What segmentation does the market report cover?

    • The report is segmented by Product (Skin substitutes, Cell based products, Collagen based products, Topical agents, and Others), Application (Ulcers, Surgical and traumatic wounds, Burns, and Others), End-user (Hospitals and clinics, ASCs, Burn centers and wound clinics, and Others) and Geography (North America, Europe, Asia, Rest of World (ROW))

  • Which regions are analyzed in the report?

    • North America, Europe, Asia and Rest of World (ROW)

  • What are the key growth drivers and market challenges?

    • Increasing prevalence of chronic diseases and aging population, High cost and inconsistent reimbursement frameworks

  • Who are the major players in the Wound Care Biologic Market?

    • Amnio Technology LLC, Aroa Biosurgery Ltd., Avita Medical Inc., B.Braun SE, Celularity Inc., Coloplast AS, ConvaTec Group Plc, Derma Sciences Inc., Integra LifeSciences Corp., Kerecis Ltd., Marine Polymer Technologies Inc., Medline Industries LP, MiMedx Group Inc., Molnlycke Health Care AB, Organogenesis Holdings Inc., Skye Biologics Holdings LLC, Smith and Nephew plc, Stryker Corp. and Vericel Corp.

Market Research Insights

  • The market is shaped by a push for clinical efficacy and economic value. The adoption of advanced therapies is accelerating, with some biologic dressings demonstrating a 31% improvement in healing rates for venous leg ulcers compared to standard care. This evidence supports their use in specialized settings focused on surgical reconstruction products and complex wound surgery.
  • Demand for placental biologics is robust, reflected in some vendors reporting 18% year-over-year sales growth. This dynamism is further driven by the shift toward outpatient care, increasing the need for regenerative scaffold technologies and biologically compatible matrices that are easy to apply.
  • However, budget-conscious providers must balance the high cost of advanced wound dressings against their long-term benefits, influencing procurement of both amniotic membrane allograft and polymer-assisted scaffolds.

We can help! Our analysts can customize this wound care biologic market research report to meet your requirements.

Get in touch

1. Executive Summary

1.1 Market overview

Executive Summary - Chart on Market Overview
Executive Summary - Data Table on Market Overview
Executive Summary - Chart on Global Market Characteristics
Executive Summary - Chart on Market by Geography
Executive Summary - Chart on Market Segmentation by Product
Executive Summary - Chart on Market Segmentation by Application
Executive Summary - Chart on Market Segmentation by End-user
Executive Summary - Chart on Incremental Growth
Executive Summary - Data Table on Incremental Growth
Executive Summary - Chart on Company Market Positioning

2. Technavio Analysis

2.1 Analysis of price sensitivity, lifecycle, customer purchase basket, adoption rates, and purchase criteria

2.2 Criticality of inputs and Factors of differentiation

Chart on Overview on criticality of inputs and factors of differentiation

2.3 Factors of disruption

Chart on Overview on factors of disruption

2.4 Impact of drivers and challenges

Chart on Impact of drivers and challenges in 2024 and 2029

3. Market Landscape

3.1 Market ecosystem

Chart on Parent Market
Data Table on - Parent Market

3.2 Market characteristics

Chart on Market characteristics analysis

3.3 Value chain analysis

Chart on Value chain analysis

4. Market Sizing

4.1 Market definition

Data Table on Offerings of companies included in the market definition

4.2 Market segment analysis

Market segments

4.3 Market size 2024

4.4 Market outlook: Forecast for 2024-2029

Chart on Global - Market size and forecast 2024-2029 ($ million)
Data Table on Global - Market size and forecast 2024-2029 ($ million)
Chart on Global Market: Year-over-year growth 2024-2029 (%)
Data Table on Global Market: Year-over-year growth 2024-2029 (%)

5. Historic Market Size

5.1 Global Wound Care Biologic Market 2019 - 2023

Historic Market Size - Data Table on Global Wound Care Biologic Market 2019 - 2023 ($ million)

5.2 Product segment analysis 2019 - 2023

Historic Market Size - Product Segment 2019 - 2023 ($ million)

5.3 Application segment analysis 2019 - 2023

Historic Market Size - Application Segment 2019 - 2023 ($ million)

5.4 End-user segment analysis 2019 - 2023

Historic Market Size - End-user Segment 2019 - 2023 ($ million)

5.5 Geography segment analysis 2019 - 2023

Historic Market Size - Geography Segment 2019 - 2023 ($ million)

5.6 Country segment analysis 2019 - 2023

Historic Market Size - Country Segment 2019 - 2023 ($ million)

6. Qualitative Analysis

6.1 Impact of AI in the global wound care biologic market

7. Five Forces Analysis

7.1 Five forces summary

Five forces analysis - Comparison between 2024 and 2029

7.2 Bargaining power of buyers

Bargaining power of buyers - Impact of key factors 2024 and 2029

7.3 Bargaining power of suppliers

Bargaining power of suppliers - Impact of key factors in 2024 and 2029

7.4 Threat of new entrants

Threat of new entrants - Impact of key factors in 2024 and 2029

7.5 Threat of substitutes

Threat of substitutes - Impact of key factors in 2024 and 2029

7.6 Threat of rivalry

Threat of rivalry - Impact of key factors in 2024 and 2029

7.7 Market condition

Chart on Market condition - Five forces 2024 and 2029

8. Market Segmentation by Product

8.1 Market segments

Chart on Product - Market share 2024-2029 (%)
Data Table on Product - Market share 2024-2029 (%)

8.2 Comparison by Product

Chart on Comparison by Product
Data Table on Comparison by Product

8.3 Skin substitutes - Market size and forecast 2024-2029

Chart on Skin substitutes - Market size and forecast 2024-2029 ($ million)
Data Table on Skin substitutes - Market size and forecast 2024-2029 ($ million)
Chart on Skin substitutes - Year-over-year growth 2024-2029 (%)
Data Table on Skin substitutes - Year-over-year growth 2024-2029 (%)

8.4 Cell based products - Market size and forecast 2024-2029

Chart on Cell based products - Market size and forecast 2024-2029 ($ million)
Data Table on Cell based products - Market size and forecast 2024-2029 ($ million)
Chart on Cell based products - Year-over-year growth 2024-2029 (%)
Data Table on Cell based products - Year-over-year growth 2024-2029 (%)

8.5 Collagen based products - Market size and forecast 2024-2029

Chart on Collagen based products - Market size and forecast 2024-2029 ($ million)
Data Table on Collagen based products - Market size and forecast 2024-2029 ($ million)
Chart on Collagen based products - Year-over-year growth 2024-2029 (%)
Data Table on Collagen based products - Year-over-year growth 2024-2029 (%)

8.6 Topical agents - Market size and forecast 2024-2029

Chart on Topical agents - Market size and forecast 2024-2029 ($ million)
Data Table on Topical agents - Market size and forecast 2024-2029 ($ million)
Chart on Topical agents - Year-over-year growth 2024-2029 (%)
Data Table on Topical agents - Year-over-year growth 2024-2029 (%)

8.7 Others - Market size and forecast 2024-2029

Chart on Others - Market size and forecast 2024-2029 ($ million)
Data Table on Others - Market size and forecast 2024-2029 ($ million)
Chart on Others - Year-over-year growth 2024-2029 (%)
Data Table on Others - Year-over-year growth 2024-2029 (%)

8.8 Market opportunity by Product

Market opportunity by Product ($ million)
Data Table on Market opportunity by Product ($ million)

9. Market Segmentation by Application

9.1 Market segments

Chart on Application - Market share 2024-2029 (%)
Data Table on Application - Market share 2024-2029 (%)

9.2 Comparison by Application

Chart on Comparison by Application
Data Table on Comparison by Application

9.3 Ulcers - Market size and forecast 2024-2029

Chart on Ulcers - Market size and forecast 2024-2029 ($ million)
Data Table on Ulcers - Market size and forecast 2024-2029 ($ million)
Chart on Ulcers - Year-over-year growth 2024-2029 (%)
Data Table on Ulcers - Year-over-year growth 2024-2029 (%)

9.4 Surgical and traumatic wounds - Market size and forecast 2024-2029

Chart on Surgical and traumatic wounds - Market size and forecast 2024-2029 ($ million)
Data Table on Surgical and traumatic wounds - Market size and forecast 2024-2029 ($ million)
Chart on Surgical and traumatic wounds - Year-over-year growth 2024-2029 (%)
Data Table on Surgical and traumatic wounds - Year-over-year growth 2024-2029 (%)

9.5 Burns - Market size and forecast 2024-2029

Chart on Burns - Market size and forecast 2024-2029 ($ million)
Data Table on Burns - Market size and forecast 2024-2029 ($ million)
Chart on Burns - Year-over-year growth 2024-2029 (%)
Data Table on Burns - Year-over-year growth 2024-2029 (%)

9.6 Others - Market size and forecast 2024-2029

Chart on Others - Market size and forecast 2024-2029 ($ million)
Data Table on Others - Market size and forecast 2024-2029 ($ million)
Chart on Others - Year-over-year growth 2024-2029 (%)
Data Table on Others - Year-over-year growth 2024-2029 (%)

9.7 Market opportunity by Application

Market opportunity by Application ($ million)
Data Table on Market opportunity by Application ($ million)

10. Market Segmentation by End-user

10.1 Market segments

Chart on End-user - Market share 2024-2029 (%)
Data Table on End-user - Market share 2024-2029 (%)

10.2 Comparison by End-user

Chart on Comparison by End-user
Data Table on Comparison by End-user

10.3 Hospitals and clinics - Market size and forecast 2024-2029

Chart on Hospitals and clinics - Market size and forecast 2024-2029 ($ million)
Data Table on Hospitals and clinics - Market size and forecast 2024-2029 ($ million)
Chart on Hospitals and clinics - Year-over-year growth 2024-2029 (%)
Data Table on Hospitals and clinics - Year-over-year growth 2024-2029 (%)

10.4 ASCs - Market size and forecast 2024-2029

Chart on ASCs - Market size and forecast 2024-2029 ($ million)
Data Table on ASCs - Market size and forecast 2024-2029 ($ million)
Chart on ASCs - Year-over-year growth 2024-2029 (%)
Data Table on ASCs - Year-over-year growth 2024-2029 (%)

10.5 Burn centers and wound clinics - Market size and forecast 2024-2029

Chart on Burn centers and wound clinics - Market size and forecast 2024-2029 ($ million)
Data Table on Burn centers and wound clinics - Market size and forecast 2024-2029 ($ million)
Chart on Burn centers and wound clinics - Year-over-year growth 2024-2029 (%)
Data Table on Burn centers and wound clinics - Year-over-year growth 2024-2029 (%)

10.6 Others - Market size and forecast 2024-2029

Chart on Others - Market size and forecast 2024-2029 ($ million)
Data Table on Others - Market size and forecast 2024-2029 ($ million)
Chart on Others - Year-over-year growth 2024-2029 (%)
Data Table on Others - Year-over-year growth 2024-2029 (%)

10.7 Market opportunity by End-user

Market opportunity by End-user ($ million)
Data Table on Market opportunity by End-user ($ million)

11. Customer Landscape

11.1 Customer landscape overview

Analysis of price sensitivity, lifecycle, customer purchase basket, adoption rates, and purchase criteria

12. Geographic Landscape

12.1 Geographic segmentation

Chart on Market share by geography 2024-2029 (%)
Data Table on Market share by geography 2024-2029 (%)

12.2 Geographic comparison

Chart on Geographic comparison
Data Table on Geographic comparison

12.3 North America - Market size and forecast 2024-2029

Chart on North America - Market size and forecast 2024-2029 ($ million)
Data Table on North America - Market size and forecast 2024-2029 ($ million)
Chart on North America - Year-over-year growth 2024-2029 (%)
Data Table on North America - Year-over-year growth 2024-2029 (%)
Chart on Regional Comparison - North America
Data Table on Regional Comparison - North America

12.3.1 US - Market size and forecast 2024-2029

Chart on US - Market size and forecast 2024-2029 ($ million)
Data Table on US - Market size and forecast 2024-2029 ($ million)
Chart on US - Year-over-year growth 2024-2029 (%)
Data Table on US - Year-over-year growth 2024-2029 (%)

12.3.2 Canada - Market size and forecast 2024-2029

Chart on Canada - Market size and forecast 2024-2029 ($ million)
Data Table on Canada - Market size and forecast 2024-2029 ($ million)
Chart on Canada - Year-over-year growth 2024-2029 (%)
Data Table on Canada - Year-over-year growth 2024-2029 (%)

12.3.3 Mexico - Market size and forecast 2024-2029

Chart on Mexico - Market size and forecast 2024-2029 ($ million)
Data Table on Mexico - Market size and forecast 2024-2029 ($ million)
Chart on Mexico - Year-over-year growth 2024-2029 (%)
Data Table on Mexico - Year-over-year growth 2024-2029 (%)

12.4 Europe - Market size and forecast 2024-2029

Chart on Europe - Market size and forecast 2024-2029 ($ million)
Data Table on Europe - Market size and forecast 2024-2029 ($ million)
Chart on Europe - Year-over-year growth 2024-2029 (%)
Data Table on Europe - Year-over-year growth 2024-2029 (%)
Chart on Regional Comparison - Europe
Data Table on Regional Comparison - Europe

12.4.1 Germany - Market size and forecast 2024-2029

Chart on Germany - Market size and forecast 2024-2029 ($ million)
Data Table on Germany - Market size and forecast 2024-2029 ($ million)
Chart on Germany - Year-over-year growth 2024-2029 (%)
Data Table on Germany - Year-over-year growth 2024-2029 (%)

12.4.2 UK - Market size and forecast 2024-2029

Chart on UK - Market size and forecast 2024-2029 ($ million)
Data Table on UK - Market size and forecast 2024-2029 ($ million)
Chart on UK - Year-over-year growth 2024-2029 (%)
Data Table on UK - Year-over-year growth 2024-2029 (%)

12.4.3 France - Market size and forecast 2024-2029

Chart on France - Market size and forecast 2024-2029 ($ million)
Data Table on France - Market size and forecast 2024-2029 ($ million)
Chart on France - Year-over-year growth 2024-2029 (%)
Data Table on France - Year-over-year growth 2024-2029 (%)

12.4.4 Russia - Market size and forecast 2024-2029

Chart on Russia - Market size and forecast 2024-2029 ($ million)
Data Table on Russia - Market size and forecast 2024-2029 ($ million)
Chart on Russia - Year-over-year growth 2024-2029 (%)
Data Table on Russia - Year-over-year growth 2024-2029 (%)

12.4.5 Italy - Market size and forecast 2024-2029

Chart on Italy - Market size and forecast 2024-2029 ($ million)
Data Table on Italy - Market size and forecast 2024-2029 ($ million)
Chart on Italy - Year-over-year growth 2024-2029 (%)
Data Table on Italy - Year-over-year growth 2024-2029 (%)

12.4.6 The Netherlands - Market size and forecast 2024-2029

Chart on The Netherlands - Market size and forecast 2024-2029 ($ million)
Data Table on The Netherlands - Market size and forecast 2024-2029 ($ million)
Chart on The Netherlands - Year-over-year growth 2024-2029 (%)
Data Table on The Netherlands - Year-over-year growth 2024-2029 (%)

12.4.7 Spain - Market size and forecast 2024-2029

Chart on Spain - Market size and forecast 2024-2029 ($ million)
Data Table on Spain - Market size and forecast 2024-2029 ($ million)
Chart on Spain - Year-over-year growth 2024-2029 (%)
Data Table on Spain - Year-over-year growth 2024-2029 (%)

12.5 Asia - Market size and forecast 2024-2029

Chart on Asia - Market size and forecast 2024-2029 ($ million)
Data Table on Asia - Market size and forecast 2024-2029 ($ million)
Chart on Asia - Year-over-year growth 2024-2029 (%)
Data Table on Asia - Year-over-year growth 2024-2029 (%)
Chart on Regional Comparison - Asia
Data Table on Regional Comparison - Asia

12.5.1 China - Market size and forecast 2024-2029

Chart on China - Market size and forecast 2024-2029 ($ million)
Data Table on China - Market size and forecast 2024-2029 ($ million)
Chart on China - Year-over-year growth 2024-2029 (%)
Data Table on China - Year-over-year growth 2024-2029 (%)

12.5.2 Japan - Market size and forecast 2024-2029

Chart on Japan - Market size and forecast 2024-2029 ($ million)
Data Table on Japan - Market size and forecast 2024-2029 ($ million)
Chart on Japan - Year-over-year growth 2024-2029 (%)
Data Table on Japan - Year-over-year growth 2024-2029 (%)

12.5.3 India - Market size and forecast 2024-2029

Chart on India - Market size and forecast 2024-2029 ($ million)
Data Table on India - Market size and forecast 2024-2029 ($ million)
Chart on India - Year-over-year growth 2024-2029 (%)
Data Table on India - Year-over-year growth 2024-2029 (%)

12.5.4 South Korea - Market size and forecast 2024-2029

Chart on South Korea - Market size and forecast 2024-2029 ($ million)
Data Table on South Korea - Market size and forecast 2024-2029 ($ million)
Chart on South Korea - Year-over-year growth 2024-2029 (%)
Data Table on South Korea - Year-over-year growth 2024-2029 (%)

12.5.5 Singapore - Market size and forecast 2024-2029

Chart on Singapore - Market size and forecast 2024-2029 ($ million)
Data Table on Singapore - Market size and forecast 2024-2029 ($ million)
Chart on Singapore - Year-over-year growth 2024-2029 (%)
Data Table on Singapore - Year-over-year growth 2024-2029 (%)

12.5.6 Indonesia - Market size and forecast 2024-2029

Chart on Indonesia - Market size and forecast 2024-2029 ($ million)
Data Table on Indonesia - Market size and forecast 2024-2029 ($ million)
Chart on Indonesia - Year-over-year growth 2024-2029 (%)
Data Table on Indonesia - Year-over-year growth 2024-2029 (%)

12.5.7 Thailand - Market size and forecast 2024-2029

Chart on Thailand - Market size and forecast 2024-2029 ($ million)
Data Table on Thailand - Market size and forecast 2024-2029 ($ million)
Chart on Thailand - Year-over-year growth 2024-2029 (%)
Data Table on Thailand - Year-over-year growth 2024-2029 (%)

12.6 Rest of World (ROW) - Market size and forecast 2024-2029

Chart on Rest of World (ROW) - Market size and forecast 2024-2029 ($ million)
Data Table on Rest of World (ROW) - Market size and forecast 2024-2029 ($ million)
Chart on Rest of World (ROW) - Year-over-year growth 2024-2029 (%)
Data Table on Rest of World (ROW) - Year-over-year growth 2024-2029 (%)
Chart on Regional Comparison - Rest of World (ROW)
Data Table on Regional Comparison - Rest of World (ROW)

12.6.1 Brazil - Market size and forecast 2024-2029

Chart on Brazil - Market size and forecast 2024-2029 ($ million)
Data Table on Brazil - Market size and forecast 2024-2029 ($ million)
Chart on Brazil - Year-over-year growth 2024-2029 (%)
Data Table on Brazil - Year-over-year growth 2024-2029 (%)

12.6.2 Saudi Arabia - Market size and forecast 2024-2029

Chart on Saudi Arabia - Market size and forecast 2024-2029 ($ million)
Data Table on Saudi Arabia - Market size and forecast 2024-2029 ($ million)
Chart on Saudi Arabia - Year-over-year growth 2024-2029 (%)
Data Table on Saudi Arabia - Year-over-year growth 2024-2029 (%)

12.6.3 UAE - Market size and forecast 2024-2029

Chart on UAE - Market size and forecast 2024-2029 ($ million)
Data Table on UAE - Market size and forecast 2024-2029 ($ million)
Chart on UAE - Year-over-year growth 2024-2029 (%)
Data Table on UAE - Year-over-year growth 2024-2029 (%)

12.6.4 Australia - Market size and forecast 2024-2029

Chart on Australia - Market size and forecast 2024-2029 ($ million)
Data Table on Australia - Market size and forecast 2024-2029 ($ million)
Chart on Australia - Year-over-year growth 2024-2029 (%)
Data Table on Australia - Year-over-year growth 2024-2029 (%)

12.6.5 South Africa - Market size and forecast 2024-2029

Chart on South Africa - Market size and forecast 2024-2029 ($ million)
Data Table on South Africa - Market size and forecast 2024-2029 ($ million)
Chart on South Africa - Year-over-year growth 2024-2029 (%)
Data Table on South Africa - Year-over-year growth 2024-2029 (%)

12.6.6 Turkey - Market size and forecast 2024-2029

Chart on Turkey - Market size and forecast 2024-2029 ($ million)
Data Table on Turkey - Market size and forecast 2024-2029 ($ million)
Chart on Turkey - Year-over-year growth 2024-2029 (%)
Data Table on Turkey - Year-over-year growth 2024-2029 (%)

12.7 Market opportunity by geography

Market opportunity by geography ($ million)
Data Tables on Market opportunity by geography ($ million)

13. Drivers, Challenges, and Opportunity

13.1 Market drivers

Increasing prevalence of chronic diseases and aging population
Technological advancements and product innovation
Growing number of geriatric populations

13.2 Market challenges

High cost and inconsistent reimbursement frameworks
Stringent and evolving regulatory hurdles in market
Competition from traditional wound care and deficient clinician awareness

13.3 Impact of drivers and challenges

Impact of drivers and challenges in 2024 and 2029

13.4 Market opportunities

Rise of combination therapies and bioactive dressings
Shift in point of care to outpatient and home settings
Increased consolidation through mergers and acquisitions

14. Competitive Landscape

14.1 Overview

14.2

Overview on criticality of inputs and factors of differentiation

14.3 Landscape disruption

Overview on factors of disruption

14.4 Industry risks

Impact of key risks on business

15. Competitive Analysis

15.1 Companies profiled

Companies covered

15.2 Company ranking index

15.3 Market positioning of companies

Matrix on companies position and classification

15.4 Amnio Technology LLC

Amnio Technology LLC - Overview
Amnio Technology LLC - Product / Service
Amnio Technology LLC - Key offerings
SWOT

15.5 Aroa Biosurgery Ltd.

Aroa Biosurgery Ltd. - Overview
Aroa Biosurgery Ltd. - Product / Service
Aroa Biosurgery Ltd. - Key offerings
SWOT

15.6 Avita Medical Inc.

Avita Medical Inc. - Overview
Avita Medical Inc. - Product / Service
Avita Medical Inc. - Key offerings
SWOT

15.7 B.Braun SE

B.Braun SE - Overview
B.Braun SE - Product / Service
B.Braun SE - Key news
B.Braun SE - Key offerings
SWOT

15.8 Coloplast AS

Coloplast AS - Overview
Coloplast AS - Business segments
Coloplast AS - Key news
Coloplast AS - Key offerings
Coloplast AS - Segment focus
SWOT

15.9 Integra LifeSciences Corp.

Integra LifeSciences Corp. - Overview
Integra LifeSciences Corp. - Business segments
Integra LifeSciences Corp. - Key news
Integra LifeSciences Corp. - Key offerings
Integra LifeSciences Corp. - Segment focus
SWOT

15.10 Kerecis Ltd.

Kerecis Ltd. - Overview
Kerecis Ltd. - Product / Service
Kerecis Ltd. - Key offerings
SWOT

15.11 Marine Polymer Technologies Inc.

Marine Polymer Technologies Inc. - Overview
Marine Polymer Technologies Inc. - Product / Service
Marine Polymer Technologies Inc. - Key offerings
SWOT

15.12 Medline Industries LP

Medline Industries LP - Overview
Medline Industries LP - Product / Service
Medline Industries LP - Key offerings
SWOT

15.13 MiMedx Group Inc.

MiMedx Group Inc. - Overview
MiMedx Group Inc. - Business segments
MiMedx Group Inc. - Key offerings
MiMedx Group Inc. - Segment focus
SWOT

15.14 Molnlycke Health Care AB

Molnlycke Health Care AB - Overview
Molnlycke Health Care AB - Product / Service
Molnlycke Health Care AB - Key offerings
SWOT

15.15 Organogenesis Holdings Inc.

Organogenesis Holdings Inc. - Overview
Organogenesis Holdings Inc. - Product / Service
Organogenesis Holdings Inc. - Key offerings
SWOT

15.16 Smith and Nephew plc

Smith and Nephew plc - Overview
Smith and Nephew plc - Business segments
Smith and Nephew plc - Key news
Smith and Nephew plc - Key offerings
Smith and Nephew plc - Segment focus
SWOT

15.17 Stryker Corp.

Stryker Corp. - Overview
Stryker Corp. - Business segments
Stryker Corp. - Key news
Stryker Corp. - Key offerings
Stryker Corp. - Segment focus
SWOT

15.18 Vericel Corp.

Vericel Corp. - Overview
Vericel Corp. - Product / Service
Vericel Corp. - Key offerings
SWOT

16. Appendix

16.1 Scope of the report

Market definition
Objectives
Notes and caveats

16.2 Inclusions and exclusions checklist

Inclusions checklist
Exclusions checklist

16.3 Currency conversion rates for US$

16.4 Research methodology

16.5 Data procurement

Information sources

16.6 Data validation

16.7 Validation techniques employed for market sizing

16.8 Data synthesis

16.9 360 degree market analysis

16.10 List of abbreviations

Research Methodology

Technavio presents a detailed picture of the market by way of study, synthesis, and summation of data from multiple sources. The analysts have presented the various facets of the market with a particular focus on identifying the key industry influencers. The data thus presented is comprehensive, reliable, and the result of extensive research, both primary and secondary.

INFORMATION SOURCES

Primary sources

  • Manufacturers and suppliers
  • Channel partners
  • Industry experts
  • Strategic decision makers

Secondary sources

  • Industry journals and periodicals
  • Government data
  • Financial reports of key industry players
  • Historical data
  • Press releases

DATA ANALYSIS

Data Synthesis

  • Collation of data
  • Estimation of key figures
  • Analysis of derived insights

Data Validation

  • Triangulation with data models
  • Reference against proprietary databases
  • Corroboration with industry experts

REPORT WRITING

Qualitative

  • Market drivers
  • Market challenges
  • Market trends
  • Five forces analysis

Quantitative

  • Market size and forecast
  • Market segmentation
  • Geographical insights
  • Competitive landscape

Interested in this report?

Get your sample now to see our research methodology and insights!

Download Now

Frequently Asked Questions

Wound Care Biologic market growth will increase by USD 701.3 million during 2025-2029.

The Wound Care Biologic market is expected to grow at a CAGR of 5.5% during 2025-2029.

Wound Care Biologic market is segmented by Product (Skin substitutes, Cell based products, Collagen based products, Topical agents, Others) Application (Ulcers, Surgical and traumatic wounds, Burns, Others) End-user (Hospitals and clinics, ASCs, Burn centers and wound clinics, Others)

Amnio Technology LLC, Aroa Biosurgery Ltd., Avita Medical Inc., B.Braun SE, Celularity Inc., Coloplast AS, ConvaTec Group Plc, Derma Sciences Inc., Integra LifeSciences Corp., Kerecis Ltd., Marine Polymer Technologies Inc., Medline Industries LP, MiMedx Group Inc., Molnlycke Health Care AB, Organogenesis Holdings Inc., Skye Biologics Holdings LLC, Smith and Nephew plc, Stryker Corp., Vericel Corp. are a few of the key vendors in the Wound Care Biologic market.

North America will register the highest growth rate of 37% among the other regions. Therefore, the Wound Care Biologic market in North America is expected to garner significant business opportunities for the vendors during the forecast period.

US, Canada, Mexico, Germany, UK, France, Russia, Italy, The Netherlands, Spain, China, Japan, India, South Korea, Singapore, Indonesia, Thailand, Brazil, Saudi Arabia, UAE, Australia, South Africa, Turkey

  • Increasing prevalence of chronic diseases and aging population is the driving factor this market.

The Wound Care Biologic market vendors should focus on grabbing business opportunities from the Product segment as it accounted for the largest market share in the base year.