Workover Rigs Market Analysis, Size, and Forecast 2025-2029: North America (US, Canada, and Mexico), Europe (Russia), Middle East and Africa (South Africa and UAE), APAC (China and Japan), South America (Brazil), and Rest of World (ROW)

Workover Rigs Market Analysis, Size, and Forecast 2025-2029:
North America (US, Canada, and Mexico), Europe (Russia), Middle East and Africa (South Africa and UAE), APAC (China and Japan), South America (Brazil), and Rest of World (ROW)

Published: Jun 2025 216 Pages SKU: IRTNTR44023

Market Overview at a Glance

$536.7 Mn
Market Opportunity
4.6%
CAGR
4.4
YoY growth 2024-2025(%)

Workover Rigs Market Size 2025-2029

The workover rigs market size is forecast to increase by USD 536.7 million, at a CAGR of 4.6% between 2024 and 2029.

  • The market is experiencing significant advancements driven by technological innovations in drilling and workover technologies. The integration of laser technology in workover operations has revolutionized the industry, enabling more precise and efficient interventions. This technological shift is expected to continue, with rigless well intervention and abandonment technologies gaining traction. These advancements offer increased operational flexibility and cost savings, making them attractive to both operators and service providers.
  • Companies seeking to capitalize on market opportunities must invest in research and development to stay competitive and navigate these challenges effectively. By focusing on technological innovation and addressing the skills gap, market participants can position themselves for long-term success in the evolving market. However, the market faces challenges, including the high initial investment costs for adopting new technologies and the need for skilled labor to operate and maintain them. Additionally, regulatory compliance and environmental concerns add complexity to workover rig operations. In addition, well stimulation techniques like jetting systems and coiled tubing are employed to enhance production.

What will be the Size of the Workover Rigs Market during the forecast period?

Workover Rigs Market Size

Explore in-depth regional segment analysis with market size data - historical 2019-2023 and forecasts 2025-2029 - in the full report.  
 Request Free Sample

  • In the dynamic oil and gas industry, workover rigs play a crucial role in maintaining and enhancing well performance. The market for workover rigs is driven by various factors, including the need for blowout prevention, well control, and well intervention in both onshore and offshore environments. Horizontal drilling and enhanced oil recovery from unconventional resources, such as shale gas and tight oil, have increased the demand for workover rigs. Well performance analysis and drilling optimization are key focus areas for operators seeking to reduce rig costs and improve rig efficiency. Workover cost analysis and wellbore modeling help identify opportunities for emissions reduction and reservoir stimulation.
  • Drilling fluids and completion fluids are essential components of workover operations, requiring continuous innovation to ensure wellbore stability and minimize environmental impact. Carbon capture and field development are emerging trends in the industry, driving the need for advanced workover rig designs and technologies. Production monitoring and data acquisition are critical for well life cycle management and ensuring optimal well performance. Offshore workover operations present unique challenges, requiring specialized rigs and expertise. Overall, the market is characterized by ongoing innovation and a focus on improving operational efficiency and environmental sustainability.

How is this Workover Rigs Industry segmented?

The workover rigs industry research report provides comprehensive data (region-wise segment analysis), with forecasts and estimates in "USD million" for the period 2025-2029, as well as historical data from 2019-2023 for the following segments.

  • Application
    • Onshore
    • Offshore
  • Type
    • Single drum
    • Double drum
  • End-user
    • Oil and gas
    • Well service contractors
    • National oil companies (NOCs)
    • Independent operators
  • Geography
    • North America
      • US
      • Canada
      • Mexico
    • Europe
      • Russia
    • Middle East and Africa
      • South Africa
      • UAE
    • APAC
      • China
      • Japan
    • South America
      • Brazil
    • Rest of World (ROW)

By Application Insights

The onshore segment is estimated to witness significant growth during the forecast period. Onshore workover rigs play a crucial role in the oil and gas industry, providing flexibility for various tasks such as wellbore cleanout, casing repairs, and artificial lift installations. These rigs are essential for optimizing production rates through the installation, repair, or maintenance of systems like electric submersible pumps (ESPs), rod pumps, and gas lift systems. Environmental concerns are increasingly shaping industry trends, and onshore workover rigs offer advantages in this regard due to their lower emissions and smaller infrastructure requirements compared to offshore rigs. Safety is a top priority in the industry, leading to the integration of safety equipment, fire suppression systems, and rig automation.

Pressure testing, flow control valves, and corrosion prevention are key components in ensuring well integrity. Telemetry systems, downhole motors, and well servicing rigs enable remote operation and maintenance, reducing the need for on-site personnel. Regulations governing environmental practices and well construction continue to evolve. Compliance with these regulations necessitates the use of sand control, tubing running tools, and wellhead equipment, including Christmas trees and choke manifolds. Well testing and reservoir management are critical for maximizing production, and flow rate measurement is essential for accurate assessment. Well plugging and abandonment, as well as production equipment maintenance and repair, are ongoing processes that require specialized tools and expertise.

The integration of hydraulic workover units, completion rigs, and pressure gauges facilitates these tasks. The oil and gas industry is constantly seeking ways to improve efficiency and productivity. Innovations in technology, such as downhole tools, flow assurance, and reservoir management systems, are driving advancements in well servicing and production optimization. Ultimately, the versatility and adaptability of onshore workover rigs make them an indispensable part of the industry's evolving landscape.

Workover Rigs Market Size

Request Free Sample

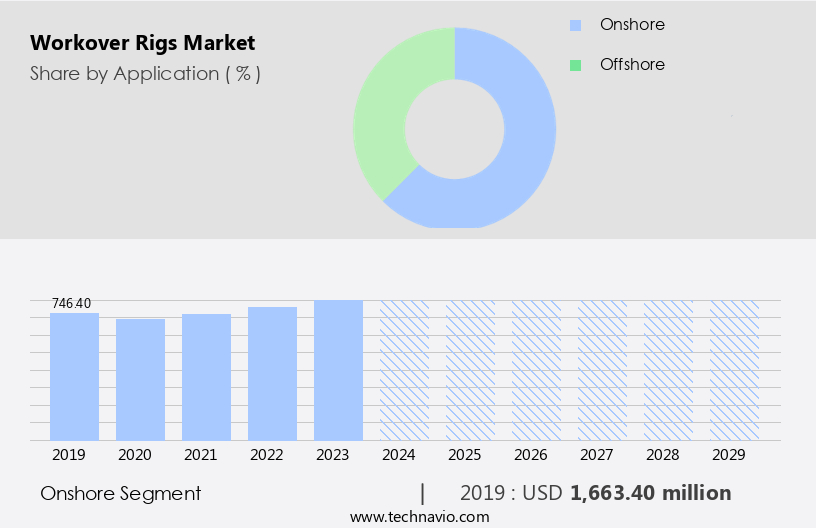
The Onshore segment was valued at USD 1.66 billion in 2019 and showed a gradual increase during the forecast period.

Regional Analysis

North America is estimated to contribute 46% to the growth of the global market during the forecast period. Technavio's analysts have elaborately explained the regional trends and drivers that shape the market during the forecast period.

Workover Rigs Market Share by Geography

Download Free Sample Report

The North American market is witnessing continuous expansion in 2024, fueled by the growth of unconventional oil and gas resources, particularly shale plays and tight reservoirs. Operators are increasingly relying on workover rigs to optimize production through techniques such as hydraulic fracturing and horizontal drilling. These rigs are essential for maintaining and enhancing well productivity, enabling efficient extraction from complex geological formations. Infrastructure development, including pipeline and processing facility expansions, is bolstering market growth. Seamless connectivity between new wells and existing production networks enhances operational efficiency and reduces downtime, making workover operations more cost-effective.

Downhole tools, safety equipment, fire suppression systems, pressure testing, flow control valves, and environmental regulations are integral components of workover rigs. They ensure well integrity, production optimization, and compliance with regulations. Advancements in technology, such as rig automation, telemetry systems, and remote operation, are further enhancing workover rig capabilities. Additionally, the integration of production equipment, including choke manifolds, electric submersible pumps, and rod pumps, supports efficient well intervention. Maintenance and repair, corrosion prevention, flow assurance, and well servicing rigs are other critical aspects of the market. They ensure the longevity and optimal performance of workover rigs, contributing to their overall value proposition.

Market trends include the increasing adoption of sand control, tubing running tools, and gas lift systems to improve well productivity and reduce operational costs. Well testing, wellhead equipment, and Christmas trees are also essential for ensuring well integrity and maximizing production. The North American market is experiencing steady growth, driven by the expansion of unconventional oil and gas resources and the need for efficient well intervention techniques. The integration of various components, including downhole tools, safety equipment, and advanced technologies, is enhancing operational efficiency and supporting market growth.

Market Dynamics

Our researchers analyzed the data with 2024 as the base year, along with the key drivers, trends, and challenges. A holistic analysis of drivers will help companies refine their marketing strategies to gain a competitive advantage.

What are the Workover Rigs market drivers leading to the rise in the adoption of Industry?

  • The market's growth is primarily attributed to technological advancements in drilling and workover technologies, which have significantly improved efficiency and productivity in the energy sector. Workover rigs are undergoing significant technological advancements to enhance operational efficiency and safety. Automation and robotics are integral to these developments, streamlining repetitive tasks and ensuring accuracy during interventions. Downhole tools, such as logging and measurement-while-drilling (LWD/MWD) tools, are being upgraded with advanced technology to provide real-time data on wellbore conditions. This information is crucial for assessing reservoir characteristics, identifying production issues, and planning effective workover strategies.
  • Safety remains a top priority in the workover rig market. The use of safety equipment, including fire suppression systems and personal protective equipment, is essential to mitigate risks and ensure the wellbeing of personnel. Regulatory compliance with environmental regulations is also a critical factor, with companies investing in rig automation to minimize human intervention and reduce the environmental footprint. Flow control valves are essential components of workover rigs, managing fluid flow during drilling, production, and intervention activities. The market is witnessing significant innovation in this area, with the development of intelligent valves that offer improved accuracy, reliability, and efficiency.

What are the Workover Rigs market trends shaping the Industry?

  • The endorsed use of laser technology in workover operations is currently gaining traction in the industry. This innovative approach is set to revolutionize the way well interventions are conducted, offering enhanced efficiency and precision. In the oil and gas industry, the drive for production optimization and well stimulation has led to significant advancements in workover technologies. Traditional completion and workover methods, which often rely on explosive charges, mechanical grinding, and harsh chemicals, have given way to more precise and efficient alternatives. One such technology is the use of high-power lasers for cutting, perforating, and milling operations. These laser workover systems enable the delivery of high-power laser energy down deep boreholes, providing the necessary power to perform laser workover and completion operations in challenging environments.
  • The integration of these technologies enhances operational efficiency, reduces downtime, and minimizes costs. For instance, hydraulic workover units offer greater flexibility and mobility compared to traditional rigs, enabling them to be deployed in various locations and terrains. Moreover, the importance of safety and environmental considerations cannot be overstated. Corrosion prevention and flow assurance measures are essential to ensure the longevity and productivity of oil and gas assets. Pressure gauges and rig inspections are critical in monitoring and maintaining the integrity of the equipment and the wellbore. By focusing on these aspects, workover rig operators can ensure the safe and efficient production of oil and gas resources. Jetting systems, coiled tubing, rig inspection, artificial lift, hydraulic workover units, pressure gauges, corrosion prevention, and flow assurance are all crucial components of modern workover rigs.

How does Workover Rigs market face challenges during its growth?

  • The emergence of rigless well intervention and abandonment technologies poses a significant challenge to the growth of the industry, requiring professionals to adapt and innovate in order to effectively implement these advancements. The oil and gas industry is experiencing a transition towards rigless intervention and abandonment technologies, which offer enhanced safety, efficiency, and cost savings compared to traditional workover rigs. This shift is driven by the increasing global oil and gas exploration and production (E&P) activities. Rigless intervention techniques, including wireline, hydraulic workovers, and coiled tubing, eliminate the need for conventional workover rigs, thereby reducing associated costs.
  • The integration of these advanced tools and techniques is crucial for maximizing revenues from existing oil and gas fields. The oil and gas sector's focus on innovation and operational excellence is leading to the development and adoption of new technologies. Rigless intervention services are gaining popularity due to their ability to minimize downtime, reduce costs, and enhance productivity. As the industry continues to evolve, the adoption of these technologies is expected to grow significantly. Telemetry systems, downhole motors, tubing running tools, gas lift, sand control, well servicing rigs, well testing, wellhead equipment, and Christmas trees are essential components of rigless intervention services. These technologies enable remote monitoring, efficient operations, and improved reservoir management.

Exclusive Customer Landscape

The workover rigs market forecasting report includes the adoption lifecycle of the market, covering from the innovator's stage to the laggard's stage. It focuses on adoption rates in different regions based on penetration. Furthermore, the workover rigs market report also includes key purchase criteria and drivers of price sensitivity to help companies evaluate and develop their market growth analysis strategies.

Workover Rigs Market Share by Geography

 Customer Landscape

Key Companies & Market Insights

Companies are implementing various strategies, such as strategic alliances, workover rigs market forecast, partnerships, mergers and acquisitions, geographical expansion, and product/service launches, to enhance their presence in the industry.

Baker Hughes Co. - The company specializes in Workover Rigs, a workover rig is a mobile drilling solution designed for performing remedial operations in the oil and gas industry.

The industry research and growth report includes detailed analyses of the competitive landscape of the market and information about key companies, including:

  • Baker Hughes Co.
  • Cactus Inc.
  • Drillmec Spa
  • Ensign Energy Services Inc.
  • Halliburton Co.
  • Independence Contract Drilling
  • L and T Technology Services Ltd.
  • MB LLC
  • MFF Oilfield Group
  • MND SAS
  • Nabors Industries Ltd.
  • National Energy Services Reunited Corp.
  • Oil India Ltd.
  • OiLSERV
  • PR Marriott Drilling Ltd.
  • Precision Drilling Corp.
  • Schlumberger Ltd.
  • Total Energy Services Inc.
  • Transcontinental Energy Services LLC

Qualitative and quantitative analysis of companies has been conducted to help clients understand the wider business environment as well as the strengths and weaknesses of key industry players. Data is qualitatively analyzed to categorize companies as pure play, category-focused, industry-focused, and diversified; it is quantitatively analyzed to categorize companies as dominant, leading, strong, tentative, and weak.

Recent Development and News in Workover Rigs Market

  • In February 2023, Baker Hughes, a GE company, announced the launch of its new PaceEdge workover rig, which incorporates advanced automation and digital technologies to enhance operational efficiency and safety. This innovation marks a significant technological advancement in the workover rig market (Baker Hughes, 2023).
  • In July 2024, Halliburton and National Oilwell Varco joined forces to form a strategic alliance, combining their expertise in drilling and production services to offer integrated solutions for clients. This collaboration is expected to strengthen their market position and provide new opportunities for growth (Halliburton, 2024).
  • In November 2024, the U.S. Bureau of Safety and Environmental Enforcement (BSEE) approved the use of a new workover rig design by Transocean, featuring a novel mud gas separation system. This approval signifies a key regulatory milestone and a step towards reducing greenhouse gas emissions in offshore drilling operations (Transocean, 2024).
  • In March 2025, Saudi Aramco, the world's largest oil company, announced its entry into the workover rig market by investing in a new rig manufacturing facility in Saudi Arabia. This strategic move is expected to increase the company's control over its drilling operations and reduce reliance on external service providers (Saudi Aramco, 2025).

Research Analyst Overview

The market encompasses a diverse range of equipment and services essential for optimizing production and maintaining well integrity in the oil and gas industry. This dynamic market continues to evolve, with applications spanning from production optimization and well stimulation to jetting systems, coiled tubing, rig inspection, artificial lift, hydraulic workover units, completion rigs, and more. Downhole tools, safety equipment, and fire suppression systems are integral components, ensuring efficient and safe operations. Environmental regulations drive the demand for advanced environmental solutions, such as corrosion prevention and flow assurance systems. Telemetry systems and remote operation enable real-time monitoring and data analysis, enhancing operational efficiency.

Well servicing rigs, including sand control, tubing running tools, and gas lift systems, address specific challenges in various reservoirs. Drilling rigs and well testing are also critical aspects of the market, ensuring the successful execution of exploration and production projects. The ongoing integration of technologies like rig automation, pressure testing, flow control valves, and choke manifolds streamlines processes and improves overall performance. Maintenance and repair services ensure the longevity and optimal functioning of these rigs and associated equipment. Wellhead equipment, including Christmas trees and pressure gauges, play a crucial role in managing production and maintaining well integrity. Electric drives and power systems are increasingly being adopted in workover rigs, offering improved energy efficiency, reduced emissions, and enhanced control during drilling and intervention activities.

Well abandonment and plugging solutions are essential for decommissioning mature fields and ensuring environmental safety. The market remains a vibrant and ever-changing landscape, with ongoing innovation and adaptation to meet the evolving needs of the oil and gas industry. The workover rig market is experiencing a period of rapid technological advancement, driven by the integration of automation, robotics, and advanced downhole tools. These innovations are enhancing operational efficiency, improving safety, and ensuring regulatory compliance, making workover rigs a vital component of modern drilling and production operations. Fiber optic sensing technology is another innovation, providing real-time data on temperature, pressure, and strain for optimal well integrity management.

Dive into Technavio's strong research methodology, blending expert interviews, extensive data synthesis, and validated models for unparalleled Workover Rigs Market insights. See full methodology.

Market Scope

Report Coverage

Details

Page number

216

Base year

2024

Historic period

2019-2023

Forecast period

2025-2029

Growth momentum & CAGR

Accelerate at a CAGR of 4.6%

Market growth 2025-2029

USD 536.7 million

Market structure

Fragmented

YoY growth 2024-2025(%)

4.4

Key countries

US, Canada, Saudi Arabia, China, Russia, Mexico, UAE, Brazil, South Africa, and Japan

Competitive landscape

Leading Companies, Market Positioning of Companies, Competitive Strategies, and Industry Risks

Request Free Sample

What are the Key Data Covered in this Workover Rigs Market Research and Growth Report?

  • CAGR of the Workover Rigs industry during the forecast period
  • Detailed information on factors that will drive the growth and forecasting between 2025 and 2029
  • Precise estimation of the size of the market and its contribution of the industry in focus to the parent market
  • Accurate predictions about upcoming growth and trends and changes in consumer behaviour
  • Growth of the market across North America, Middle East and Africa, APAC, Europe, and South America
  • Thorough analysis of the market's competitive landscape and detailed information about companies
  • Comprehensive analysis of factors that will challenge the workover rigs market growth of industry companies

We can help! Our analysts can customize this workover rigs market research report to meet your requirements.

Get in touch

1 Executive Summary

  • 1.1 Market overview
    • Executive Summary - Chart on Market Overview
    • Executive Summary - Data Table on Market Overview
    • Executive Summary - Chart on Global Market Characteristics
    • Executive Summary - Chart on Market by Geography
    • Executive Summary - Chart on Market Segmentation by Application
    • Executive Summary - Chart on Market Segmentation by Type
    • Executive Summary - Chart on Market Segmentation by End-user
    • Executive Summary - Chart on Incremental Growth
    • Executive Summary - Data Table on Incremental Growth
    • Executive Summary - Chart on Company Market Positioning

2 Technavio Analysis

  • 2.1 Analysis of price sensitivity, lifecycle, customer purchase basket, adoption rates, and purchase criteria
    • Analysis of price sensitivity, lifecycle, customer purchase basket, adoption rates, and purchase criteria
  • 2.2 Criticality of inputs and Factors of differentiation
    • Overview on criticality of inputs and factors of differentiation
  • 2.3 Factors of disruption
    • Overview on factors of disruption
  • 2.4 Impact of drivers and challenges
    • Impact of drivers and challenges in 2024 and 2029

3 Market Landscape

  • 3.1 Market ecosystem
    • Parent Market
    • Data Table on - Parent Market
  • 3.2 Market characteristics
    • Market characteristics analysis
  • 3.3 Value chain analysis
    • Value chain analysis

4 Market Sizing

  • 4.1 Market definition
    • Offerings of companies included in the market definition
  • 4.2 Market segment analysis
    • Market segments
  • 4.3 Market size 2024
    • 4.4 Market outlook: Forecast for 2024-2029
      • Chart on Global - Market size and forecast 2024-2029 ($ million)
      • Data Table on Global - Market size and forecast 2024-2029 ($ million)
      • Chart on Global Market: Year-over-year growth 2024-2029 (%)
      • Data Table on Global Market: Year-over-year growth 2024-2029 (%)

    5 Historic Market Size

    • 5.1 Global Workover Rigs Market 2019 - 2023
      • Historic Market Size - Data Table on Global Workover Rigs Market 2019 - 2023 ($ million)
    • 5.2 Application segment analysis 2019 - 2023
      • Historic Market Size - Application Segment 2019 - 2023 ($ million)
    • 5.3 Type segment analysis 2019 - 2023
      • Historic Market Size - Type Segment 2019 - 2023 ($ million)
    • 5.4 End-user segment analysis 2019 - 2023
      • Historic Market Size - End-user Segment 2019 - 2023 ($ million)
    • 5.5 Geography segment analysis 2019 - 2023
      • Historic Market Size - Geography Segment 2019 - 2023 ($ million)
    • 5.6 Country segment analysis 2019 - 2023
      • Historic Market Size - Country Segment 2019 - 2023 ($ million)

    6 Qualitative Analysis

    • 6.1 The AI impact on global workover rigs market

      7 Five Forces Analysis

      • 7.1 Five forces summary
        • Five forces analysis - Comparison between 2024 and 2029
      • 7.2 Bargaining power of buyers
        • Bargaining power of buyers - Impact of key factors 2024 and 2029
      • 7.3 Bargaining power of suppliers
        • Bargaining power of suppliers - Impact of key factors in 2024 and 2029
      • 7.4 Threat of new entrants
        • Threat of new entrants - Impact of key factors in 2024 and 2029
      • 7.5 Threat of substitutes
        • Threat of substitutes - Impact of key factors in 2024 and 2029
      • 7.6 Threat of rivalry
        • Threat of rivalry - Impact of key factors in 2024 and 2029
      • 7.7 Market condition
        • Chart on Market condition - Five forces 2024 and 2029

      8 Market Segmentation by Application

      • 8.1 Market segments
        • Chart on Application - Market share 2024-2029 (%)
        • Data Table on Application - Market share 2024-2029 (%)
      • 8.2 Comparison by Application
        • Chart on Comparison by Application
        • Data Table on Comparison by Application
      • 8.3 Onshore - Market size and forecast 2024-2029
        • Chart on Onshore - Market size and forecast 2024-2029 ($ million)
        • Data Table on Onshore - Market size and forecast 2024-2029 ($ million)
        • Chart on Onshore - Year-over-year growth 2024-2029 (%)
        • Data Table on Onshore - Year-over-year growth 2024-2029 (%)
      • 8.4 Offshore - Market size and forecast 2024-2029
        • Chart on Offshore - Market size and forecast 2024-2029 ($ million)
        • Data Table on Offshore - Market size and forecast 2024-2029 ($ million)
        • Chart on Offshore - Year-over-year growth 2024-2029 (%)
        • Data Table on Offshore - Year-over-year growth 2024-2029 (%)
      • 8.5 Market opportunity by Application
        • Market opportunity by Application ($ million)
        • Data Table on Market opportunity by Application ($ million)

      9 Market Segmentation by Type

      • 9.1 Market segments
        • Chart on Type - Market share 2024-2029 (%)
        • Data Table on Type - Market share 2024-2029 (%)
      • 9.2 Comparison by Type
        • Chart on Comparison by Type
        • Data Table on Comparison by Type
      • 9.3 Single drum - Market size and forecast 2024-2029
        • Chart on Single drum - Market size and forecast 2024-2029 ($ million)
        • Data Table on Single drum - Market size and forecast 2024-2029 ($ million)
        • Chart on Single drum - Year-over-year growth 2024-2029 (%)
        • Data Table on Single drum - Year-over-year growth 2024-2029 (%)
      • 9.4 Double drum - Market size and forecast 2024-2029
        • Chart on Double drum - Market size and forecast 2024-2029 ($ million)
        • Data Table on Double drum - Market size and forecast 2024-2029 ($ million)
        • Chart on Double drum - Year-over-year growth 2024-2029 (%)
        • Data Table on Double drum - Year-over-year growth 2024-2029 (%)
      • 9.5 Market opportunity by Type
        • Market opportunity by Type ($ million)
        • Data Table on Market opportunity by Type ($ million)

      10 Market Segmentation by End-user

      • 10.1 Market segments
        • Chart on End-user - Market share 2024-2029 (%)
        • Data Table on End-user - Market share 2024-2029 (%)
      • 10.2 Comparison by End-user
        • Chart on Comparison by End-user
        • Data Table on Comparison by End-user
      • 10.3 Oil and gas - Market size and forecast 2024-2029
        • Chart on Oil and gas - Market size and forecast 2024-2029 ($ million)
        • Data Table on Oil and gas - Market size and forecast 2024-2029 ($ million)
        • Chart on Oil and gas - Year-over-year growth 2024-2029 (%)
        • Data Table on Oil and gas - Year-over-year growth 2024-2029 (%)
      • 10.4 Well service contractors - Market size and forecast 2024-2029
        • Chart on Well service contractors - Market size and forecast 2024-2029 ($ million)
        • Data Table on Well service contractors - Market size and forecast 2024-2029 ($ million)
        • Chart on Well service contractors - Year-over-year growth 2024-2029 (%)
        • Data Table on Well service contractors - Year-over-year growth 2024-2029 (%)
      • 10.5 National oil companies (NOCs) - Market size and forecast 2024-2029
        • Chart on National oil companies (NOCs) - Market size and forecast 2024-2029 ($ million)
        • Data Table on National oil companies (NOCs) - Market size and forecast 2024-2029 ($ million)
        • Chart on National oil companies (NOCs) - Year-over-year growth 2024-2029 (%)
        • Data Table on National oil companies (NOCs) - Year-over-year growth 2024-2029 (%)
      • 10.6 Independent operators - Market size and forecast 2024-2029
        • Chart on Independent operators - Market size and forecast 2024-2029 ($ million)
        • Data Table on Independent operators - Market size and forecast 2024-2029 ($ million)
        • Chart on Independent operators - Year-over-year growth 2024-2029 (%)
        • Data Table on Independent operators - Year-over-year growth 2024-2029 (%)
      • 10.7 Market opportunity by End-user
        • Market opportunity by End-user ($ million)
        • Data Table on Market opportunity by End-user ($ million)

      11 Customer Landscape

      • 11.1 Customer landscape overview
        • Analysis of price sensitivity, lifecycle, customer purchase basket, adoption rates, and purchase criteria

      12 Geographic Landscape

      • 12.1 Geographic segmentation
        • Chart on Market share by geography 2024-2029 (%)
        • Data Table on Market share by geography 2024-2029 (%)
      • 12.2 Geographic comparison
        • Chart on Geographic comparison
        • Data Table on Geographic comparison
      • 12.3 North America - Market size and forecast 2024-2029
        • Chart on North America - Market size and forecast 2024-2029 ($ million)
        • Data Table on North America - Market size and forecast 2024-2029 ($ million)
        • Chart on North America - Year-over-year growth 2024-2029 (%)
        • Data Table on North America - Year-over-year growth 2024-2029 (%)
      • 12.4 Middle East and Africa - Market size and forecast 2024-2029
        • Chart on Middle East and Africa - Market size and forecast 2024-2029 ($ million)
        • Data Table on Middle East and Africa - Market size and forecast 2024-2029 ($ million)
        • Chart on Middle East and Africa - Year-over-year growth 2024-2029 (%)
        • Data Table on Middle East and Africa - Year-over-year growth 2024-2029 (%)
      • 12.5 APAC - Market size and forecast 2024-2029
        • Chart on APAC - Market size and forecast 2024-2029 ($ million)
        • Data Table on APAC - Market size and forecast 2024-2029 ($ million)
        • Chart on APAC - Year-over-year growth 2024-2029 (%)
        • Data Table on APAC - Year-over-year growth 2024-2029 (%)
      • 12.6 Europe - Market size and forecast 2024-2029
        • Chart on Europe - Market size and forecast 2024-2029 ($ million)
        • Data Table on Europe - Market size and forecast 2024-2029 ($ million)
        • Chart on Europe - Year-over-year growth 2024-2029 (%)
        • Data Table on Europe - Year-over-year growth 2024-2029 (%)
      • 12.7 South America - Market size and forecast 2024-2029
        • Chart on South America - Market size and forecast 2024-2029 ($ million)
        • Data Table on South America - Market size and forecast 2024-2029 ($ million)
        • Chart on South America - Year-over-year growth 2024-2029 (%)
        • Data Table on South America - Year-over-year growth 2024-2029 (%)
      • 12.8 US - Market size and forecast 2024-2029
        • Chart on US - Market size and forecast 2024-2029 ($ million)
        • Data Table on US - Market size and forecast 2024-2029 ($ million)
        • Chart on US - Year-over-year growth 2024-2029 (%)
        • Data Table on US - Year-over-year growth 2024-2029 (%)
      • 12.9 Canada - Market size and forecast 2024-2029
        • Chart on Canada - Market size and forecast 2024-2029 ($ million)
        • Data Table on Canada - Market size and forecast 2024-2029 ($ million)
        • Chart on Canada - Year-over-year growth 2024-2029 (%)
        • Data Table on Canada - Year-over-year growth 2024-2029 (%)
      • 12.10 Saudi Arabia - Market size and forecast 2024-2029
        • Chart on Saudi Arabia - Market size and forecast 2024-2029 ($ million)
        • Data Table on Saudi Arabia - Market size and forecast 2024-2029 ($ million)
        • Chart on Saudi Arabia - Year-over-year growth 2024-2029 (%)
        • Data Table on Saudi Arabia - Year-over-year growth 2024-2029 (%)
      • 12.11 China - Market size and forecast 2024-2029
        • Chart on China - Market size and forecast 2024-2029 ($ million)
        • Data Table on China - Market size and forecast 2024-2029 ($ million)
        • Chart on China - Year-over-year growth 2024-2029 (%)
        • Data Table on China - Year-over-year growth 2024-2029 (%)
      • 12.12 Russia - Market size and forecast 2024-2029
        • Chart on Russia - Market size and forecast 2024-2029 ($ million)
        • Data Table on Russia - Market size and forecast 2024-2029 ($ million)
        • Chart on Russia - Year-over-year growth 2024-2029 (%)
        • Data Table on Russia - Year-over-year growth 2024-2029 (%)
      • 12.13 Mexico - Market size and forecast 2024-2029
        • Chart on Mexico - Market size and forecast 2024-2029 ($ million)
        • Data Table on Mexico - Market size and forecast 2024-2029 ($ million)
        • Chart on Mexico - Year-over-year growth 2024-2029 (%)
        • Data Table on Mexico - Year-over-year growth 2024-2029 (%)
      • 12.14 UAE - Market size and forecast 2024-2029
        • Chart on UAE - Market size and forecast 2024-2029 ($ million)
        • Data Table on UAE - Market size and forecast 2024-2029 ($ million)
        • Chart on UAE - Year-over-year growth 2024-2029 (%)
        • Data Table on UAE - Year-over-year growth 2024-2029 (%)
      • 12.15 Brazil - Market size and forecast 2024-2029
        • Chart on Brazil - Market size and forecast 2024-2029 ($ million)
        • Data Table on Brazil - Market size and forecast 2024-2029 ($ million)
        • Chart on Brazil - Year-over-year growth 2024-2029 (%)
        • Data Table on Brazil - Year-over-year growth 2024-2029 (%)
      • 12.16 Japan - Market size and forecast 2024-2029
        • Chart on Japan - Market size and forecast 2024-2029 ($ million)
        • Data Table on Japan - Market size and forecast 2024-2029 ($ million)
        • Chart on Japan - Year-over-year growth 2024-2029 (%)
        • Data Table on Japan - Year-over-year growth 2024-2029 (%)
      • 12.17 South Africa - Market size and forecast 2024-2029
        • Chart on South Africa - Market size and forecast 2024-2029 ($ million)
        • Data Table on South Africa - Market size and forecast 2024-2029 ($ million)
        • Chart on South Africa - Year-over-year growth 2024-2029 (%)
        • Data Table on South Africa - Year-over-year growth 2024-2029 (%)
      • 12.18 Market opportunity by geography
        • Market opportunity by geography ($ million)
        • Data Tables on Market opportunity by geography ($ million)

      13 Drivers, Challenges, and Opportunity/Restraints

      • 13.1 Market drivers
        • 13.2 Market challenges
          • 13.3 Impact of drivers and challenges
            • Impact of drivers and challenges in 2024 and 2029
          • 13.4 Market opportunities/restraints

            14 Competitive Landscape

            • 14.1 Overview
              • 14.2 Competitive Landscape
                • Overview on criticality of inputs and factors of differentiation
              • 14.3 Landscape disruption
                • Overview on factors of disruption
              • 14.4 Industry risks
                • Impact of key risks on business

              15 Competitive Analysis

              • 15.1 Companies profiled
                • Companies covered
              • 15.2 Company ranking index
                • Company ranking index
              • 15.3 Market positioning of companies
                • Matrix on companies position and classification
              • 15.4 Baker Hughes Co.
                • Baker Hughes Co. - Overview
                • Baker Hughes Co. - Business segments
                • Baker Hughes Co. - Key news
                • Baker Hughes Co. - Key offerings
                • Baker Hughes Co. - Segment focus
                • SWOT
              • 15.5 Cactus Inc.
                • Cactus Inc. - Overview
                • Cactus Inc. - Product / Service
                • Cactus Inc. - Key offerings
                • SWOT
              • 15.6 Ensign Energy Services Inc.
                • Ensign Energy Services Inc. - Overview
                • Ensign Energy Services Inc. - Business segments
                • Ensign Energy Services Inc. - Key offerings
                • Ensign Energy Services Inc. - Segment focus
                • SWOT
              • 15.7 Halliburton Co.
                • Halliburton Co. - Overview
                • Halliburton Co. - Business segments
                • Halliburton Co. - Key news
                • Halliburton Co. - Key offerings
                • Halliburton Co. - Segment focus
                • SWOT
              • 15.8 Independence Contract Drilling
                • Independence Contract Drilling - Overview
                • Independence Contract Drilling - Product / Service
                • Independence Contract Drilling - Key offerings
                • SWOT
              • 15.9 MB LLC
                • MB LLC - Overview
                • MB LLC - Product / Service
                • MB LLC - Key offerings
                • SWOT
              • 15.10 MFF Oilfield Group
                • MFF Oilfield Group - Overview
                • MFF Oilfield Group - Product / Service
                • MFF Oilfield Group - Key offerings
                • SWOT
              • 15.11 MND SAS
                • MND SAS - Overview
                • MND SAS - Product / Service
                • MND SAS - Key offerings
                • SWOT
              • 15.12 Nabors Industries Ltd.
                • Nabors Industries Ltd. - Overview
                • Nabors Industries Ltd. - Business segments
                • Nabors Industries Ltd. - Key news
                • Nabors Industries Ltd. - Key offerings
                • Nabors Industries Ltd. - Segment focus
                • SWOT
              • 15.13 OiLSERV
                • OiLSERV - Overview
                • OiLSERV - Product / Service
                • OiLSERV - Key offerings
                • SWOT
              • 15.14 PR Marriott Drilling Ltd.
                • PR Marriott Drilling Ltd. - Overview
                • PR Marriott Drilling Ltd. - Product / Service
                • PR Marriott Drilling Ltd. - Key offerings
                • SWOT
              • 15.15 Precision Drilling Corp.
                • Precision Drilling Corp. - Overview
                • Precision Drilling Corp. - Business segments
                • Precision Drilling Corp. - Key offerings
                • Precision Drilling Corp. - Segment focus
                • SWOT
              • 15.16 Schlumberger Ltd.
                • Schlumberger Ltd. - Overview
                • Schlumberger Ltd. - Business segments
                • Schlumberger Ltd. - Key news
                • Schlumberger Ltd. - Key offerings
                • Schlumberger Ltd. - Segment focus
                • SWOT
              • 15.17 Total Energy Services Inc.
                • Total Energy Services Inc. - Overview
                • Total Energy Services Inc. - Product / Service
                • Total Energy Services Inc. - Key offerings
                • SWOT
              • 15.18 Transcontinental Energy Services LLC
                • Transcontinental Energy Services LLC - Overview
                • Transcontinental Energy Services LLC - Product / Service
                • Transcontinental Energy Services LLC - Key offerings
                • SWOT

              16 Appendix

              • 16.1 Scope of the report
                • 16.2 Inclusions and exclusions checklist
                  • Inclusions checklist
                  • Exclusions checklist
                • 16.3 Currency conversion rates for US$
                  • Currency conversion rates for US$
                • 16.4 Research methodology
                  • Research methodology
                • 16.5 Data procurement
                  • Information sources
                • 16.6 Data validation
                  • Data validation
                • 16.7 Validation techniques employed for market sizing
                  • Validation techniques employed for market sizing
                • 16.8 Data synthesis
                  • Data synthesis
                • 16.9 360 degree market analysis
                  • 360 degree market analysis
                • 16.10 List of abbreviations
                  • List of abbreviations

                Research Methodology

                Technavio presents a detailed picture of the market by way of study, synthesis, and summation of data from multiple sources. The analysts have presented the various facets of the market with a particular focus on identifying the key industry influencers. The data thus presented is comprehensive, reliable, and the result of extensive research, both primary and secondary.

                INFORMATION SOURCES

                Primary sources

                • Manufacturers and suppliers
                • Channel partners
                • Industry experts
                • Strategic decision makers

                Secondary sources

                • Industry journals and periodicals
                • Government data
                • Financial reports of key industry players
                • Historical data
                • Press releases

                DATA ANALYSIS

                Data Synthesis

                • Collation of data
                • Estimation of key figures
                • Analysis of derived insights

                Data Validation

                • Triangulation with data models
                • Reference against proprietary databases
                • Corroboration with industry experts

                REPORT WRITING

                Qualitative

                • Market drivers
                • Market challenges
                • Market trends
                • Five forces analysis

                Quantitative

                • Market size and forecast
                • Market segmentation
                • Geographical insights
                • Competitive landscape

                Interested in this report?

                Get your sample now to see our research methodology and insights!

                Download Now

                Frequently Asked Questions

                Workover Rigs market growth will increase by $ 536.7 mn during 2025-2029.

                The Workover Rigs market is expected to grow at a CAGR of 4.6% during 2025-2029.

                Workover Rigs market is segmented by Application( Onshore, Offshore) Type( Single drum, Double drum, APAC, Europe, South America) End-user( Oil and gas, Well service contractors, National oil companies (NOCs), Independent operators, South America)

                Baker Hughes Co., Cactus Inc., Drillmec Spa, Ensign Energy Services Inc., Halliburton Co., Independence Contract Drilling, L and T Technology Services Ltd., MB LLC, MFF Oilfield Group, MND SAS, Nabors Industries Ltd., National Energy Services Reunited Corp., Oil India Ltd., OiLSERV, PR Marriott Drilling Ltd., Precision Drilling Corp., Schlumberger Ltd., Total Energy Services Inc., Transcontinental Energy Services LLC are a few of the key vendors in the Workover Rigs market.

                North America will register the highest growth rate of 46% among the other regions. Therefore, the Workover Rigs market in North America is expected to garner significant business opportunities for the vendors during the forecast period.

                US, Canada, Saudi Arabia, China, Russia, Mexico, UAE, Brazil, South Africa, Japan

                • Technological advancements in drilling and workover technologiesAutomation and robotics are increasingly being integrated into workover rigs to improve operational efficiency and reduce the need for manual intervention. Automated systems can handle repetitive tasks is the driving factor this market.
                • increasing safety and accuracy during operations. Technological advancements in downhole tools is the driving factor this market.
                • such as logging and measurement-while-drilling (LWD/MWD) tools is the driving factor this market.
                • provide detailed information about the wellbore conditions. This data help in assessing reservoir characteristics is the driving factor this market.
                • identifying production issues is the driving factor this market.
                • and planning effective workover interventions. Workover rigs are increasingly adopting electric drives and power systems. Electric rigs offer improved energy efficiency is the driving factor this market.
                • reduced emissions is the driving factor this market.
                • and enhanced control during drilling and intervention activities. Fiber optic sensing technology is utilized for downhole monitoring is the driving factor this market.
                • providing real-time data on temperature is the driving factor this market.
                • pressure is the driving factor this market.
                • and strain. This information aids in understanding conditions and detecting any anomalies that may require workover interventions. Integrated well-intervention systems combine multiple functions into a single platform. These systems may include wireline units is the driving factor this market.
                • coiled tubing units is the driving factor this market.
                • and pumping systems is the driving factor this market.
                • providing a versatile approach to well intervention activities. Moreover is the driving factor this market.
                • innovations in drilling fluids is the driving factor this market.
                • including environmentally friendly fluids and improved mud systems is the driving factor this market.
                • contribute to more efficient drilling and workover operations. These advancements aim to enhance the stability of wellbore and reduce environmental impact. Thus is the driving factor this market.
                • the technological advancements in drilling and workover technologies will boost the growth of the global workover rigs market during the forecast period. is the driving factor this market.

                The Workover Rigs market vendors should focus on grabbing business opportunities from the Onshore segment as it accounted for the largest market share in the base year.