Women Health App Market Analysis, Size, and Forecast 2026-2030: North America (US, Canada, and Mexico), Europe (Germany, UK, and France), APAC (China, Japan, and India), South America (Brazil, Argentina, and Colombia), Middle East and Africa (Saudi Arabia, UAE, and Israel), and Rest of World (ROW)

Women Health App Market Analysis, Size, and Forecast 2026-2030:
North America (US, Canada, and Mexico), Europe (Germany, UK, and France), APAC (China, Japan, and India), South America (Brazil, Argentina, and Colombia), Middle East and Africa (Saudi Arabia, UAE, and Israel), and Rest of World (ROW)

Published: Jan 2026 287 Pages SKU: IRTNTR74660

Market Overview at a Glance

$5.70 B
Market Opportunity
24.9%
CAGR 2025 - 2030
42.1%
North America Growth
$767.6 Mn
Menstrual health segment 2024

Women Health App Market Size 2026-2030

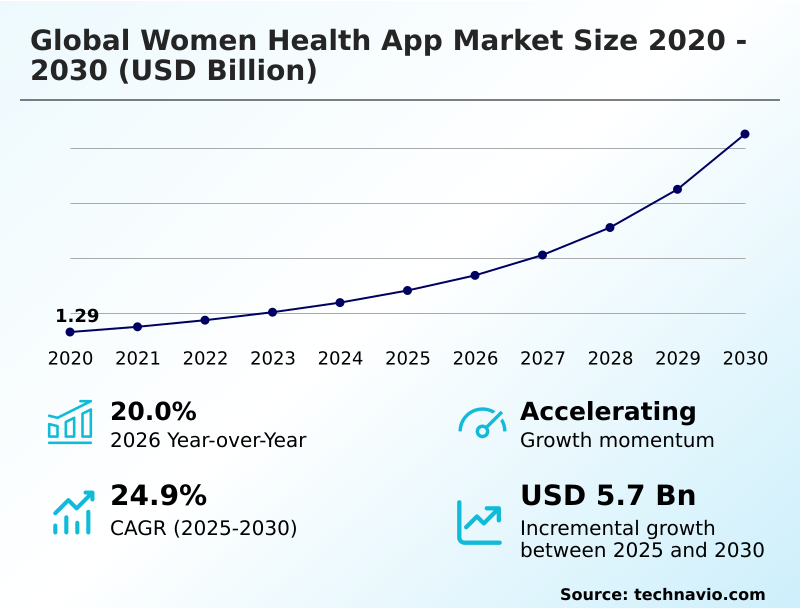
The women health app market size is valued to increase by USD 5.70 billion, at a CAGR of 24.9% from 2025 to 2030. Rising health consciousness and demand for personalized healthcare will drive the women health app market.

Major Market Trends & Insights

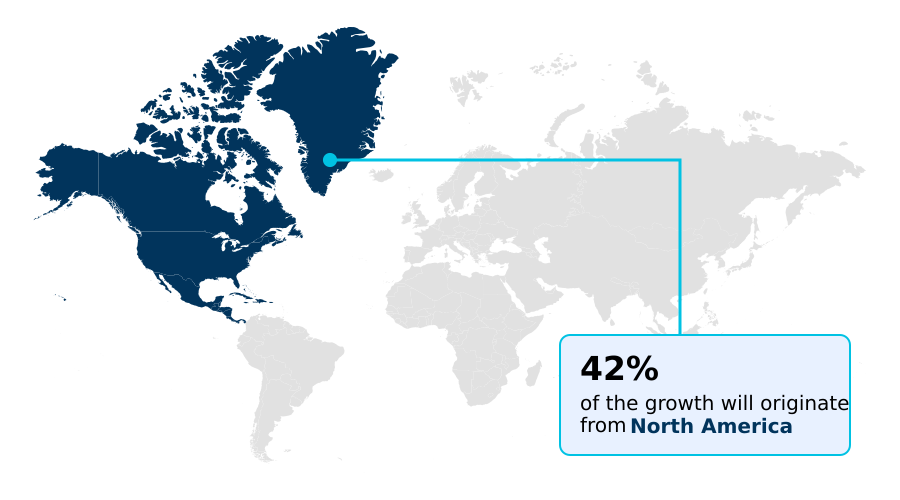
  • North America dominated the market and accounted for a 42.1% growth during the forecast period.
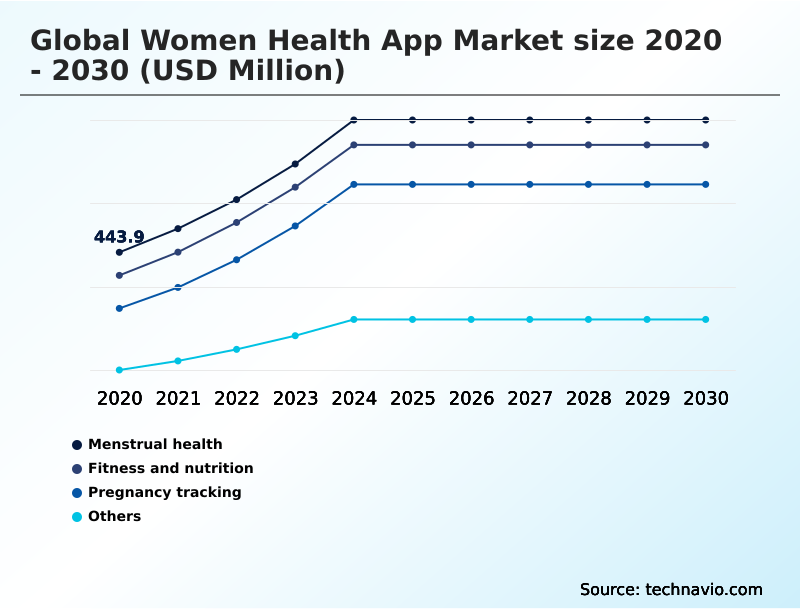
  • By Type - Menstrual health segment was valued at USD 767.6 million in 2024
  • By Modality - Smartphone segment accounted for the largest market revenue share in 2024

Market Size & Forecast

  • Market Opportunities: USD 7.20 billion
  • Market Future Opportunities: USD 5.70 billion
  • CAGR from 2025 to 2030 : 24.9%

Market Summary

  • The women health app market is experiencing accelerated growth, evolving from a niche category into a core component of the digital health landscape. This expansion is driven by a societal shift toward proactive, preventative wellness and the increasing ubiquity of smartphones.
  • Applications now offer more than just menstrual cycle tracking; they provide sophisticated tools for fertility and ovulation prediction, pregnancy and postpartum monitoring, and comprehensive hormonal health management. The integration of AI-driven personalization allows for predictive health insights tailored to individual biometric data, fostering greater self-advocacy in healthcare.
  • For instance, a user leveraging long-term symptom logging and analysis alongside biometric data synchronization from a wearable can have a more informed, productive conversation with her healthcare provider about potential irregularities. However, the industry grapples with challenges related to data privacy and security, as platforms must adhere to strict regulations like the HIPAA compliance framework while building user trust.
  • The market is also characterized by intense competition, pushing vendors toward specialization and deeper integration with the formal healthcare system through virtual care platforms and telehealth consultations.

What will be the Size of the Women Health App Market during the forecast period?

Get Key Insights on Market Forecast (PDF) Request Free Sample

How is the Women Health App Market Segmented?

The women health app industry research report provides comprehensive data (region-wise segment analysis), with forecasts and estimates in "USD million" for the period 2026-2030, as well as historical data from 2020-2024 for the following segments.

  • Type
    • Menstrual health
    • Fitness and nutrition
    • Pregnancy tracking
    • Others
  • Modality
    • Smartphone
    • Tablet
    • Others
  • Age group
    • 15 to 30 years
    • 31 to 40 years
    • 41 years and above
  • Geography
    • North America
      • US
      • Canada
      • Mexico
    • Europe
      • Germany
      • UK
      • France
    • APAC
      • China
      • Japan
      • India
    • South America
      • Brazil
      • Argentina
      • Colombia
    • Middle East and Africa
      • Saudi Arabia
      • UAE
      • Israel
    • Rest of World (ROW)

By Type Insights

The menstrual health segment is estimated to witness significant growth during the forecast period.

The menstrual health segment is the foundational component of the women health app market, evolving from simple digital calendars to sophisticated platforms for reproductive and hormonal health management.

This segment's growth is driven by its wide user base and critical functions in tracking fertility and ovulation. Modern applications utilize AI-driven personalization to offer predictive health insights, analyzing user-inputted data on flow, pain, and mood to identify patterns.

The integration with wearables enhances clinical accuracy validation, with some platforms achieving over 95% accuracy in cycle prediction.

This move towards proactive health management, supported by personalized content delivery, solidifies these apps as essential tools, turning them into a form of software as a medical device (SaMD) that enhances user engagement and retention.

Request Free Sample

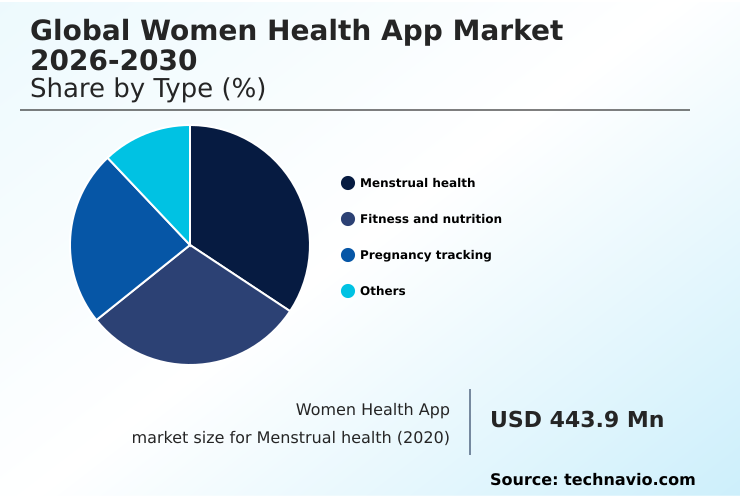
The Menstrual health segment was valued at USD 767.6 million in 2024 and showed a gradual increase during the forecast period.

Request Free Sample

Regional Analysis

North America is estimated to contribute 42.1% to the growth of the global market during the forecast period.Technavio’s analysts have elaborately explained the regional trends and drivers that shape the market during the forecast period.

See How Women Health App Market Demand is Rising in North America Request Free Sample

The geographic landscape of the women health app market is characterized by significant regional disparities in maturity and growth potential.

North America leads, accounting for over 42% of the incremental growth opportunity, driven by high digital literacy, a robust venture capital ecosystem, and increasing integration with employer-sponsored health plans.

This is followed by Europe and APAC, which represent substantial but more fragmented markets. The APAC region, however, is projected to demonstrate the highest regional growth rate at 25.8%, fueled by rising smartphone adoption and a growing middle class.

The market for menopause symptom management and virtual care platforms is expanding globally, but adoption rates are highest in developed regions. These trends underscore the importance of localized strategies that address regional regulatory environments and cultural attitudes toward digital health.
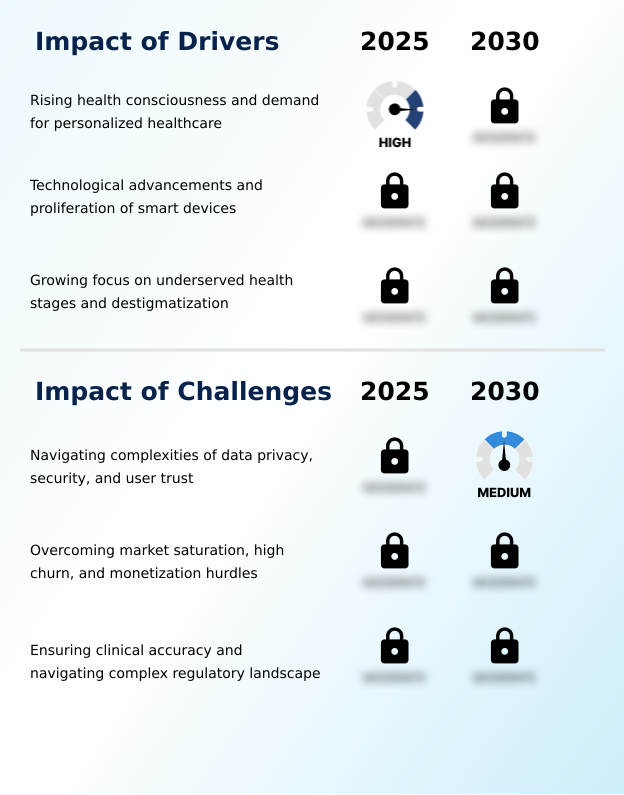
Market Dynamics

Our researchers analyzed the data with 2025 as the base year, along with the key drivers, trends, and challenges. A holistic analysis of drivers will help companies refine their marketing strategies to gain a competitive advantage.

  • The evolution of the women health app market is increasingly defined by its ability to address specific, nuanced health journeys. For users, the focus is shifting from generic tracking to specialized support, with many actively comparing free vs paid period trackers to find platforms that offer superior AI-based ovulation prediction accuracy and robust user experience in fertility applications.
  • The growing demand for digital tools for perimenopause support and tracking hormonal changes during menopause highlights the market's expansion across the female lifespan. Furthermore, apps are becoming crucial for managing chronic conditions; dedicated app features for endometriosis management and tools for tracking PCOS symptoms with mobile apps can double user engagement compared to general wellness platforms.
  • This specialization extends to using health apps for family planning, managing pregnancy with tracking apps, and leveraging postpartum recovery support through apps. From a provider perspective, telehealth for reproductive health issues and the benefits of virtual prenatal care are transforming care delivery. For enterprises, offering corporate wellness and fertility benefits and employer programs for menopause support are becoming competitive differentiators.
  • However, this entire ecosystem hinges on trust, making data security in women's health apps and transparent privacy policies of femtech applications paramount. As users increasingly consider integrating fertility apps with wearables and navigating fertility treatments with apps, the emphasis on mental health tracking in period apps and the effectiveness of cycle syncing for fitness will continue to shape platform development.

What are the key market drivers leading to the rise in the adoption of Women Health App Industry?

  • The market is fundamentally driven by rising health consciousness among consumers and a growing demand for personalized, data-driven healthcare solutions.

  • The market's primary driver is the growing consumer demand for proactive self-advocacy in healthcare, enabled by digital tools. Applications offering precise fertility and ovulation prediction and detailed pregnancy and postpartum monitoring empower users with critical health information.
  • This trend extends to corporate wellness benefits, where platforms offering telehealth consultations and personalized fitness regimens are gaining traction in B2B enterprise channels. Integration into these programs has demonstrated a 15% increase in employee retention for participating companies.
  • Furthermore, the focus on reproductive health education and patient-provider collaboration, facilitated by these apps, leads to more informed health decisions, with users reporting a 50% improvement in health literacy concerning cycle-based nutrition planning and overall wellness.

What are the market trends shaping the Women Health App Industry?

  • A defining market trend is the shift toward hyper-personalization, driven by advanced artificial intelligence and machine learning algorithms that transform applications into intelligent health companions.

  • A defining trend in the women health app market is the move toward hyper-personalized, holistic wellness tracking powered by machine learning algorithms. The integration with wearables facilitates passive data collection, such as basal body temperature tracking, which improves the accuracy of hormonal health management.
  • AI models enhance anomaly detection by over 40% compared to manual methods, providing users with earlier warnings of potential health issues. This sophisticated user interface/experience design, often incorporating gamification in health tracking, drives engagement.
  • The result is a shift from simple logging to evidence-based health programs, where integration with smart devices increases overall data fidelity by more than 25%, making the insights more actionable for both users and connected healthcare providers.

What challenges does the Women Health App Industry face during its growth?

  • A primary challenge for the market is navigating the complexities of data privacy and security, which requires establishing and maintaining user trust.

  • Navigating data privacy and monetization remains the market's most significant challenge. The use of freemium monetization models and subscription-based revenue often creates tension with the need for stringent user data privacy and security. Platforms must invest in robust end-to-end data encryption and transparently manage user-consented data sharing to build trust.
  • Failure to adhere to standards like the HIPAA compliance framework or GDPR data protection can be catastrophic, as the cost of a data breach can exceed initial development investment by over 200%.
  • As a result, applications with clear, ethical data policies see user trust scores that are 30% higher than those with ambiguous terms, mitigating the high churn rates associated with this competitive market.

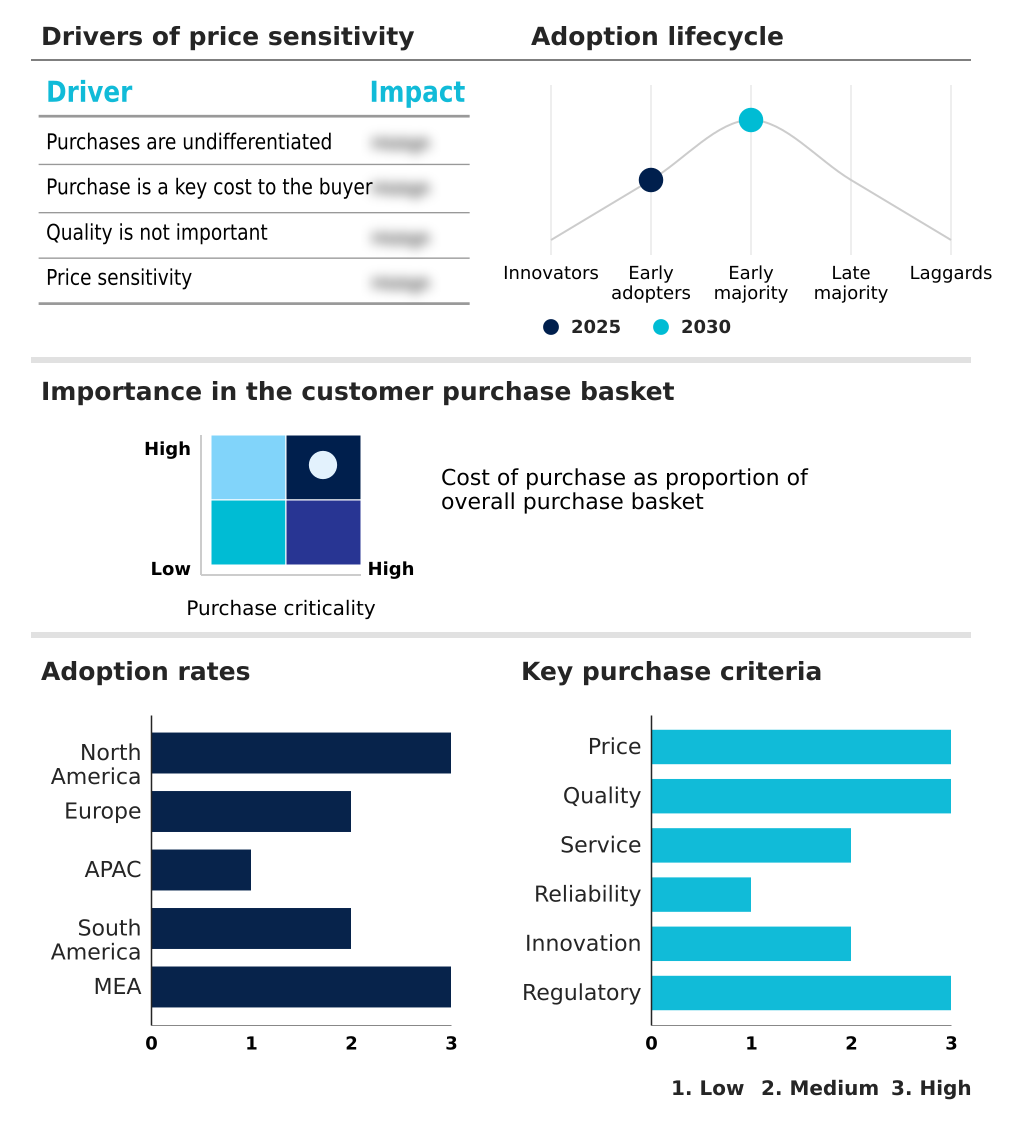
Exclusive Technavio Analysis on Customer Landscape

The women health app market forecasting report includes the adoption lifecycle of the market, covering from the innovator’s stage to the laggard’s stage. It focuses on adoption rates in different regions based on penetration. Furthermore, the women health app market report also includes key purchase criteria and drivers of price sensitivity to help companies evaluate and develop their market growth analysis strategies.

Customer Landscape of Women Health App Industry

Competitive Landscape

Companies are implementing various strategies, such as strategic alliances, women health app market forecast, partnerships, mergers and acquisitions, geographical expansion, and product/service launches, to enhance their presence in the industry.

BabyCenter LLC - Offers an AI-powered platform for women's health, delivering accurate cycle predictions, personalized insights, and access to a secure community of experts for comprehensive wellness management.

The industry research and growth report includes detailed analyses of the competitive landscape of the market and information about key companies, including:

  • BabyCenter LLC
  • BioWink GmbH
  • Cycles
  • Flo Health UK Ltd.
  • Glow Inc.
  • Kin Fertility
  • Maven Clinic Co.
  • Natural Cycles Nordic
  • Ovuline Inc.
  • Peppy Health Ltd
  • Premom
  • Rosy
  • Simple Design Ltd
  • the BUMP
  • Tia Inc.
  • WILD AI
  • Willow Innovations Inc.

Qualitative and quantitative analysis of companies has been conducted to help clients understand the wider business environment as well as the strengths and weaknesses of key industry players. Data is qualitatively analyzed to categorize companies as pure play, category-focused, industry-focused, and diversified; it is quantitatively analyzed to categorize companies as dominant, leading, strong, tentative, and weak.

Recent Development and News in Women health app market

  • In September 2024, Maven Clinic announced a strategic partnership with a national insurance carrier, integrating its virtual care services for fertility, maternity, and menopause directly into the insurer's primary health plans for millions of members.
  • In November 2024, Ovum, a medtech startup, secured significant venture capital to launch an advanced AI health assistant designed to create a woman-specific dataset and integrate medical information for holistic condition management.
  • In February 2025, NHS Cheshire and Merseyside launched a dedicated women's health app, providing residents with a single, trusted source for health information and marking a significant endorsement from a public healthcare provider.
  • In April 2025, Aperture Technologies and Flo Health announced a partnership to integrate a novel, non-invasive biometric sensor in a flagship smartphone, allowing the app to analyze hormonal fluctuations through passive data collection.

Dive into Technavio’s robust research methodology, blending expert interviews, extensive data synthesis, and validated models for unparalleled Women Health App Market insights. See full methodology.

Market Scope
Page number 287
Base year 2025
Historic period 2020-2024
Forecast period 2026-2030
Growth momentum & CAGR Accelerate at a CAGR of 24.9%
Market growth 2026-2030 USD 5698.3 million
Market structure Fragmented
YoY growth 2025-2026(%) 20.0%
Key countries US, Canada, Mexico, Germany, UK, France, Italy, Spain, The Netherlands, China, Japan, India, South Korea, Australia, Indonesia, Brazil, Argentina, Colombia, Saudi Arabia, UAE, Israel, South Africa and Turkey
Competitive landscape Leading Companies, Market Positioning of Companies, Competitive Strategies, and Industry Risks

Request Free Sample

Research Analyst Overview

  • The women health app market is undergoing a critical transformation from consumer-grade trackers to clinically relevant health management tools. This strategic pivot is centered on the development of virtual care platforms and applications seeking classification as software as a medical device (SaMD).
  • The integration of AI-driven personalization and sophisticated machine learning algorithms enables precise menstrual cycle tracking, fertility and ovulation prediction, and comprehensive pregnancy and postpartum monitoring. Advanced features like basal body temperature tracking and heart rate variability monitoring, often enabled by wearable device integration, allow for passive data collection and generate predictive health insights previously unavailable outside a clinical setting.
  • This evolution allows for specialized support, including menopause symptom management, cycle-based nutrition planning, and personalized fitness regimens. Boardroom-level decisions are now focused on securing this sensitive information through end-to-end data encryption and ensuring both HIPAA compliance framework and GDPR data protection.
  • Clinically validated platforms that facilitate telehealth consultations have demonstrated the ability to reduce unnecessary clinic visits by up to 25%, proving the tangible ROI of investing in digital contraception methods and non-invasive hormonal analysis platforms that prioritize both innovation and security.

What are the Key Data Covered in this Women Health App Market Research and Growth Report?

  • What is the expected growth of the Women Health App Market between 2026 and 2030?

    • USD 5.70 billion, at a CAGR of 24.9%

  • What segmentation does the market report cover?

    • The report is segmented by Type (Menstrual health, Fitness and nutrition, Pregnancy tracking, and Others), Modality (Smartphone, Tablet, and Others), Age Group (15 to 30 years, 31 to 40 years, and 41 years and above) and Geography (North America, Europe, APAC, South America, Middle East and Africa)

  • Which regions are analyzed in the report?

    • North America, Europe, APAC, South America and Middle East and Africa

  • What are the key growth drivers and market challenges?

    • Rising health consciousness and demand for personalized healthcare, Navigating complexities of data privacy, security, and user trust

  • Who are the major players in the Women Health App Market?

    • BabyCenter LLC, BioWink GmbH, Cycles, Flo Health UK Ltd., Glow Inc., Kin Fertility, Maven Clinic Co., Natural Cycles Nordic, Ovuline Inc., Peppy Health Ltd, Premom, Rosy, Simple Design Ltd, the BUMP, Tia Inc., WILD AI and Willow Innovations Inc.

Market Research Insights

  • The women health app market is characterized by a strategic shift from basic tracking to integrated digital therapeutic interventions. Platforms offering these advanced, evidence-based health programs demonstrate a 20% higher user retention rate compared to standard applications.
  • This evolution is mirrored in the B2B enterprise channels, where adoption in employer-sponsored health plans has increased by over 60% in the last two years alone, reflecting a growing corporate focus on women's health as a key component of employee wellness.
  • This transition is supported by advances in consumer health informatics, which enable more sophisticated, data-driven lifestyle choices and facilitate deeper patient-provider collaboration, ultimately improving health outcomes and market penetration.

We can help! Our analysts can customize this women health app market research report to meet your requirements.

Get in touch

1. Executive Summary

1.1 Market overview

Executive Summary - Chart on Market Overview
Executive Summary - Data Table on Market Overview
Executive Summary - Chart on Global Market Characteristics
Executive Summary - Chart on Market by Geography
Executive Summary - Chart on Market Segmentation by Type
Executive Summary - Chart on Market Segmentation by Modality
Executive Summary - Chart on Market Segmentation by Age Group
Executive Summary - Chart on Incremental Growth
Executive Summary - Data Table on Incremental Growth
Executive Summary - Chart on Company Market Positioning

2. Technavio Analysis

2.1 Analysis of price sensitivity, lifecycle, customer purchase basket, adoption rates, and purchase criteria

2.2 Criticality of inputs and Factors of differentiation

Chart on Overview on criticality of inputs and factors of differentiation

2.3 Factors of disruption

Chart on Overview on factors of disruption

2.4 Impact of drivers and challenges

Chart on Impact of drivers and challenges in 2025 and 2030

3. Market Landscape

3.1 Market ecosystem

Chart on Parent Market
Data Table on - Parent Market

3.2 Market characteristics

Chart on Market characteristics analysis

3.3 Value chain analysis

Chart on Value chain analysis

4. Market Sizing

4.1 Market definition

Data Table on Offerings of companies included in the market definition

4.2 Market segment analysis

Market segments

4.3 Market size 2025

4.4 Market outlook: Forecast for 2025-2030

Chart on Global - Market size and forecast 2025-2030 ($ million)
Data Table on Global - Market size and forecast 2025-2030 ($ million)
Chart on Global Market: Year-over-year growth 2025-2030 (%)
Data Table on Global Market: Year-over-year growth 2025-2030 (%)

5. Historic Market Size

5.1 Global Women Health App Market 2020 - 2024

Historic Market Size - Data Table on Global Women Health App Market 2020 - 2024 ($ million)

5.2 Type segment analysis 2020 - 2024

Historic Market Size - Type Segment 2020 - 2024 ($ million)

5.3 Modality segment analysis 2020 - 2024

Historic Market Size - Modality Segment 2020 - 2024 ($ million)

5.4 Age Group segment analysis 2020 - 2024

Historic Market Size - Age Group Segment 2020 - 2024 ($ million)

5.5 Geography segment analysis 2020 - 2024

Historic Market Size - Geography Segment 2020 - 2024 ($ million)

5.6 Country segment analysis 2020 - 2024

Historic Market Size - Country Segment 2020 - 2024 ($ million)

6. Qualitative Analysis

6.1 The AI impact on global women health app market

7. Five Forces Analysis

7.1 Five forces summary

Five forces analysis - Comparison between 2025 and 2030

7.2 Bargaining power of buyers

Bargaining power of buyers - Impact of key factors 2025 and 2030

7.3 Bargaining power of suppliers

Bargaining power of suppliers - Impact of key factors in 2025 and 2030

7.4 Threat of new entrants

Threat of new entrants - Impact of key factors in 2025 and 2030

7.5 Threat of substitutes

Threat of substitutes - Impact of key factors in 2025 and 2030

7.6 Threat of rivalry

Threat of rivalry - Impact of key factors in 2025 and 2030

7.7 Market condition

Chart on Market condition - Five forces 2025 and 2030

8. Market Segmentation by Type

8.1 Market segments

Chart on Type - Market share 2025-2030 (%)
Data Table on Type - Market share 2025-2030 (%)

8.2 Comparison by Type

Chart on Comparison by Type
Data Table on Comparison by Type

8.3 Menstrual health - Market size and forecast 2025-2030

Chart on Menstrual health - Market size and forecast 2025-2030 ($ million)
Data Table on Menstrual health - Market size and forecast 2025-2030 ($ million)
Chart on Menstrual health - Year-over-year growth 2025-2030 (%)
Data Table on Menstrual health - Year-over-year growth 2025-2030 (%)

8.4 Fitness and nutrition - Market size and forecast 2025-2030

Chart on Fitness and nutrition - Market size and forecast 2025-2030 ($ million)
Data Table on Fitness and nutrition - Market size and forecast 2025-2030 ($ million)
Chart on Fitness and nutrition - Year-over-year growth 2025-2030 (%)
Data Table on Fitness and nutrition - Year-over-year growth 2025-2030 (%)

8.5 Pregnancy tracking - Market size and forecast 2025-2030

Chart on Pregnancy tracking - Market size and forecast 2025-2030 ($ million)
Data Table on Pregnancy tracking - Market size and forecast 2025-2030 ($ million)
Chart on Pregnancy tracking - Year-over-year growth 2025-2030 (%)
Data Table on Pregnancy tracking - Year-over-year growth 2025-2030 (%)

8.6 Others - Market size and forecast 2025-2030

Chart on Others - Market size and forecast 2025-2030 ($ million)
Data Table on Others - Market size and forecast 2025-2030 ($ million)
Chart on Others - Year-over-year growth 2025-2030 (%)
Data Table on Others - Year-over-year growth 2025-2030 (%)

8.7 Market opportunity by Type

Market opportunity by Type ($ million)
Data Table on Market opportunity by Type ($ million)

9. Market Segmentation by Modality

9.1 Market segments

Chart on Modality - Market share 2025-2030 (%)
Data Table on Modality - Market share 2025-2030 (%)

9.2 Comparison by Modality

Chart on Comparison by Modality
Data Table on Comparison by Modality

9.3 Smartphone - Market size and forecast 2025-2030

Chart on Smartphone - Market size and forecast 2025-2030 ($ million)
Data Table on Smartphone - Market size and forecast 2025-2030 ($ million)
Chart on Smartphone - Year-over-year growth 2025-2030 (%)
Data Table on Smartphone - Year-over-year growth 2025-2030 (%)

9.4 Tablet - Market size and forecast 2025-2030

Chart on Tablet - Market size and forecast 2025-2030 ($ million)
Data Table on Tablet - Market size and forecast 2025-2030 ($ million)
Chart on Tablet - Year-over-year growth 2025-2030 (%)
Data Table on Tablet - Year-over-year growth 2025-2030 (%)

9.5 Others - Market size and forecast 2025-2030

Chart on Others - Market size and forecast 2025-2030 ($ million)
Data Table on Others - Market size and forecast 2025-2030 ($ million)
Chart on Others - Year-over-year growth 2025-2030 (%)
Data Table on Others - Year-over-year growth 2025-2030 (%)

9.6 Market opportunity by Modality

Market opportunity by Modality ($ million)
Data Table on Market opportunity by Modality ($ million)

10. Market Segmentation by Age Group

10.1 Market segments

Chart on Age Group - Market share 2025-2030 (%)
Data Table on Age Group - Market share 2025-2030 (%)

10.2 Comparison by Age Group

Chart on Comparison by Age Group
Data Table on Comparison by Age Group

10.3 15 to 30 years - Market size and forecast 2025-2030

Chart on 15 to 30 years - Market size and forecast 2025-2030 ($ million)
Data Table on 15 to 30 years - Market size and forecast 2025-2030 ($ million)
Chart on 15 to 30 years - Year-over-year growth 2025-2030 (%)
Data Table on 15 to 30 years - Year-over-year growth 2025-2030 (%)

10.4 31 to 40 years - Market size and forecast 2025-2030

Chart on 31 to 40 years - Market size and forecast 2025-2030 ($ million)
Data Table on 31 to 40 years - Market size and forecast 2025-2030 ($ million)
Chart on 31 to 40 years - Year-over-year growth 2025-2030 (%)
Data Table on 31 to 40 years - Year-over-year growth 2025-2030 (%)

10.5 41 years and above - Market size and forecast 2025-2030

Chart on 41 years and above - Market size and forecast 2025-2030 ($ million)
Data Table on 41 years and above - Market size and forecast 2025-2030 ($ million)
Chart on 41 years and above - Year-over-year growth 2025-2030 (%)
Data Table on 41 years and above - Year-over-year growth 2025-2030 (%)

10.6 Market opportunity by Age Group

Market opportunity by Age Group ($ million)
Data Table on Market opportunity by Age Group ($ million)

11. Customer Landscape

11.1 Customer landscape overview

Analysis of price sensitivity, lifecycle, customer purchase basket, adoption rates, and purchase criteria

12. Geographic Landscape

12.1 Geographic segmentation

Chart on Market share by geography 2025-2030 (%)
Data Table on Market share by geography 2025-2030 (%)

12.2 Geographic comparison

Chart on Geographic comparison
Data Table on Geographic comparison

12.3 North America - Market size and forecast 2025-2030

Chart on North America - Market size and forecast 2025-2030 ($ million)
Data Table on North America - Market size and forecast 2025-2030 ($ million)
Chart on North America - Year-over-year growth 2025-2030 (%)
Data Table on North America - Year-over-year growth 2025-2030 (%)
Chart on Regional Comparison - North America
Data Table on Regional Comparison - North America

12.3.1 US - Market size and forecast 2025-2030

Chart on US - Market size and forecast 2025-2030 ($ million)
Data Table on US - Market size and forecast 2025-2030 ($ million)
Chart on US - Year-over-year growth 2025-2030 (%)
Data Table on US - Year-over-year growth 2025-2030 (%)

12.3.2 Canada - Market size and forecast 2025-2030

Chart on Canada - Market size and forecast 2025-2030 ($ million)
Data Table on Canada - Market size and forecast 2025-2030 ($ million)
Chart on Canada - Year-over-year growth 2025-2030 (%)
Data Table on Canada - Year-over-year growth 2025-2030 (%)

12.3.3 Mexico - Market size and forecast 2025-2030

Chart on Mexico - Market size and forecast 2025-2030 ($ million)
Data Table on Mexico - Market size and forecast 2025-2030 ($ million)
Chart on Mexico - Year-over-year growth 2025-2030 (%)
Data Table on Mexico - Year-over-year growth 2025-2030 (%)

12.4 Europe - Market size and forecast 2025-2030

Chart on Europe - Market size and forecast 2025-2030 ($ million)
Data Table on Europe - Market size and forecast 2025-2030 ($ million)
Chart on Europe - Year-over-year growth 2025-2030 (%)
Data Table on Europe - Year-over-year growth 2025-2030 (%)
Chart on Regional Comparison - Europe
Data Table on Regional Comparison - Europe

12.4.1 Germany - Market size and forecast 2025-2030

Chart on Germany - Market size and forecast 2025-2030 ($ million)
Data Table on Germany - Market size and forecast 2025-2030 ($ million)
Chart on Germany - Year-over-year growth 2025-2030 (%)
Data Table on Germany - Year-over-year growth 2025-2030 (%)

12.4.2 UK - Market size and forecast 2025-2030

Chart on UK - Market size and forecast 2025-2030 ($ million)
Data Table on UK - Market size and forecast 2025-2030 ($ million)
Chart on UK - Year-over-year growth 2025-2030 (%)
Data Table on UK - Year-over-year growth 2025-2030 (%)

12.4.3 France - Market size and forecast 2025-2030

Chart on France - Market size and forecast 2025-2030 ($ million)
Data Table on France - Market size and forecast 2025-2030 ($ million)
Chart on France - Year-over-year growth 2025-2030 (%)
Data Table on France - Year-over-year growth 2025-2030 (%)

12.4.4 Italy - Market size and forecast 2025-2030

Chart on Italy - Market size and forecast 2025-2030 ($ million)
Data Table on Italy - Market size and forecast 2025-2030 ($ million)
Chart on Italy - Year-over-year growth 2025-2030 (%)
Data Table on Italy - Year-over-year growth 2025-2030 (%)

12.4.5 Spain - Market size and forecast 2025-2030

Chart on Spain - Market size and forecast 2025-2030 ($ million)
Data Table on Spain - Market size and forecast 2025-2030 ($ million)
Chart on Spain - Year-over-year growth 2025-2030 (%)
Data Table on Spain - Year-over-year growth 2025-2030 (%)

12.4.6 The Netherlands - Market size and forecast 2025-2030

Chart on The Netherlands - Market size and forecast 2025-2030 ($ million)
Data Table on The Netherlands - Market size and forecast 2025-2030 ($ million)
Chart on The Netherlands - Year-over-year growth 2025-2030 (%)
Data Table on The Netherlands - Year-over-year growth 2025-2030 (%)

12.5 APAC - Market size and forecast 2025-2030

Chart on APAC - Market size and forecast 2025-2030 ($ million)
Data Table on APAC - Market size and forecast 2025-2030 ($ million)
Chart on APAC - Year-over-year growth 2025-2030 (%)
Data Table on APAC - Year-over-year growth 2025-2030 (%)
Chart on Regional Comparison - APAC
Data Table on Regional Comparison - APAC

12.5.1 China - Market size and forecast 2025-2030

Chart on China - Market size and forecast 2025-2030 ($ million)
Data Table on China - Market size and forecast 2025-2030 ($ million)
Chart on China - Year-over-year growth 2025-2030 (%)
Data Table on China - Year-over-year growth 2025-2030 (%)

12.5.2 Japan - Market size and forecast 2025-2030

Chart on Japan - Market size and forecast 2025-2030 ($ million)
Data Table on Japan - Market size and forecast 2025-2030 ($ million)
Chart on Japan - Year-over-year growth 2025-2030 (%)
Data Table on Japan - Year-over-year growth 2025-2030 (%)

12.5.3 India - Market size and forecast 2025-2030

Chart on India - Market size and forecast 2025-2030 ($ million)
Data Table on India - Market size and forecast 2025-2030 ($ million)
Chart on India - Year-over-year growth 2025-2030 (%)
Data Table on India - Year-over-year growth 2025-2030 (%)

12.5.4 South Korea - Market size and forecast 2025-2030

Chart on South Korea - Market size and forecast 2025-2030 ($ million)
Data Table on South Korea - Market size and forecast 2025-2030 ($ million)
Chart on South Korea - Year-over-year growth 2025-2030 (%)
Data Table on South Korea - Year-over-year growth 2025-2030 (%)

12.5.5 Australia - Market size and forecast 2025-2030

Chart on Australia - Market size and forecast 2025-2030 ($ million)
Data Table on Australia - Market size and forecast 2025-2030 ($ million)
Chart on Australia - Year-over-year growth 2025-2030 (%)
Data Table on Australia - Year-over-year growth 2025-2030 (%)

12.5.6 Indonesia - Market size and forecast 2025-2030

Chart on Indonesia - Market size and forecast 2025-2030 ($ million)
Data Table on Indonesia - Market size and forecast 2025-2030 ($ million)
Chart on Indonesia - Year-over-year growth 2025-2030 (%)
Data Table on Indonesia - Year-over-year growth 2025-2030 (%)

12.6 South America - Market size and forecast 2025-2030

Chart on South America - Market size and forecast 2025-2030 ($ million)
Data Table on South America - Market size and forecast 2025-2030 ($ million)
Chart on South America - Year-over-year growth 2025-2030 (%)
Data Table on South America - Year-over-year growth 2025-2030 (%)
Chart on Regional Comparison - South America
Data Table on Regional Comparison - South America

12.6.1 Brazil - Market size and forecast 2025-2030

Chart on Brazil - Market size and forecast 2025-2030 ($ million)
Data Table on Brazil - Market size and forecast 2025-2030 ($ million)
Chart on Brazil - Year-over-year growth 2025-2030 (%)
Data Table on Brazil - Year-over-year growth 2025-2030 (%)

12.6.2 Argentina - Market size and forecast 2025-2030

Chart on Argentina - Market size and forecast 2025-2030 ($ million)
Data Table on Argentina - Market size and forecast 2025-2030 ($ million)
Chart on Argentina - Year-over-year growth 2025-2030 (%)
Data Table on Argentina - Year-over-year growth 2025-2030 (%)

12.6.3 Colombia - Market size and forecast 2025-2030

Chart on Colombia - Market size and forecast 2025-2030 ($ million)
Data Table on Colombia - Market size and forecast 2025-2030 ($ million)
Chart on Colombia - Year-over-year growth 2025-2030 (%)
Data Table on Colombia - Year-over-year growth 2025-2030 (%)

12.7 Middle East and Africa - Market size and forecast 2025-2030

Chart on Middle East and Africa - Market size and forecast 2025-2030 ($ million)
Data Table on Middle East and Africa - Market size and forecast 2025-2030 ($ million)
Chart on Middle East and Africa - Year-over-year growth 2025-2030 (%)
Data Table on Middle East and Africa - Year-over-year growth 2025-2030 (%)
Chart on Regional Comparison - Middle East and Africa
Data Table on Regional Comparison - Middle East and Africa

12.7.1 Saudi Arabia - Market size and forecast 2025-2030

Chart on Saudi Arabia - Market size and forecast 2025-2030 ($ million)
Data Table on Saudi Arabia - Market size and forecast 2025-2030 ($ million)
Chart on Saudi Arabia - Year-over-year growth 2025-2030 (%)
Data Table on Saudi Arabia - Year-over-year growth 2025-2030 (%)

12.7.2 UAE - Market size and forecast 2025-2030

Chart on UAE - Market size and forecast 2025-2030 ($ million)
Data Table on UAE - Market size and forecast 2025-2030 ($ million)
Chart on UAE - Year-over-year growth 2025-2030 (%)
Data Table on UAE - Year-over-year growth 2025-2030 (%)

12.7.3 Israel - Market size and forecast 2025-2030

Chart on Israel - Market size and forecast 2025-2030 ($ million)
Data Table on Israel - Market size and forecast 2025-2030 ($ million)
Chart on Israel - Year-over-year growth 2025-2030 (%)
Data Table on Israel - Year-over-year growth 2025-2030 (%)

12.7.4 South Africa - Market size and forecast 2025-2030

Chart on South Africa - Market size and forecast 2025-2030 ($ million)
Data Table on South Africa - Market size and forecast 2025-2030 ($ million)
Chart on South Africa - Year-over-year growth 2025-2030 (%)
Data Table on South Africa - Year-over-year growth 2025-2030 (%)

12.7.5 Turkey - Market size and forecast 2025-2030

Chart on Turkey - Market size and forecast 2025-2030 ($ million)
Data Table on Turkey - Market size and forecast 2025-2030 ($ million)
Chart on Turkey - Year-over-year growth 2025-2030 (%)
Data Table on Turkey - Year-over-year growth 2025-2030 (%)

12.8 Market opportunity by geography

Market opportunity by geography ($ million)
Data Tables on Market opportunity by geography ($ million)

13. Drivers, Challenges, and Opportunity

13.1 Market drivers

Rising health consciousness and demand for personalized healthcare
Technological advancements and proliferation of smart devices
Growing focus on underserved health stages and destigmatization

13.2 Market challenges

Navigating complexities of data privacy, security, and user trust
Overcoming market saturation, high churn, and monetization hurdles
Ensuring clinical accuracy and navigating complex regulatory landscape

13.3 Impact of drivers and challenges

Impact of drivers and challenges in 2025 and 2030

13.4 Market opportunities

Hyper personalization driven by artificial intelligence and machine learning
Expansion into holistic health and lifespan wide support
Convergence with formal healthcare ecosystem and rise of virtual therapeutics

14. Competitive Landscape

14.1 Overview

14.2

Overview on criticality of inputs and factors of differentiation

14.3 Landscape disruption

Overview on factors of disruption

14.4 Industry risks

Impact of key risks on business

15. Competitive Analysis

15.1 Companies profiled

Companies covered

15.2 Company ranking index

15.3 Market positioning of companies

Matrix on companies position and classification

15.4 BabyCenter LLC

BabyCenter LLC - Overview
BabyCenter LLC - Product / Service
BabyCenter LLC - Key offerings
SWOT

15.5 BioWink GmbH

BioWink GmbH - Overview
BioWink GmbH - Product / Service
BioWink GmbH - Key offerings
SWOT

15.6 Cycles

Cycles - Overview
Cycles - Product / Service
Cycles - Key offerings
SWOT

15.7 Flo Health UK Ltd.

Flo Health UK Ltd. - Overview
Flo Health UK Ltd. - Product / Service
Flo Health UK Ltd. - Key offerings
SWOT

15.8 Glow Inc.

Glow Inc. - Overview
Glow Inc. - Product / Service
Glow Inc. - Key offerings
SWOT

15.9 Kin Fertility

Kin Fertility - Overview
Kin Fertility - Product / Service
Kin Fertility - Key offerings
SWOT

15.10 Maven Clinic Co.

Maven Clinic Co. - Overview
Maven Clinic Co. - Product / Service
Maven Clinic Co. - Key offerings
SWOT

15.11 Natural Cycles Nordic

Natural Cycles Nordic - Overview
Natural Cycles Nordic - Product / Service
Natural Cycles Nordic - Key offerings
SWOT

15.12 Ovuline Inc.

Ovuline Inc. - Overview
Ovuline Inc. - Product / Service
Ovuline Inc. - Key offerings
SWOT

15.13 Peppy Health Ltd

Peppy Health Ltd - Overview
Peppy Health Ltd - Product / Service
Peppy Health Ltd - Key offerings
SWOT

15.14 Premom

Premom - Overview
Premom - Product / Service
Premom - Key offerings
SWOT

15.15 Rosy

Rosy - Overview
Rosy - Product / Service
Rosy - Key offerings
SWOT

15.16 the BUMP

the BUMP - Overview
the BUMP - Product / Service
the BUMP - Key offerings
SWOT

15.17 Tia Inc.

Tia Inc. - Overview
Tia Inc. - Product / Service
Tia Inc. - Key offerings
SWOT

15.18 Willow Innovations Inc.

Willow Innovations Inc. - Overview
Willow Innovations Inc. - Product / Service
Willow Innovations Inc. - Key offerings
SWOT

16. Appendix

16.1 Scope of the report

Market definition
Objectives
Notes and caveats

16.2 Inclusions and exclusions checklist

Inclusions checklist
Exclusions checklist

16.3 Currency conversion rates for US$

16.4 Research methodology

16.5 Data procurement

Information sources

16.6 Data validation

16.7 Validation techniques employed for market sizing

16.8 Data synthesis

16.9 360 degree market analysis

16.10 List of abbreviations

Research Methodology

Technavio presents a detailed picture of the market by way of study, synthesis, and summation of data from multiple sources. The analysts have presented the various facets of the market with a particular focus on identifying the key industry influencers. The data thus presented is comprehensive, reliable, and the result of extensive research, both primary and secondary.

INFORMATION SOURCES

Primary sources

  • Manufacturers and suppliers
  • Channel partners
  • Industry experts
  • Strategic decision makers

Secondary sources

  • Industry journals and periodicals
  • Government data
  • Financial reports of key industry players
  • Historical data
  • Press releases

DATA ANALYSIS

Data Synthesis

  • Collation of data
  • Estimation of key figures
  • Analysis of derived insights

Data Validation

  • Triangulation with data models
  • Reference against proprietary databases
  • Corroboration with industry experts

REPORT WRITING

Qualitative

  • Market drivers
  • Market challenges
  • Market trends
  • Five forces analysis

Quantitative

  • Market size and forecast
  • Market segmentation
  • Geographical insights
  • Competitive landscape

Interested in this report?

Get your sample now to see our research methodology and insights!

Download Now

Frequently Asked Questions

Women Health App market growth will increase by USD 5698.3 million during 2026-2030.

The Women Health App market is expected to grow at a CAGR of 24.9% during 2026-2030.

Women Health App market is segmented by Type (Menstrual health, Fitness and nutrition, Pregnancy tracking, Others) Modality (Smartphone, Tablet, Others) Age group (15 to 30 years, 31 to 40 years, 41 years and above)

BabyCenter LLC, BioWink GmbH, Cycles, Flo Health UK Ltd., Glow Inc., Kin Fertility, Maven Clinic Co., Natural Cycles Nordic, Ovuline Inc., Peppy Health Ltd, Premom, Rosy, Simple Design Ltd, the BUMP, Tia Inc., WILD AI, Willow Innovations Inc. are a few of the key vendors in the Women Health App market.

North America will register the highest growth rate of 42.1% among the other regions. Therefore, the Women Health App market in North America is expected to garner significant business opportunities for the vendors during the forecast period.

US, Canada, Mexico, Germany, UK, France, Italy, Spain, The Netherlands, China, Japan, India, South Korea, Australia, Indonesia, Brazil, Argentina, Colombia, Saudi Arabia, UAE, Israel, South Africa, Turkey

  • Rising health consciousness and demand for personalized healthcare is the driving factor this market.

The Women Health App market vendors should focus on grabbing business opportunities from the Type segment as it accounted for the largest market share in the base year.