Wearable Technology Market Analysis, Size, and Forecast 2026-2030: North America (US, Canada, and Mexico), APAC (China, India, and Japan), Europe (Germany, UK, and France), South America (Brazil, Argentina, and Colombia), Middle East and Africa (UAE, Saudi Arabia, and South Africa), and Rest of World (ROW)

Wearable Technology Market Analysis, Size, and Forecast 2026-2030:
North America (US, Canada, and Mexico), APAC (China, India, and Japan), Europe (Germany, UK, and France), South America (Brazil, Argentina, and Colombia), Middle East and Africa (UAE, Saudi Arabia, and South Africa), and Rest of World (ROW)

Published: Jan 2026 315 Pages SKU: IRTNTR40925

Market Overview at a Glance

$114.42 B
Market Opportunity
17.3%
CAGR 2025 - 2030
42.1%
North America Growth
$23.50 B
Wrist-wear segment 2024

Wearable Technology Market Size 2026-2030

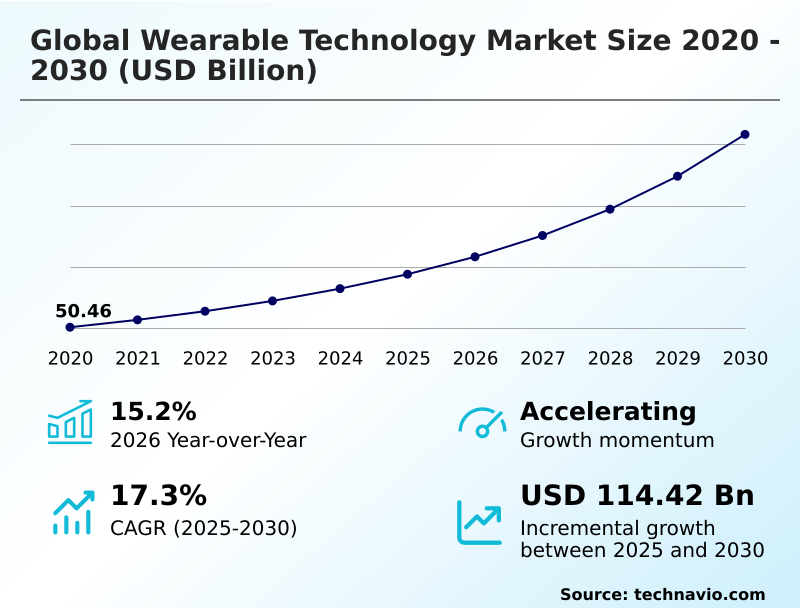
The wearable technology market size is valued to increase by USD 114.42 billion, at a CAGR of 17.3% from 2025 to 2030. Advancements in sensor and AI technology will drive the wearable technology market.

Major Market Trends & Insights

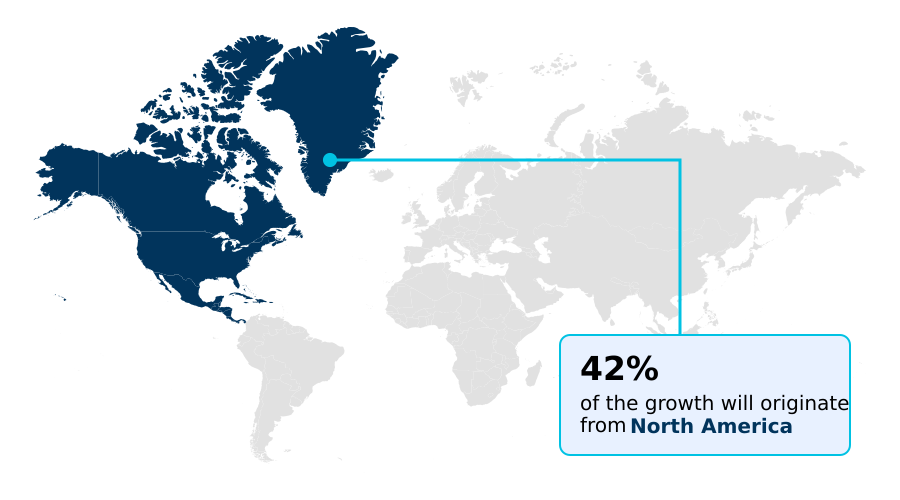
  • North America dominated the market and accounted for a 42.1% growth during the forecast period.
  • By Product - Wrist-wear segment was valued at USD 23.50 billion in 2024
  • By Application - Consumer electronics segment accounted for the largest market revenue share in 2024

Market Size & Forecast

  • Market Opportunities: USD 157.77 billion
  • Market Future Opportunities: USD 114.42 billion
  • CAGR from 2025 to 2030 : 17.3%

Market Summary

  • The wearable technology market is characterized by rapid technological evolution, shifting from basic fitness tracking to sophisticated, interconnected ecosystems that influence daily life, health, and productivity. Key market drivers include continuous advancements in miniaturized biometric data sensors, which enable precise and real-time monitoring of physiological data, and the growing consumer demand for proactive health management.
  • Trends such as the integration of AI for personalized insights and the emergence of alternative form factors like smart rings and hearables are expanding the market's applicability. Wearable technology is now pivotal in enterprise settings, where a logistics company, for example, can deploy smart glasses with augmented reality to streamline warehouse picking operations, improving accuracy and reducing fulfillment times.
  • However, the industry faces challenges related to data privacy and the need for longer battery life to support always-on functionalities. The market's trajectory is toward creating seamless, intuitive user experiences where technology becomes an invisible yet indispensable part of personal and professional routines.

What will be the Size of the Wearable Technology Market during the forecast period?

Get Key Insights on Market Forecast (PDF) Request Free Sample

How is the Wearable Technology Market Segmented?

The wearable technology industry research report provides comprehensive data (region-wise segment analysis), with forecasts and estimates in "USD million" for the period 2026-2030, as well as historical data from 2020-2024 for the following segments.
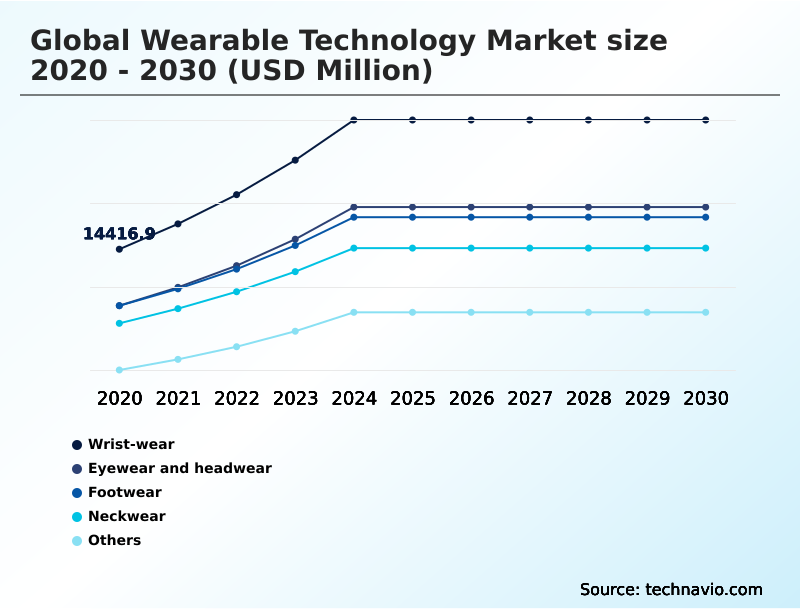
  • Product
    • Wrist-wear
    • Eyewear and headwear
    • Footwear
    • Neckwear
    • Others
  • Application
    • Consumer electronics
    • Healthcare
    • Enterprise and industrial
    • Entertainment
    • Others
  • Connectivity
    • Bluetooth
    • Wi-Fi
    • Cellular
  • Geography
    • North America
      • US
      • Canada
      • Mexico
    • APAC
      • China
      • India
      • Japan
    • Europe
      • Germany
      • UK
      • France
    • South America
      • Brazil
      • Argentina
      • Colombia
    • Middle East and Africa
      • UAE
      • Saudi Arabia
      • South Africa
    • Rest of World (ROW)

By Product Insights

The wrist-wear segment is estimated to witness significant growth during the forecast period.

The global wearable technology market is segmented by product form factors that are evolving beyond wrist-worn devices. While smartwatches remain dominant, the integration of biometric data sensors and flexible electronics is enabling the growth of smart textiles and other e-textiles.

Innovations in hearable computing, featuring devices with hearables with health sensors, are creating new categories focused on both audio and wellness. These devices leverage advanced activity recognition to provide contextual feedback and support functionalities like wearable payment solutions.

The development of personalized audio profiles has enhanced user experience in audio-centric wearables, improving adoption rates for these specialized products by over 15% in targeted user groups.

This diversification reflects a strategic shift toward embedding technology into everyday apparel and accessories, expanding the market's reach and application scope.

Request Free Sample

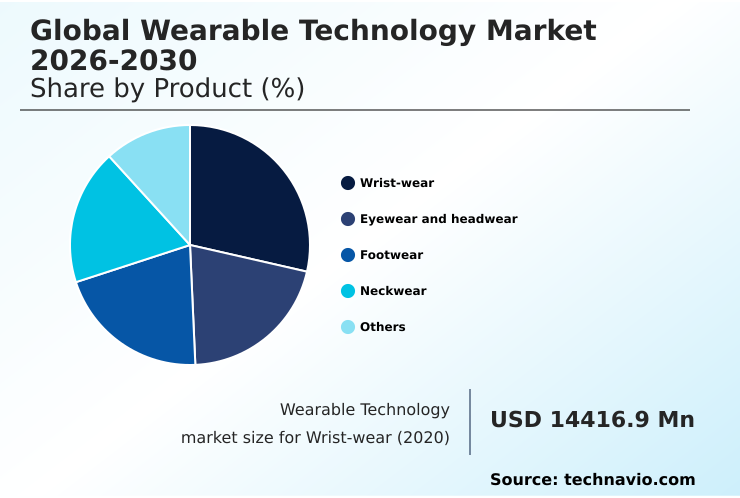
The Wrist-wear segment was valued at USD 23.50 billion in 2024 and showed a gradual increase during the forecast period.

Request Free Sample

Regional Analysis

North America is estimated to contribute 42.1% to the growth of the global market during the forecast period.Technavio’s analysts have elaborately explained the regional trends and drivers that shape the market during the forecast period.

See How Wearable Technology Market Demand is Rising in North America Request Free Sample

The global wearable technology market landscape is led by North America, which is projected to account for 42.1% of the market's incremental growth.

This is driven by high rates of enterprise wearable adoption, particularly for workforce safety wearables equipped with environmental sensors to monitor workplace hazards. In this region, exoskeleton technology is gaining traction in industrial settings to reduce worker strain.

APAC is the fastest-growing region, with a projected CAGR of 17.9%, fueled by demand for health-monitoring devices that utilize SpO2 monitoring and electrodermal activity sensors to track wellness.

The use of vitals monitoring patch systems and the analysis of digital biomarkers are becoming more common in healthcare applications. These psycho-dermal sensors help in assessing stress levels, reflecting a global trend toward holistic health tracking.

Market Dynamics

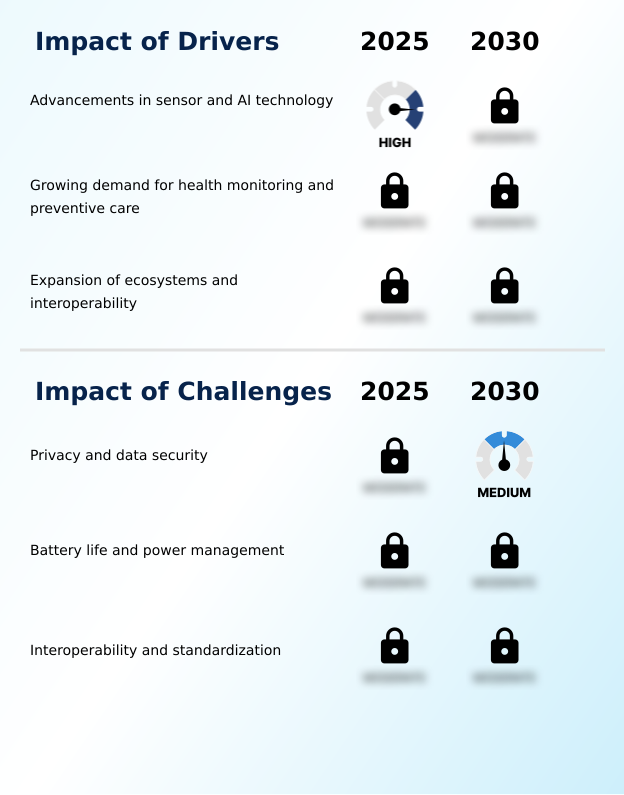
Our researchers analyzed the data with 2025 as the base year, along with the key drivers, trends, and challenges. A holistic analysis of drivers will help companies refine their marketing strategies to gain a competitive advantage.

  • The wearable technology market is diversifying to address specialized needs across consumer and enterprise sectors. A key application is wearable technology for chronic disease management, where devices enable continuous monitoring and timely interventions. In industrial environments, AR wearables for industrial maintenance are streamlining complex repair tasks and improving worker safety, demonstrating a clear enterprise ROI of wearable safety devices.
  • For consumers, the debate over comparing smart ring vs smartwatch accuracy highlights the demand for reliable data, while the rise of AI in wearables for mental health tracking addresses a growing focus on holistic well-being. The impact of 5G on wearable device performance is significant, enabling faster data transmission for complex applications.
  • However, this raises concerns about data privacy frameworks for health wearables, making ethical implications of neural interface wearables a critical discussion. The industry is also responding to environmental concerns with a focus on sustainable materials in wearable device design. In healthcare, wearable technology for elderly remote care is becoming essential, supported by advancements in wearable battery technology.
  • Gesture control applications for AR glasses are improving usability, while NFC applications in wearable payments add convenience. For medical applications, establishing clear interoperability standards for medical wearables and navigating regulatory pathways for AI-based wearables are crucial.
  • Innovations in wearable biosensors for real-time diagnostics and closed-loop systems in wearable health tech are paving the way for more autonomous health management, while user experience design for smart textiles and achieving clinical validation of consumer wearables remain key priorities for market acceptance, with validated devices showing adoption rates nearly double that of unverified counterparts.
  • Machine learning models for predictive alerts further enhance the proactive capabilities of these systems.

What are the key market drivers leading to the rise in the adoption of Wearable Technology Industry?

  • Advancements in sensor and artificial intelligence technology are a primary driver for the market, enabling more accurate data collection and enhanced user experiences.

  • The growing demand for proactive health management is a significant driver for the global wearable technology market, supported by increasingly sophisticated device capabilities.
  • The integration of the wearable ECG monitor and advanced sleep tracking algorithms allows for clinical-grade data collection outside of traditional healthcare settings. This facilitates new models of care, including remote patient monitoring devices and telemedicine integration.
  • Through sensor fusion, devices can deliver highly accurate preventive health alerts and predictive health analytics. These capabilities are critical for managing chronic conditions, with some platforms enabling continuous glucose monitoring and other forms of digital therapeutics.
  • The convergence of consumer technology and healthcare is creating a powerful ecosystem for personalized wellness, improving patient engagement by up to 25% in certain chronic care programs.

What are the market trends shaping the Wearable Technology Industry?

  • The emergence of augmented reality integrated wearables is a significant market trend, blending digital overlays with real-world environments to enhance user interactions.

  • Key trends in the global wearable technology market are redefining user interaction through immersive technologies. The development of augmented reality display systems is leading to more sophisticated AR smart glasses, which utilize spatial computing to blend digital information with the physical world. This is complemented by advancements in gesture recognition technology and neural input technology, allowing for touchless control.
  • The integration of neural interface capabilities promises even more intuitive device operation. Innovations such as bone conduction audio enhance situational awareness, while AI-powered coaching provides personalized, real-time feedback. The rise of smart ring technology offers a discreet alternative for continuous monitoring, with some devices seeing adoption rates increase by over 30% in wellness-focused demographics compared to traditional form factors.

What challenges does the Wearable Technology Industry face during its growth?

  • Safeguarding user privacy and ensuring robust data security represent a substantial challenge, as devices collect increasing amounts of sensitive personal information.

  • Technical and ecosystem-level challenges persist in the global wearable technology market, particularly concerning power management and interoperability. Extending battery life remains a primary focus, with research into energy harvesting techniques and low-power wide-area network connectivity aiming to reduce reliance on frequent charging. The development of biodegradable wearables introduces material science challenges but addresses sustainability demands.
  • Ensuring seamless integration across platforms is crucial for functionalities like fall detection systems and real-time location tracking. The market is also exploring advanced interfaces, including haptic feedback systems and the more experimental brain-computer interface.
  • This push towards ambient computing and contextual awareness, where devices operate seamlessly in the background, is hampered by fragmented standards, which can increase development costs by 15-20% for cross-platform applications.

Exclusive Technavio Analysis on Customer Landscape

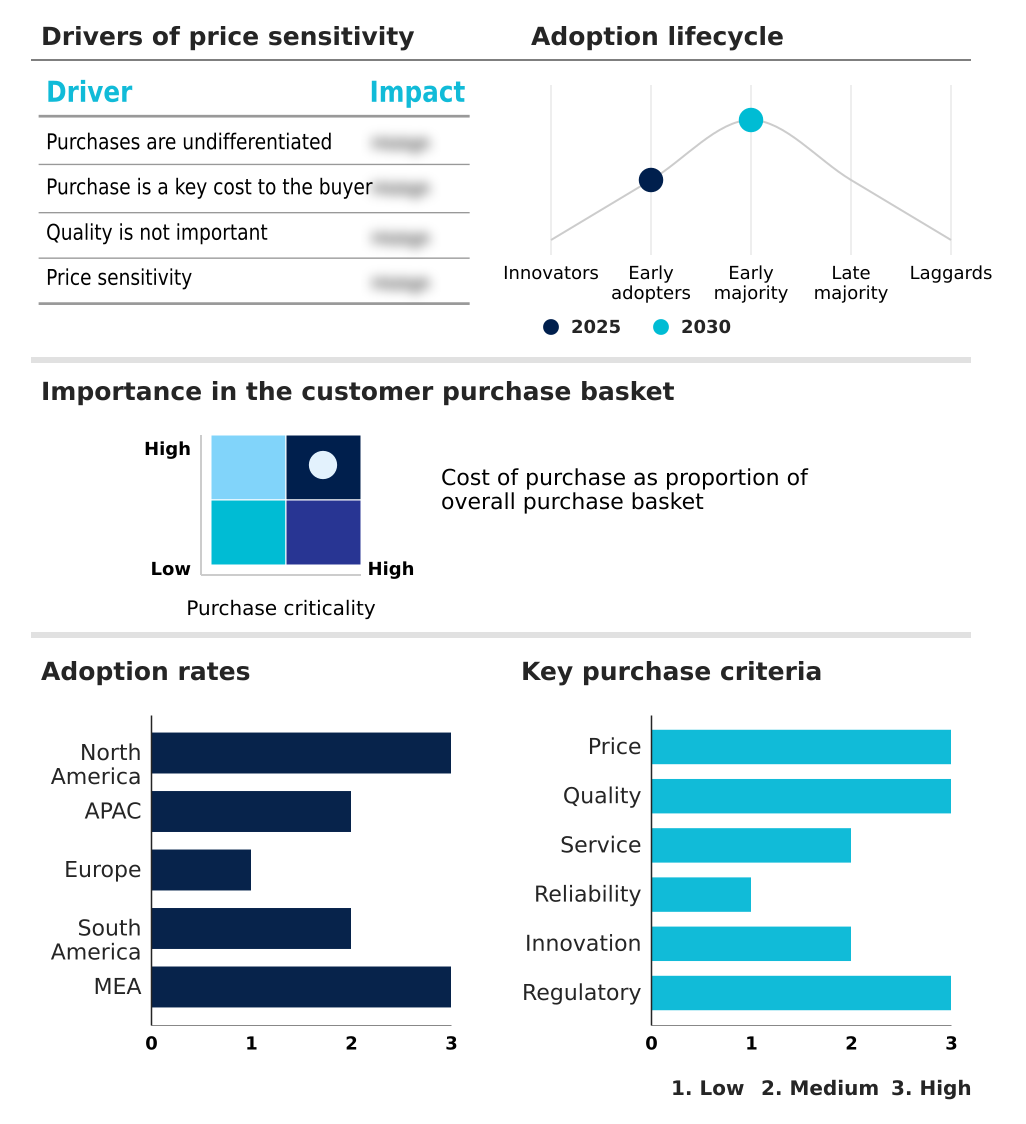
The wearable technology market forecasting report includes the adoption lifecycle of the market, covering from the innovator’s stage to the laggard’s stage. It focuses on adoption rates in different regions based on penetration. Furthermore, the wearable technology market report also includes key purchase criteria and drivers of price sensitivity to help companies evaluate and develop their market growth analysis strategies.

Customer Landscape of Wearable Technology Industry

Competitive Landscape

Companies are implementing various strategies, such as strategic alliances, wearable technology market forecast, partnerships, mergers and acquisitions, geographical expansion, and product/service launches, to enhance their presence in the industry.

Apple Inc. - Offers wearable technology centered on smartwatches and health devices for fitness monitoring, health analysis, and seamless connectivity within an integrated consumer electronics ecosystem.

The industry research and growth report includes detailed analyses of the competitive landscape of the market and information about key companies, including:

  • Apple Inc.
  • ASUSTeK Computer Inc.
  • Bose Corp.
  • Fossil Group Inc.
  • Garmin Ltd.
  • Google LLC
  • Guangdong OPPO Mobile Telecommunications Corp. Ltd.
  • Huawei Technologies Co. Ltd.
  • Lenovo Group Ltd.
  • LG Electronics Inc.
  • Microsoft Corp.
  • Motorola Mobility LLC
  • Oura Health Oy
  • Polar Electro Oy
  • Samsung Electronics Co. Ltd.
  • Sony Group Corp.
  • Xiaomi Corp.

Qualitative and quantitative analysis of companies has been conducted to help clients understand the wider business environment as well as the strengths and weaknesses of key industry players. Data is qualitatively analyzed to categorize companies as pure play, category-focused, industry-focused, and diversified; it is quantitatively analyzed to categorize companies as dominant, leading, strong, tentative, and weak.

Recent Development and News in Wearable technology market

  • In October, 2024, Oura Health Oy introduced the Ring 4, featuring Smart Sensing technology to provide more accurate biometric data for enhanced sleep and activity monitoring.
  • In February, 2025, Google LLC addressed a software glitch that led to unauthorized access to Fitbit user data by implementing stronger authentication protocols.
  • In May, 2025, WHOOP launched its 5.0 model, which includes a medical-grade electrocardiogram module and sensors capable of tracking metrics twenty-six times per second for daily blood pressure readings.
  • In August, 2025, Google LLC launched the Pixel Watch 4, which includes satellite connectivity for expanded remote functionality and upgraded sensors for improved fitness tracking and auto-detection of activities.

Dive into Technavio’s robust research methodology, blending expert interviews, extensive data synthesis, and validated models for unparalleled Wearable Technology Market insights. See full methodology.

Market Scope
Page number 315
Base year 2025
Historic period 2020-2024
Forecast period 2026-2030
Growth momentum & CAGR Accelerate at a CAGR of 17.3%
Market growth 2026-2030 USD 114420.8 million
Market structure Fragmented
YoY growth 2025-2026(%) 15.2%
Key countries US, Canada, Mexico, China, India, Japan, South Korea, Indonesia, Australia, Germany, UK, France, Italy, Spain, The Netherlands, Brazil, Argentina, Colombia, UAE, Saudi Arabia, South Africa, Egypt and Nigeria
Competitive landscape Leading Companies, Market Positioning of Companies, Competitive Strategies, and Industry Risks

Request Free Sample

Research Analyst Overview

  • The wearable technology market is undergoing a significant transformation, driven by the convergence of consumer electronics and healthcare. Continuous innovation in biometric data sensors and sensor fusion techniques allows for increasingly accurate health monitoring, moving devices from wellness trackers to tools for predictive health analytics.
  • The development of smart textiles and flexible electronics is expanding form factors beyond the wrist, with e-textiles integrating technology directly into clothing. Advances in hearable computing, such as hearables with health sensors, merge audio with health tracking. Key technologies like the wearable ECG monitor, SpO2 monitoring, and electrodermal activity sensors are becoming standard.
  • This evolution is enabling new applications in preventive health alerts and the tracking of digital biomarkers. Boardroom decisions are increasingly focused on navigating the complex regulatory landscape for these devices, with data showing that companies aligning with medical device standards achieve market entry 30% faster than those who do not.

What are the Key Data Covered in this Wearable Technology Market Research and Growth Report?

  • What is the expected growth of the Wearable Technology Market between 2026 and 2030?

    • USD 114.42 billion, at a CAGR of 17.3%

  • What segmentation does the market report cover?

    • The report is segmented by Product (Wrist-wear, Eyewear and headwear, Footwear, Neckwear, and Others), Application (Consumer electronics, Healthcare, Enterprise and industrial, Entertainment, and Others), Connectivity (Bluetooth, Wi-Fi, and Cellular) and Geography (North America, APAC, Europe, South America, Middle East and Africa)

  • Which regions are analyzed in the report?

    • North America, APAC, Europe, South America and Middle East and Africa

  • What are the key growth drivers and market challenges?

    • Advancements in sensor and AI technology, Privacy and data security

  • Who are the major players in the Wearable Technology Market?

    • Apple Inc., ASUSTeK Computer Inc., Bose Corp., Fossil Group Inc., Garmin Ltd., Google LLC, Guangdong OPPO Mobile Telecommunications Corp. Ltd., Huawei Technologies Co. Ltd., Lenovo Group Ltd., LG Electronics Inc., Microsoft Corp., Motorola Mobility LLC, Oura Health Oy, Polar Electro Oy, Samsung Electronics Co. Ltd., Sony Group Corp. and Xiaomi Corp.

Market Research Insights

  • The wearable technology market is defined by dynamic shifts in consumer demand and technological capabilities. The expansion of AI-powered coaching and telemedicine integration is transforming wearables from passive data collectors into active partners in health and wellness. This is supported by the growing adoption of specialized devices like those for continuous glucose monitoring and advanced AR smart glasses for enterprise use.
  • The proliferation of smart ring technology illustrates a move toward more discreet form factors. Regionally, the market shows varied momentum; for instance, the year-over-year growth stands at 15.2%, while the APAC region outpaces Europe with a CAGR of 17.9% compared to 16.8%, indicating strong demand in emerging economies.
  • The focus on creating cohesive user experiences is paramount, as interoperability can increase user retention by over 20% compared to siloed device ecosystems.

We can help! Our analysts can customize this wearable technology market research report to meet your requirements.

Get in touch

1. Executive Summary

1.1 Market overview

Executive Summary - Chart on Market Overview
Executive Summary - Data Table on Market Overview
Executive Summary - Chart on Global Market Characteristics
Executive Summary - Chart on Market by Geography
Executive Summary - Chart on Market Segmentation by Product
Executive Summary - Chart on Market Segmentation by Application
Executive Summary - Chart on Market Segmentation by Connectivity
Executive Summary - Chart on Incremental Growth
Executive Summary - Data Table on Incremental Growth
Executive Summary - Chart on Company Market Positioning

2. Technavio Analysis

2.1 Analysis of price sensitivity, lifecycle, customer purchase basket, adoption rates, and purchase criteria

2.2 Criticality of inputs and Factors of differentiation

Chart on Overview on criticality of inputs and factors of differentiation

2.3 Factors of disruption

Chart on Overview on factors of disruption

2.4 Impact of drivers and challenges

Chart on Impact of drivers and challenges in 2025 and 2030

3. Market Landscape

3.1 Market ecosystem

Chart on Parent Market
Data Table on - Parent Market

3.2 Market characteristics

Chart on Market characteristics analysis

3.3 Value chain analysis

Chart on Value chain analysis

4. Market Sizing

4.1 Market definition

Data Table on Offerings of companies included in the market definition

4.2 Market segment analysis

Market segments

4.3 Market size 2025

4.4 Market outlook: Forecast for 2025-2030

Chart on Global - Market size and forecast 2025-2030 ($ million)
Data Table on Global - Market size and forecast 2025-2030 ($ million)
Chart on Global Market: Year-over-year growth 2025-2030 (%)
Data Table on Global Market: Year-over-year growth 2025-2030 (%)

5. Historic Market Size

5.1 Global Wearable Technology Market 2020 - 2024

Historic Market Size - Data Table on Global Wearable Technology Market 2020 - 2024 ($ million)

5.2 Product segment analysis 2020 - 2024

Historic Market Size - Product Segment 2020 - 2024 ($ million)

5.3 Application segment analysis 2020 - 2024

Historic Market Size - Application Segment 2020 - 2024 ($ million)

5.4 Connectivity segment analysis 2020 - 2024

Historic Market Size - Connectivity Segment 2020 - 2024 ($ million)

5.5 Geography segment analysis 2020 - 2024

Historic Market Size - Geography Segment 2020 - 2024 ($ million)

5.6 Country segment analysis 2020 - 2024

Historic Market Size - Country Segment 2020 - 2024 ($ million)

6. Qualitative Analysis

6.1 Impact of AI in Global Wearable Technology Market

7. Five Forces Analysis

7.1 Five forces summary

Five forces analysis - Comparison between 2025 and 2030

7.2 Bargaining power of buyers

Bargaining power of buyers - Impact of key factors 2025 and 2030

7.3 Bargaining power of suppliers

Bargaining power of suppliers - Impact of key factors in 2025 and 2030

7.4 Threat of new entrants

Threat of new entrants - Impact of key factors in 2025 and 2030

7.5 Threat of substitutes

Threat of substitutes - Impact of key factors in 2025 and 2030

7.6 Threat of rivalry

Threat of rivalry - Impact of key factors in 2025 and 2030

7.7 Market condition

Chart on Market condition - Five forces 2025 and 2030

8. Market Segmentation by Product

8.1 Market segments

Chart on Product - Market share 2025-2030 (%)
Data Table on Product - Market share 2025-2030 (%)

8.2 Comparison by Product

Chart on Comparison by Product
Data Table on Comparison by Product

8.3 Wrist-wear - Market size and forecast 2025-2030

Chart on Wrist-wear - Market size and forecast 2025-2030 ($ million)
Data Table on Wrist-wear - Market size and forecast 2025-2030 ($ million)
Chart on Wrist-wear - Year-over-year growth 2025-2030 (%)
Data Table on Wrist-wear - Year-over-year growth 2025-2030 (%)

8.4 Eyewear and headwear - Market size and forecast 2025-2030

Chart on Eyewear and headwear - Market size and forecast 2025-2030 ($ million)
Data Table on Eyewear and headwear - Market size and forecast 2025-2030 ($ million)
Chart on Eyewear and headwear - Year-over-year growth 2025-2030 (%)
Data Table on Eyewear and headwear - Year-over-year growth 2025-2030 (%)

8.5 Footwear - Market size and forecast 2025-2030

Chart on Footwear - Market size and forecast 2025-2030 ($ million)
Data Table on Footwear - Market size and forecast 2025-2030 ($ million)
Chart on Footwear - Year-over-year growth 2025-2030 (%)
Data Table on Footwear - Year-over-year growth 2025-2030 (%)

8.6 Neckwear - Market size and forecast 2025-2030

Chart on Neckwear - Market size and forecast 2025-2030 ($ million)
Data Table on Neckwear - Market size and forecast 2025-2030 ($ million)
Chart on Neckwear - Year-over-year growth 2025-2030 (%)
Data Table on Neckwear - Year-over-year growth 2025-2030 (%)

8.7 Others - Market size and forecast 2025-2030

Chart on Others - Market size and forecast 2025-2030 ($ million)
Data Table on Others - Market size and forecast 2025-2030 ($ million)
Chart on Others - Year-over-year growth 2025-2030 (%)
Data Table on Others - Year-over-year growth 2025-2030 (%)

8.8 Market opportunity by Product

Market opportunity by Product ($ million)
Data Table on Market opportunity by Product ($ million)

9. Market Segmentation by Application

9.1 Market segments

Chart on Application - Market share 2025-2030 (%)
Data Table on Application - Market share 2025-2030 (%)

9.2 Comparison by Application

Chart on Comparison by Application
Data Table on Comparison by Application

9.3 Consumer electronics - Market size and forecast 2025-2030

Chart on Consumer electronics - Market size and forecast 2025-2030 ($ million)
Data Table on Consumer electronics - Market size and forecast 2025-2030 ($ million)
Chart on Consumer electronics - Year-over-year growth 2025-2030 (%)
Data Table on Consumer electronics - Year-over-year growth 2025-2030 (%)

9.4 Healthcare - Market size and forecast 2025-2030

Chart on Healthcare - Market size and forecast 2025-2030 ($ million)
Data Table on Healthcare - Market size and forecast 2025-2030 ($ million)
Chart on Healthcare - Year-over-year growth 2025-2030 (%)
Data Table on Healthcare - Year-over-year growth 2025-2030 (%)

9.5 Enterprise and industrial - Market size and forecast 2025-2030

Chart on Enterprise and industrial - Market size and forecast 2025-2030 ($ million)
Data Table on Enterprise and industrial - Market size and forecast 2025-2030 ($ million)
Chart on Enterprise and industrial - Year-over-year growth 2025-2030 (%)
Data Table on Enterprise and industrial - Year-over-year growth 2025-2030 (%)

9.6 Entertainment - Market size and forecast 2025-2030

Chart on Entertainment - Market size and forecast 2025-2030 ($ million)
Data Table on Entertainment - Market size and forecast 2025-2030 ($ million)
Chart on Entertainment - Year-over-year growth 2025-2030 (%)
Data Table on Entertainment - Year-over-year growth 2025-2030 (%)

9.7 Others - Market size and forecast 2025-2030

Chart on Others - Market size and forecast 2025-2030 ($ million)
Data Table on Others - Market size and forecast 2025-2030 ($ million)
Chart on Others - Year-over-year growth 2025-2030 (%)
Data Table on Others - Year-over-year growth 2025-2030 (%)

9.8 Market opportunity by Application

Market opportunity by Application ($ million)
Data Table on Market opportunity by Application ($ million)

10. Market Segmentation by Connectivity

10.1 Market segments

Chart on Connectivity - Market share 2025-2030 (%)
Data Table on Connectivity - Market share 2025-2030 (%)

10.2 Comparison by Connectivity

Chart on Comparison by Connectivity
Data Table on Comparison by Connectivity

10.3 Bluetooth - Market size and forecast 2025-2030

Chart on Bluetooth - Market size and forecast 2025-2030 ($ million)
Data Table on Bluetooth - Market size and forecast 2025-2030 ($ million)
Chart on Bluetooth - Year-over-year growth 2025-2030 (%)
Data Table on Bluetooth - Year-over-year growth 2025-2030 (%)

10.4 Wi-Fi - Market size and forecast 2025-2030

Chart on Wi-Fi - Market size and forecast 2025-2030 ($ million)
Data Table on Wi-Fi - Market size and forecast 2025-2030 ($ million)
Chart on Wi-Fi - Year-over-year growth 2025-2030 (%)
Data Table on Wi-Fi - Year-over-year growth 2025-2030 (%)

10.5 Cellular - Market size and forecast 2025-2030

Chart on Cellular - Market size and forecast 2025-2030 ($ million)
Data Table on Cellular - Market size and forecast 2025-2030 ($ million)
Chart on Cellular - Year-over-year growth 2025-2030 (%)
Data Table on Cellular - Year-over-year growth 2025-2030 (%)

10.6 Market opportunity by Connectivity

Market opportunity by Connectivity ($ million)
Data Table on Market opportunity by Connectivity ($ million)

11. Customer Landscape

11.1 Customer landscape overview

Analysis of price sensitivity, lifecycle, customer purchase basket, adoption rates, and purchase criteria

12. Geographic Landscape

12.1 Geographic segmentation

Chart on Market share by geography 2025-2030 (%)
Data Table on Market share by geography 2025-2030 (%)

12.2 Geographic comparison

Chart on Geographic comparison
Data Table on Geographic comparison

12.3 North America - Market size and forecast 2025-2030

Chart on North America - Market size and forecast 2025-2030 ($ million)
Data Table on North America - Market size and forecast 2025-2030 ($ million)
Chart on North America - Year-over-year growth 2025-2030 (%)
Data Table on North America - Year-over-year growth 2025-2030 (%)
Chart on Regional Comparison - North America
Data Table on Regional Comparison - North America

12.3.1 US - Market size and forecast 2025-2030

Chart on US - Market size and forecast 2025-2030 ($ million)
Data Table on US - Market size and forecast 2025-2030 ($ million)
Chart on US - Year-over-year growth 2025-2030 (%)
Data Table on US - Year-over-year growth 2025-2030 (%)

12.3.2 Canada - Market size and forecast 2025-2030

Chart on Canada - Market size and forecast 2025-2030 ($ million)
Data Table on Canada - Market size and forecast 2025-2030 ($ million)
Chart on Canada - Year-over-year growth 2025-2030 (%)
Data Table on Canada - Year-over-year growth 2025-2030 (%)

12.3.3 Mexico - Market size and forecast 2025-2030

Chart on Mexico - Market size and forecast 2025-2030 ($ million)
Data Table on Mexico - Market size and forecast 2025-2030 ($ million)
Chart on Mexico - Year-over-year growth 2025-2030 (%)
Data Table on Mexico - Year-over-year growth 2025-2030 (%)

12.4 APAC - Market size and forecast 2025-2030

Chart on APAC - Market size and forecast 2025-2030 ($ million)
Data Table on APAC - Market size and forecast 2025-2030 ($ million)
Chart on APAC - Year-over-year growth 2025-2030 (%)
Data Table on APAC - Year-over-year growth 2025-2030 (%)
Chart on Regional Comparison - APAC
Data Table on Regional Comparison - APAC

12.4.1 China - Market size and forecast 2025-2030

Chart on China - Market size and forecast 2025-2030 ($ million)
Data Table on China - Market size and forecast 2025-2030 ($ million)
Chart on China - Year-over-year growth 2025-2030 (%)
Data Table on China - Year-over-year growth 2025-2030 (%)

12.4.2 India - Market size and forecast 2025-2030

Chart on India - Market size and forecast 2025-2030 ($ million)
Data Table on India - Market size and forecast 2025-2030 ($ million)
Chart on India - Year-over-year growth 2025-2030 (%)
Data Table on India - Year-over-year growth 2025-2030 (%)

12.4.3 Japan - Market size and forecast 2025-2030

Chart on Japan - Market size and forecast 2025-2030 ($ million)
Data Table on Japan - Market size and forecast 2025-2030 ($ million)
Chart on Japan - Year-over-year growth 2025-2030 (%)
Data Table on Japan - Year-over-year growth 2025-2030 (%)

12.4.4 South Korea - Market size and forecast 2025-2030

Chart on South Korea - Market size and forecast 2025-2030 ($ million)
Data Table on South Korea - Market size and forecast 2025-2030 ($ million)
Chart on South Korea - Year-over-year growth 2025-2030 (%)
Data Table on South Korea - Year-over-year growth 2025-2030 (%)

12.4.5 Indonesia - Market size and forecast 2025-2030

Chart on Indonesia - Market size and forecast 2025-2030 ($ million)
Data Table on Indonesia - Market size and forecast 2025-2030 ($ million)
Chart on Indonesia - Year-over-year growth 2025-2030 (%)
Data Table on Indonesia - Year-over-year growth 2025-2030 (%)

12.4.6 Australia - Market size and forecast 2025-2030

Chart on Australia - Market size and forecast 2025-2030 ($ million)
Data Table on Australia - Market size and forecast 2025-2030 ($ million)
Chart on Australia - Year-over-year growth 2025-2030 (%)
Data Table on Australia - Year-over-year growth 2025-2030 (%)

12.5 Europe - Market size and forecast 2025-2030

Chart on Europe - Market size and forecast 2025-2030 ($ million)
Data Table on Europe - Market size and forecast 2025-2030 ($ million)
Chart on Europe - Year-over-year growth 2025-2030 (%)
Data Table on Europe - Year-over-year growth 2025-2030 (%)
Chart on Regional Comparison - Europe
Data Table on Regional Comparison - Europe

12.5.1 Germany - Market size and forecast 2025-2030

Chart on Germany - Market size and forecast 2025-2030 ($ million)
Data Table on Germany - Market size and forecast 2025-2030 ($ million)
Chart on Germany - Year-over-year growth 2025-2030 (%)
Data Table on Germany - Year-over-year growth 2025-2030 (%)

12.5.2 UK - Market size and forecast 2025-2030

Chart on UK - Market size and forecast 2025-2030 ($ million)
Data Table on UK - Market size and forecast 2025-2030 ($ million)
Chart on UK - Year-over-year growth 2025-2030 (%)
Data Table on UK - Year-over-year growth 2025-2030 (%)

12.5.3 France - Market size and forecast 2025-2030

Chart on France - Market size and forecast 2025-2030 ($ million)
Data Table on France - Market size and forecast 2025-2030 ($ million)
Chart on France - Year-over-year growth 2025-2030 (%)
Data Table on France - Year-over-year growth 2025-2030 (%)

12.5.4 Italy - Market size and forecast 2025-2030

Chart on Italy - Market size and forecast 2025-2030 ($ million)
Data Table on Italy - Market size and forecast 2025-2030 ($ million)
Chart on Italy - Year-over-year growth 2025-2030 (%)
Data Table on Italy - Year-over-year growth 2025-2030 (%)

12.5.5 Spain - Market size and forecast 2025-2030

Chart on Spain - Market size and forecast 2025-2030 ($ million)
Data Table on Spain - Market size and forecast 2025-2030 ($ million)
Chart on Spain - Year-over-year growth 2025-2030 (%)
Data Table on Spain - Year-over-year growth 2025-2030 (%)

12.5.6 The Netherlands - Market size and forecast 2025-2030

Chart on The Netherlands - Market size and forecast 2025-2030 ($ million)
Data Table on The Netherlands - Market size and forecast 2025-2030 ($ million)
Chart on The Netherlands - Year-over-year growth 2025-2030 (%)
Data Table on The Netherlands - Year-over-year growth 2025-2030 (%)

12.6 South America - Market size and forecast 2025-2030

Chart on South America - Market size and forecast 2025-2030 ($ million)
Data Table on South America - Market size and forecast 2025-2030 ($ million)
Chart on South America - Year-over-year growth 2025-2030 (%)
Data Table on South America - Year-over-year growth 2025-2030 (%)
Chart on Regional Comparison - South America
Data Table on Regional Comparison - South America

12.6.1 Brazil - Market size and forecast 2025-2030

Chart on Brazil - Market size and forecast 2025-2030 ($ million)
Data Table on Brazil - Market size and forecast 2025-2030 ($ million)
Chart on Brazil - Year-over-year growth 2025-2030 (%)
Data Table on Brazil - Year-over-year growth 2025-2030 (%)

12.6.2 Argentina - Market size and forecast 2025-2030

Chart on Argentina - Market size and forecast 2025-2030 ($ million)
Data Table on Argentina - Market size and forecast 2025-2030 ($ million)
Chart on Argentina - Year-over-year growth 2025-2030 (%)
Data Table on Argentina - Year-over-year growth 2025-2030 (%)

12.6.3 Colombia - Market size and forecast 2025-2030

Chart on Colombia - Market size and forecast 2025-2030 ($ million)
Data Table on Colombia - Market size and forecast 2025-2030 ($ million)
Chart on Colombia - Year-over-year growth 2025-2030 (%)
Data Table on Colombia - Year-over-year growth 2025-2030 (%)

12.7 Middle East and Africa - Market size and forecast 2025-2030

Chart on Middle East and Africa - Market size and forecast 2025-2030 ($ million)
Data Table on Middle East and Africa - Market size and forecast 2025-2030 ($ million)
Chart on Middle East and Africa - Year-over-year growth 2025-2030 (%)
Data Table on Middle East and Africa - Year-over-year growth 2025-2030 (%)
Chart on Regional Comparison - Middle East and Africa
Data Table on Regional Comparison - Middle East and Africa

12.7.1 UAE - Market size and forecast 2025-2030

Chart on UAE - Market size and forecast 2025-2030 ($ million)
Data Table on UAE - Market size and forecast 2025-2030 ($ million)
Chart on UAE - Year-over-year growth 2025-2030 (%)
Data Table on UAE - Year-over-year growth 2025-2030 (%)

12.7.2 Saudi Arabia - Market size and forecast 2025-2030

Chart on Saudi Arabia - Market size and forecast 2025-2030 ($ million)
Data Table on Saudi Arabia - Market size and forecast 2025-2030 ($ million)
Chart on Saudi Arabia - Year-over-year growth 2025-2030 (%)
Data Table on Saudi Arabia - Year-over-year growth 2025-2030 (%)

12.7.3 South Africa - Market size and forecast 2025-2030

Chart on South Africa - Market size and forecast 2025-2030 ($ million)
Data Table on South Africa - Market size and forecast 2025-2030 ($ million)
Chart on South Africa - Year-over-year growth 2025-2030 (%)
Data Table on South Africa - Year-over-year growth 2025-2030 (%)

12.7.4 Egypt - Market size and forecast 2025-2030

Chart on Egypt - Market size and forecast 2025-2030 ($ million)
Data Table on Egypt - Market size and forecast 2025-2030 ($ million)
Chart on Egypt - Year-over-year growth 2025-2030 (%)
Data Table on Egypt - Year-over-year growth 2025-2030 (%)

12.7.5 Nigeria - Market size and forecast 2025-2030

Chart on Nigeria - Market size and forecast 2025-2030 ($ million)
Data Table on Nigeria - Market size and forecast 2025-2030 ($ million)
Chart on Nigeria - Year-over-year growth 2025-2030 (%)
Data Table on Nigeria - Year-over-year growth 2025-2030 (%)

12.8 Market opportunity by geography

Market opportunity by geography ($ million)
Data Tables on Market opportunity by geography ($ million)

13. Drivers, Challenges, and Opportunity

13.1 Market drivers

Advancements in sensor and AI technology
Growing demand for health monitoring and preventive care
Expansion of ecosystems and interoperability

13.2 Market challenges

Privacy and data security
Battery life and power management
Interoperability and standardization

13.3 Impact of drivers and challenges

Impact of drivers and challenges in 2025 and 2030

13.4 Market opportunities

Emergence of AR integrated wearables
Proliferation of smart rings and alternative form factors
Focus on sustainability and eco-friendly designs in wearables

14. Competitive Landscape

14.1 Overview

14.2

Overview on criticality of inputs and factors of differentiation

14.3 Landscape disruption

Overview on factors of disruption

14.4 Industry risks

Impact of key risks on business

15. Competitive Analysis

15.1 Companies profiled

Companies covered

15.2 Company ranking index

15.3 Market positioning of companies

Matrix on companies position and classification

15.4 Apple Inc.

Apple Inc. - Overview
Apple Inc. - Business segments
Apple Inc. - Key news
Apple Inc. - Key offerings
Apple Inc. - Segment focus
SWOT

15.5 ASUSTeK Computer Inc.

ASUSTeK Computer Inc. - Overview
ASUSTeK Computer Inc. - Product / Service
ASUSTeK Computer Inc. - Key news
ASUSTeK Computer Inc. - Key offerings
SWOT

15.6 Bose Corp.

Bose Corp. - Overview
Bose Corp. - Product / Service
Bose Corp. - Key news
Bose Corp. - Key offerings
SWOT

15.7 Fossil Group Inc.

Fossil Group Inc. - Overview
Fossil Group Inc. - Business segments
Fossil Group Inc. - Key news
Fossil Group Inc. - Key offerings
Fossil Group Inc. - Segment focus
SWOT

15.8 Garmin Ltd.

Garmin Ltd. - Overview
Garmin Ltd. - Business segments
Garmin Ltd. - Key news
Garmin Ltd. - Key offerings
Garmin Ltd. - Segment focus
SWOT

15.9 Google LLC

Google LLC - Overview
Google LLC - Product / Service
Google LLC - Key offerings
SWOT

15.10 Guangdong OPPO Mobile Telecommunications Corp. Ltd.

Guangdong OPPO Mobile Telecommunications Corp. Ltd. - Overview
Guangdong OPPO Mobile Telecommunications Corp. Ltd. - Product / Service
Guangdong OPPO Mobile Telecommunications Corp. Ltd. - Key offerings
SWOT

15.11 Huawei Technologies Co. Ltd.

Huawei Technologies Co. Ltd. - Overview
Huawei Technologies Co. Ltd. - Product / Service
Huawei Technologies Co. Ltd. - Key news
Huawei Technologies Co. Ltd. - Key offerings
SWOT

15.12 Lenovo Group Ltd.

Lenovo Group Ltd. - Overview
Lenovo Group Ltd. - Business segments
Lenovo Group Ltd. - Key news
Lenovo Group Ltd. - Key offerings
Lenovo Group Ltd. - Segment focus
SWOT

15.13 LG Electronics Inc.

LG Electronics Inc. - Overview
LG Electronics Inc. - Product / Service
LG Electronics Inc. - Key offerings
SWOT

15.14 Microsoft Corp.

Microsoft Corp. - Overview
Microsoft Corp. - Business segments
Microsoft Corp. - Key news
Microsoft Corp. - Key offerings
Microsoft Corp. - Segment focus
SWOT

15.15 Motorola Mobility LLC

Motorola Mobility LLC - Overview
Motorola Mobility LLC - Product / Service
Motorola Mobility LLC - Key offerings
SWOT

15.16 Samsung Electronics Co. Ltd.

Samsung Electronics Co. Ltd. - Overview
Samsung Electronics Co. Ltd. - Business segments
Samsung Electronics Co. Ltd. - Key news
Samsung Electronics Co. Ltd. - Key offerings
Samsung Electronics Co. Ltd. - Segment focus
SWOT

15.17 Sony Group Corp.

Sony Group Corp. - Overview
Sony Group Corp. - Business segments
Sony Group Corp. - Key offerings
Sony Group Corp. - Segment focus
SWOT

15.18 Xiaomi Corp.

Xiaomi Corp. - Overview
Xiaomi Corp. - Business segments
Xiaomi Corp. - Key news
Xiaomi Corp. - Key offerings
Xiaomi Corp. - Segment focus
SWOT

16. Appendix

16.1 Scope of the report

Market definition
Objectives
Notes and caveats

16.2 Inclusions and exclusions checklist

Inclusions checklist
Exclusions checklist

16.3 Currency conversion rates for US$

16.4 Research methodology

16.5 Data procurement

Information sources

16.6 Data validation

16.7 Validation techniques employed for market sizing

16.8 Data synthesis

16.9 360 degree market analysis

16.10 List of abbreviations

Research Methodology

Technavio presents a detailed picture of the market by way of study, synthesis, and summation of data from multiple sources. The analysts have presented the various facets of the market with a particular focus on identifying the key industry influencers. The data thus presented is comprehensive, reliable, and the result of extensive research, both primary and secondary.

INFORMATION SOURCES

Primary sources

  • Manufacturers and suppliers
  • Channel partners
  • Industry experts
  • Strategic decision makers

Secondary sources

  • Industry journals and periodicals
  • Government data
  • Financial reports of key industry players
  • Historical data
  • Press releases

DATA ANALYSIS

Data Synthesis

  • Collation of data
  • Estimation of key figures
  • Analysis of derived insights

Data Validation

  • Triangulation with data models
  • Reference against proprietary databases
  • Corroboration with industry experts

REPORT WRITING

Qualitative

  • Market drivers
  • Market challenges
  • Market trends
  • Five forces analysis

Quantitative

  • Market size and forecast
  • Market segmentation
  • Geographical insights
  • Competitive landscape

Interested in this report?

Get your sample now to see our research methodology and insights!

Download Now

Frequently Asked Questions

Wearable Technology market growth will increase by USD 114420.8 million during 2026-2030.

The Wearable Technology market is expected to grow at a CAGR of 17.3% during 2026-2030.

Wearable Technology market is segmented by Product (Wrist-wear, Eyewear and headwear, Footwear, Neckwear, Others) Application (Consumer electronics, Healthcare, Enterprise and industrial, Entertainment, Others) Connectivity (Bluetooth, Wi-Fi, Cellular)

Apple Inc., ASUSTeK Computer Inc., Bose Corp., Fossil Group Inc., Garmin Ltd., Google LLC, Guangdong OPPO Mobile Telecommunications Corp. Ltd., Huawei Technologies Co. Ltd., Lenovo Group Ltd., LG Electronics Inc., Microsoft Corp., Motorola Mobility LLC, Oura Health Oy, Polar Electro Oy, Samsung Electronics Co. Ltd., Sony Group Corp., Xiaomi Corp. are a few of the key vendors in the Wearable Technology market.

North America will register the highest growth rate of 42.1% among the other regions. Therefore, the Wearable Technology market in North America is expected to garner significant business opportunities for the vendors during the forecast period.

US, Canada, Mexico, China, India, Japan, South Korea, Indonesia, Australia, Germany, UK, France, Italy, Spain, The Netherlands, Brazil, Argentina, Colombia, UAE, Saudi Arabia, South Africa, Egypt, Nigeria

  • Advancements in sensor and AI technology is the driving factor this market.

The Wearable Technology market vendors should focus on grabbing business opportunities from the Product segment as it accounted for the largest market share in the base year.