Vitamin D3 Market Analysis, Size, and Forecast 2026-2030: North America (US, Canada, and Mexico), Europe (Germany, France, and UK), APAC (China, India, and Japan), South America (Brazil, Argentina, and Colombia), Middle East and Africa (Saudi Arabia, UAE, and South Africa), Asia, Rest of World (ROW)

Vitamin D3 Market Analysis, Size, and Forecast 2026-2030:
North America (US, Canada, and Mexico), Europe (Germany, France, and UK), APAC (China, India, and Japan), South America (Brazil, Argentina, and Colombia), Middle East and Africa (Saudi Arabia, UAE, and South Africa), Asia, Rest of World (ROW)

Published: Apr 2026 286 Pages SKU: IRTNTR71414

Market Overview at a Glance

$914.9 Mn
Market Opportunity
7.1%
CAGR 2025 - 2030
40.1%
North America Growth
$973.9 Mn
Functional nutritions segment 2024

Vitamin D3 Market Size 2026-2030

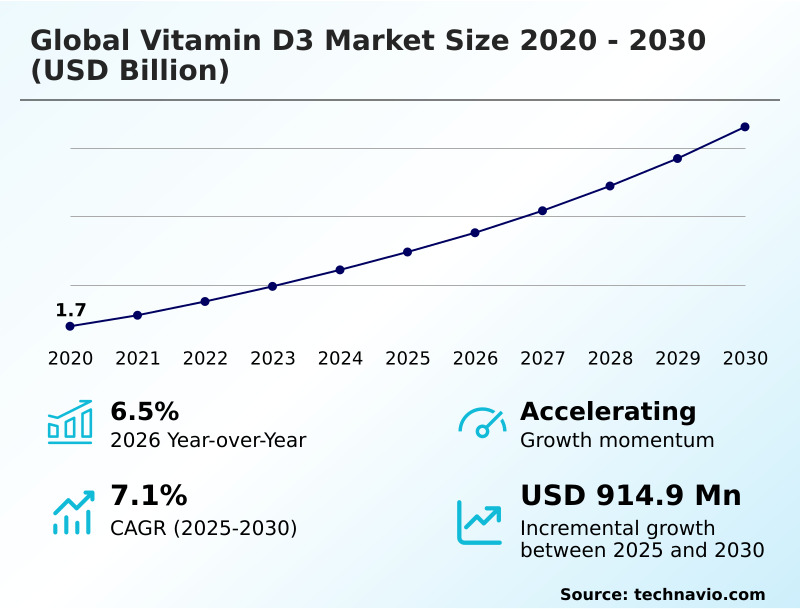
The vitamin d3 market size is valued to increase by USD 914.9 million, at a CAGR of 7.1% from 2025 to 2030. Rising demand for plant-based and sustainable nutritional solutions will drive the vitamin d3 market.

Major Market Trends & Insights

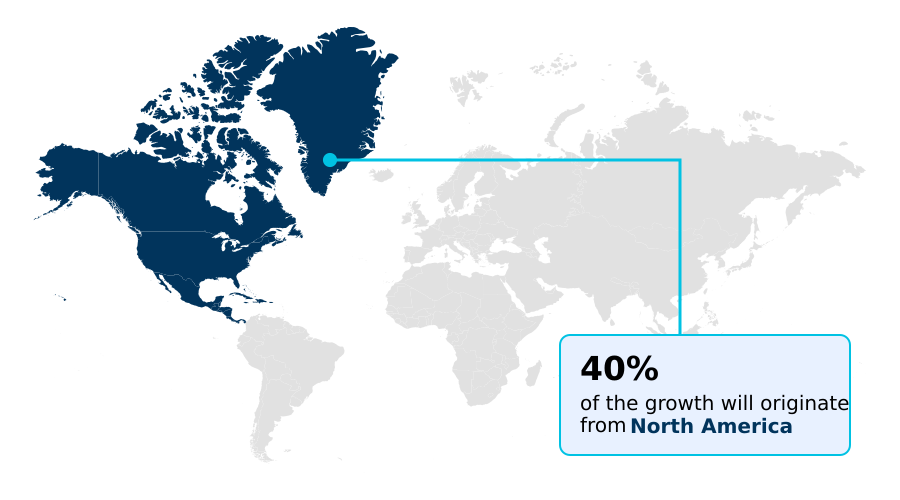
  • North America dominated the market and accounted for a 40.1% growth during the forecast period.
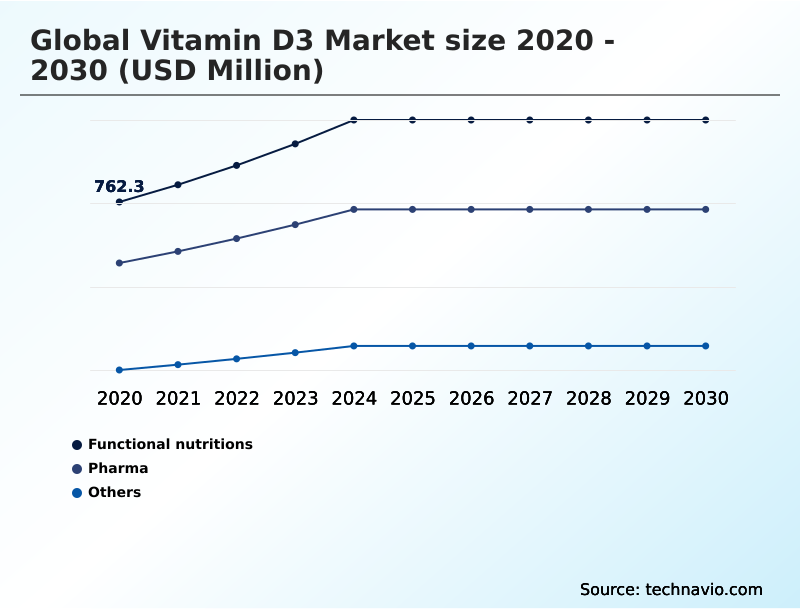
  • By Application - Functional nutritions segment was valued at USD 973.9 million in 2024
  • By Formulation - Powder segment accounted for the largest market revenue share in 2024

Market Size & Forecast

  • Market Opportunities: USD 1.46 billion
  • Market Future Opportunities: USD 914.9 million
  • CAGR from 2025 to 2030 : 7.1%

Market Summary

  • The Vitamin D3 Market is experiencing significant evolution, driven by heightened consumer awareness of its role in immune function and bone health, alongside a robust demand from the animal nutrition sector.
  • A prominent trend reshaping the industry is the shift away from traditional lanolin-derived cholecalciferol toward plant-based alternatives, such as those derived from algae or lichen, to meet the needs of the growing vegan population. This has created a competitive dynamic where innovation in cholecalciferol synthesis and sourcing is paramount.
  • For instance, a dietary supplement company looking to capture this market segment must re-evaluate its entire supply chain, from sourcing raw materials to ensuring its vitamin d3 delivery systems are compliant with vegan standards. This involves significant investment in R&D for stable, high-potency formulations that match the bioavailability of traditional sources.
  • Concurrently, the industry grapples with challenges like navigating disparate international regulations on dosage limits and health claims, which complicates global product launches and marketing strategies. The development of advanced metabolites like calcifediol further diversifies the market, offering enhanced efficacy for specific clinical and agricultural applications, thereby pushing the boundaries of nutritional science and product development.

What will be the Size of the Vitamin D3 Market during the forecast period?

Get Key Insights on Market Forecast (PDF) Request Free Sample

How is the Vitamin D3 Market Segmented?

The vitamin d3 industry research report provides comprehensive data (region-wise segment analysis), with forecasts and estimates in "USD million" for the period 2026-2030, as well as historical data from 2020-2024 for the following segments.

  • Application
    • Functional nutritions
    • Pharma
    • Others
  • Formulation
    • Powder
    • Crystal
    • Oil
    • Others
  • Grade type
    • Food
    • Feed
  • Geography
    • North America
      • US
      • Canada
      • Mexico
    • Europe
      • Germany
      • France
      • UK
    • Asia
    • Rest of World (ROW)

By Application Insights

The functional nutritions segment is estimated to witness significant growth during the forecast period.

The functional nutrition segment is expanding, driven by a paradigm shift toward preventative health and wellness. This sector is moving beyond traditional vitamin d3 supplementation to include a wide array of vitamin d3 in functional foods and beverages.

A key factor is the growing consumer preference for ethically sourced ingredients, which has increased demand for vegan vitamin d3 from non-animal vitamin d3 sources.

Manufacturers are innovating with vitamin d3 premixes and stabilized vitamin d3 formulations to meet evolving consumer needs.

This innovation in plant-derived cholecalciferol solutions allows companies to cater to a demographic that scrutinizes product origins, with market expansion in this area outpacing other segments by nearly 7%.

This push for lanolin-free vitamin d3 highlights a broader industry alignment with sustainability and clean-label ideologies.

Request Free Sample

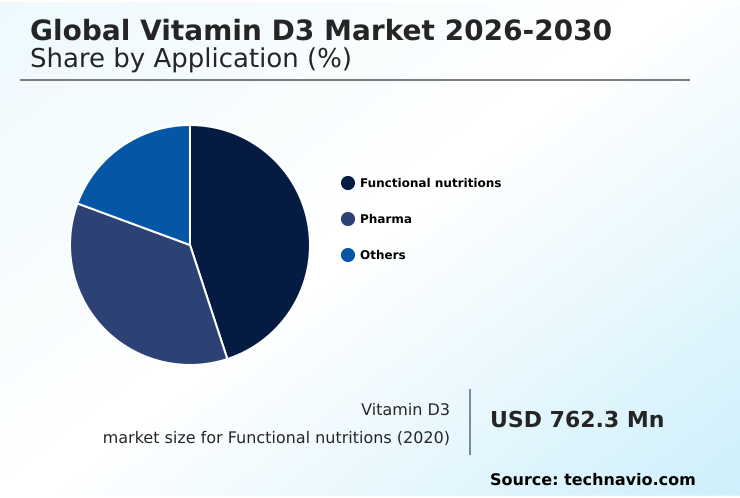
The Functional nutritions segment was valued at USD 973.9 million in 2024 and showed a gradual increase during the forecast period.

Request Free Sample

Regional Analysis

North America is estimated to contribute 40.1% to the growth of the global market during the forecast period.Technavio’s analysts have elaborately explained the regional trends and drivers that shape the market during the forecast period.

See How Vitamin D3 Market Demand is Rising in North America Request Free Sample

The geographic landscape of the market is diversifying, with different regions exhibiting unique growth drivers and market characteristics.

While North America remains a mature market focused on high-potency vitamin d3 and vitamin d3 for immune support, Asia is emerging as the fastest-growing region, with growth outpacing Europe by 1.5 percentage points.

This expansion is fueled by rising disposable incomes and government-led vitamin d3 fortification programs. In these developing markets, the adoption of vitamin d3 in animal nutrition is critical.

Innovations in microencapsulation have enabled feed manufacturers to improve vitamin d3 stability in processing, reducing overage requirements by up to 15%.

This technical advancement in creating stabilized vitamin d3 formulations supports the large-scale poultry and livestock industries, which are essential for regional food security.

The focus on vitamin d3 quality standards and clinical applications of vitamin d3 is becoming globally harmonized, supporting trade and market expansion.

Market Dynamics

Our researchers analyzed the data with 2025 as the base year, along with the key drivers, trends, and challenges. A holistic analysis of drivers will help companies refine their marketing strategies to gain a competitive advantage.

  • The global vitamin D3 market is undergoing a strategic transformation driven by a convergence of consumer, regulatory, and technological factors. A primary catalyst is the rising consumer demand for vegan vitamin d3, which has accelerated research into sourcing sustainable vitamin d3 alternatives to move away from the challenges in lanolin-based vitamin d3 supply.
  • Companies are now heavily investing in plant-based vitamin d3 for supplements, using sources like algae and lichen. This shift is not just about ethics; it's a strategic move to de-risk supply chains. For instance, businesses that have transitioned to plant-based sources have improved their raw material forecast accuracy by over 10% compared to those reliant on the volatile wool-grease market.
  • Simultaneously, there is a strong push towards value-added formulations. The development of high-potency vitamin d3 for pharmaceuticals and the clinical use of hydroxylated vitamin d3 are expanding the therapeutic applications.
  • In animal feed, understanding the benefits of calcifediol in aquaculture and using specific vitamin d3 formulations for animal feed, such as those addressing vitamin d3 for poultry skeletal health, are becoming industry standards. Furthermore, the role of vitamin d3 in immune health remains a key driver for its inclusion in functional nutrition products.
  • Addressing consumer misinformation on vitamin d3 dosage through clear labeling is another critical area of focus. These multifaceted key drivers for vitamin d3 market underscore a dynamic industry focused on innovation and sustainability.

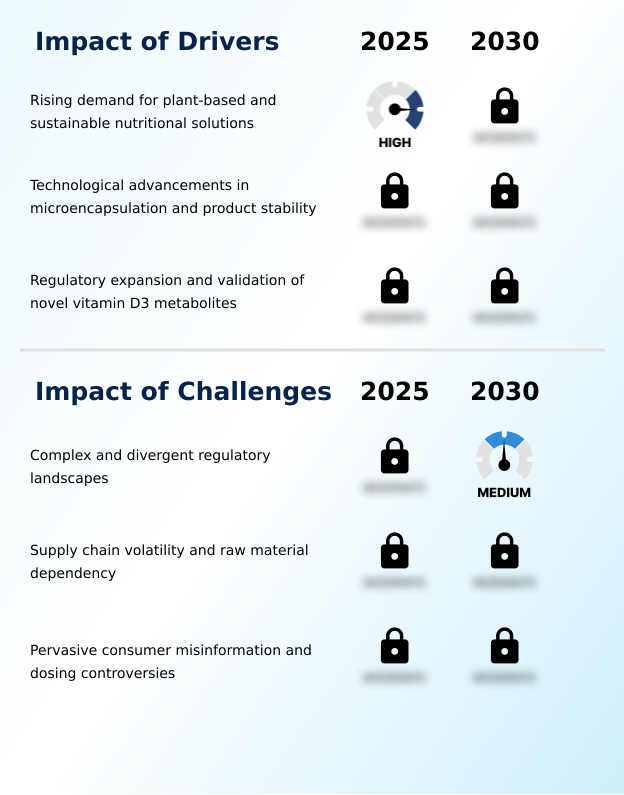
What are the key market drivers leading to the rise in the adoption of Vitamin D3 Industry?

  • The rising demand for plant-based and sustainable nutritional solutions is a key driver fueling market growth and innovation.

  • Market growth is significantly propelled by technological advancements in formulation and an evolving regulatory environment. The continuous innovation in cholecalciferol synthesis and delivery technologies, such as advanced microencapsulation, is a critical driver.
  • This technology enhances vitamin d3 stability in fortified foods and feed, preserving potency and reducing manufacturing waste by up to 10%. Another major driver is the increasing regulatory acceptance of novel vitamin d3 forms.
  • For instance, recent approvals for the use of 25-hydroxyvitamin d3 in new applications like aquaculture have unlocked substantial revenue streams, with market access expanding into previously untapped segments.
  • This validation from health authorities encourages further investment in research for high-efficacy vitamin d3 raw materials, such as crystalline vitamin d3, which serves as the foundation for high-purity vitamin d3 crystals used in pharmaceutical and nutraceutical products.

What are the market trends shaping the Vitamin D3 Industry?

  • The proliferation of vegan and sustainable alternatives is a key trend shaping the market. This shift reflects growing consumer demand for ethically sourced and plant-based nutritional solutions.

  • The market is undergoing a significant transformation as consumer preferences steer toward ethical and specialized nutritional solutions. A primary trend is the rapid proliferation of vegan cholecalciferol sources, with products derived from lichen and algae gaining market share from traditional lanolin. This addresses a growing demand for plant-based and hypoallergenic vitamin d3 options.
  • The adoption of these alternatives has been swift, with some brands seeing a 30% increase in engagement after launching certified vegan lines. Another key development is the expansion of advanced vitamin d3 metabolites, particularly for clinical applications and high-performance vitamin d3 in animal feed. These advanced formulations offer superior bioavailability, improving nutrient uptake by over 20% in certain animal studies.
  • Furthermore, the market is seeing a rise in oil-based vitamin d3 preparations and complex vitamin d3 dosage forms designed for specific demographics like pediatric and geriatric populations.

What challenges does the Vitamin D3 Industry face during its growth?

  • Complex and divergent regulatory landscapes present a significant challenge affecting the industry's growth trajectory and global market access.

  • The market faces considerable headwinds from a fragmented regulatory landscape and inherent supply chain vulnerabilities. Navigating the complex and often divergent international rules governing vitamin d3 fortification, dosage, and health claims presents a major hurdle. Companies report that compliance-related reformulations for different regions can increase product development costs by over 15%.
  • A more pressing challenge is the industry's reliance on lanolin, a byproduct of wool, for cholecalciferol production. This dependency creates significant vitamin d3 supply chain risks, as evidenced by price spikes of over 40% following agricultural disruptions in key wool-producing regions.
  • This volatility underscores the strategic need for sustainable vitamin d3 production and investment in alternative plant-based sources to ensure long-term market stability and mitigate reliance on a single, fluctuating commodity.

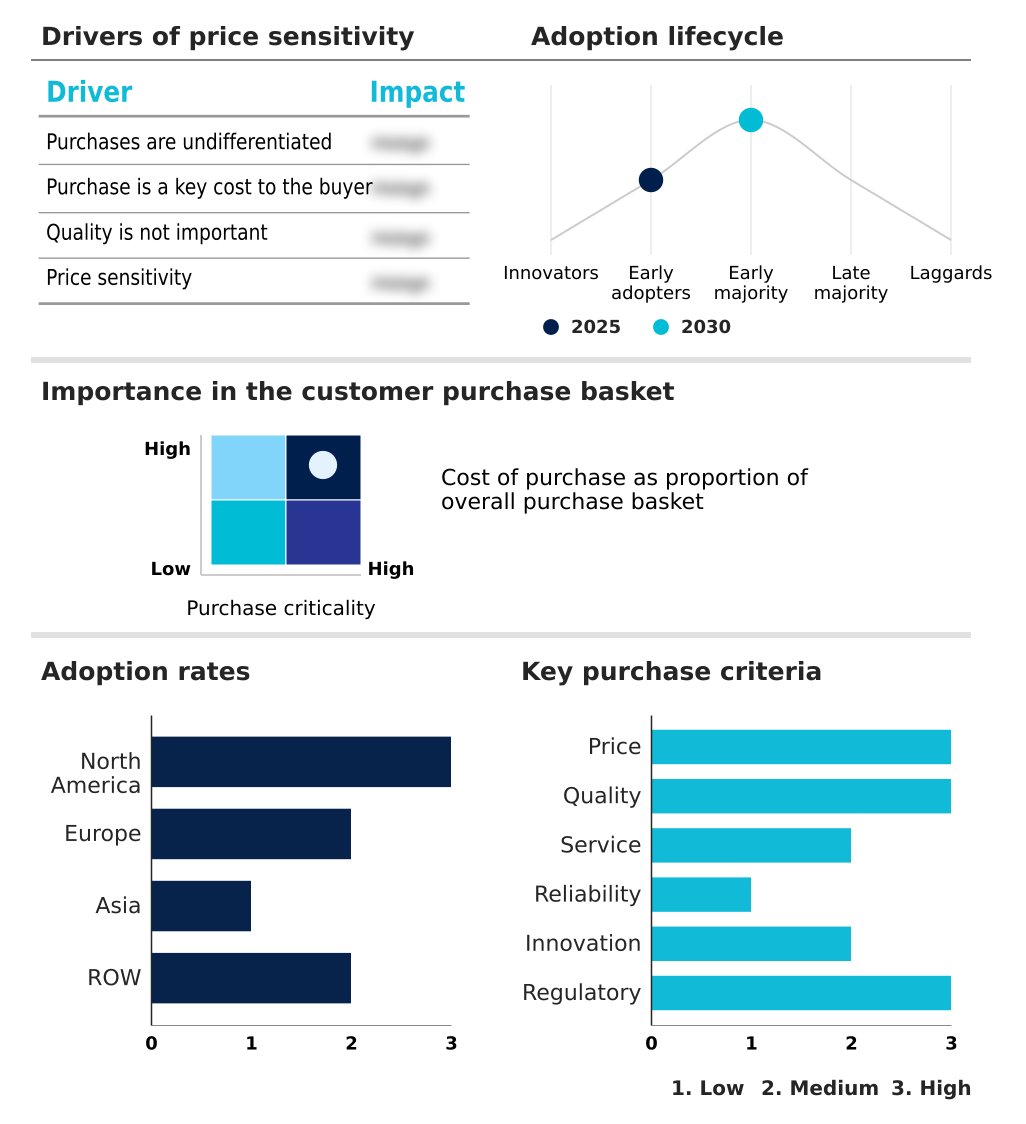
Exclusive Technavio Analysis on Customer Landscape

The vitamin d3 market forecasting report includes the adoption lifecycle of the market, covering from the innovator’s stage to the laggard’s stage. It focuses on adoption rates in different regions based on penetration. Furthermore, the vitamin d3 market report also includes key purchase criteria and drivers of price sensitivity to help companies evaluate and develop their market growth analysis strategies.

Customer Landscape of Vitamin D3 Industry

Competitive Landscape

Companies are implementing various strategies, such as strategic alliances, vitamin d3 market forecast, partnerships, mergers and acquisitions, geographical expansion, and product/service launches, to enhance their presence in the industry.

BASF SE - Key vendors provide specialized cholecalciferol ingredients and premix solutions, serving the food, feed, and pharmaceutical sectors with high-performance and stabilized formulations for diverse applications.

The industry research and growth report includes detailed analyses of the competitive landscape of the market and information about key companies, including:

  • BASF SE
  • BioTech Pharmacal Inc.
  • DSM Firmenich AG
  • Innobio Corp. Ltd.
  • Lycored Corp.
  • Makers Nutrition LLC
  • Nordic Naturals Inc.
  • NOW Health Group Inc.
  • Nutriearth
  • Pharma Nord Inc.
  • Pharmavite LLC
  • Pure Encapsulations LLC
  • Sports Research Corp.
  • Thorne HealthTech Inc.
  • Vitaweishi
  • Xiamen Kingdomway Group Co.
  • Zhejiang Medicine Co. Ltd.
  • Zhejiang NHU Co. Ltd.

Qualitative and quantitative analysis of companies has been conducted to help clients understand the wider business environment as well as the strengths and weaknesses of key industry players. Data is qualitatively analyzed to categorize companies as pure play, category-focused, industry-focused, and diversified; it is quantitatively analyzed to categorize companies as dominant, leading, strong, tentative, and weak.

Recent Development and News in Vitamin d3 market

  • In October 2024, BASF SE introduced Lutavit A/D3 1000/200 NXT, a next-generation microencapsulated product combining vitamins A and D3 for enhanced stability and convenience in animal feed applications.
  • In December 2024, dsm-firmenich AG secured authorization from the European Union for its vitamin D3 metabolite, Hy-D, for use in all animal species, significantly expanding its application into new sectors like aquaculture.
  • In March 2025, Fermenta Biotech Limited launched VITADEE Green, a completely plant-derived vitamin D3 in pharmacopeial-grade powder and oil formats, targeting the growing vegan and sustainable ingredient markets.
  • In May 2025, the Central Drugs Standard Control Organisation (CDSCO) in India initiated a review of a proposal for a high-dose (600,000 IU) cholecalciferol aqueous injection, signaling a focus on potent therapeutic options for severe deficiencies.

Dive into Technavio’s robust research methodology, blending expert interviews, extensive data synthesis, and validated models for unparalleled Vitamin D3 Market insights. See full methodology.

Market Scope
Page number 286
Base year 2025
Historic period 2020-2024
Forecast period 2026-2030
Growth momentum & CAGR Accelerate at a CAGR of 7.1%
Market growth 2026-2030 USD 914.9 million
Market structure Fragmented
YoY growth 2025-2026(%) 6.5%
Key countries US, Canada, Mexico, Germany, France, UK, Italy, Spain, The Netherlands, China, India, Japan, South Korea, Singapore, Indonesia, Brazil, Saudi Arabia, Argentina, UAE, South Africa, Colombia, Turkey and Egypt
Competitive landscape Leading Companies, Market Positioning of Companies, Competitive Strategies, and Industry Risks

Request Free Sample

Research Analyst Overview

  • The Vitamin D3 market is defined by a consistent drive toward specialization and enhanced efficacy, moving well beyond its foundational role in bone health. A significant industry pivot involves the commercialization of various vitamin d3 metabolites and hydroxylated vitamin d3 forms, such as calcifediol, which offer superior vitamin d3 bioavailability.
  • This shift toward advanced nutritional science is evident in both human and animal applications, with food-grade vitamin d3 and feed-grade vitamin d3 being formulated for specific outcomes. For boardroom consideration, the strategic decision to invest in R&D for algae-based vitamin d3 versus lichen-based vitamin d3 directly impacts long-term supply chain stability and brand positioning around sustainability.
  • Companies are leveraging diverse vitamin d3 delivery systems, including water-dispersible vitamin d3 and pharmacopeial-grade powder, to penetrate new product categories. Firms utilizing advanced vitamin d3 raw materials and vitamin d3 encapsulation techniques in animal nutrition have reported a 5% improvement in feed conversion ratios.
  • The focus on high-potency vitamin d3 for applications in pharmaceuticals and the broader push for vitamin d3 supplementation underscore the market's robust and evolving nature.

What are the Key Data Covered in this Vitamin D3 Market Research and Growth Report?

  • What is the expected growth of the Vitamin D3 Market between 2026 and 2030?

    • USD 914.9 million, at a CAGR of 7.1%

  • What segmentation does the market report cover?

    • The report is segmented by Application (Functional nutritions, Pharma, and Others), Formulation (Powder, Crystal, Oil, and Others), Grade Type (Food, and Feed) and Geography (North America, Europe, Asia, Rest of World (ROW))

  • Which regions are analyzed in the report?

    • North America, Europe, Asia and Rest of World (ROW)

  • What are the key growth drivers and market challenges?

    • Rising demand for plant-based and sustainable nutritional solutions, Complex and divergent regulatory landscapes

  • Who are the major players in the Vitamin D3 Market?

    • BASF SE, BioTech Pharmacal Inc., DSM Firmenich AG, Innobio Corp. Ltd., Lycored Corp., Makers Nutrition LLC, Nordic Naturals Inc., NOW Health Group Inc., Nutriearth, Pharma Nord Inc., Pharmavite LLC, Pure Encapsulations LLC, Sports Research Corp., Thorne HealthTech Inc., Vitaweishi, Xiamen Kingdomway Group Co., Zhejiang Medicine Co. Ltd. and Zhejiang NHU Co. Ltd.

Market Research Insights

  • The market is shaped by a dynamic interplay of scientific innovation and shifting consumer values, creating a competitive landscape where product differentiation is key. Demand for sustainable vitamin d3 production and plant-derived cholecalciferol solutions is compelling manufacturers to invest in novel sourcing and advanced formulations.
  • For example, firms that have adopted advanced vitamin d3 metabolites report a 25% higher rate of bioavailability compared to standard supplements. Concurrently, the rise of plant-based dairy alternatives has become a significant growth area, with fortified products seeing a 15% higher adoption rate than their non-fortified counterparts.
  • This focus on value-added products, including hypoallergenic vitamin d3 and specialized vitamin d3 dosage forms, allows companies to address niche segments like vitamin d3 for pediatric use and vitamin d3 for geriatric nutrition, thereby securing a stronger market position.

We can help! Our analysts can customize this vitamin d3 market research report to meet your requirements.

Get in touch

1. Executive Summary

1.1 Market overview

Executive Summary - Chart on Market Overview
Executive Summary - Data Table on Market Overview
Executive Summary - Chart on Global Market Characteristics
Executive Summary - Chart on Market by Geography
Executive Summary - Chart on Market Segmentation by Application
Executive Summary - Chart on Market Segmentation by Formulation
Executive Summary - Chart on Market Segmentation by Grade Type
Executive Summary - Chart on Incremental Growth
Executive Summary - Data Table on Incremental Growth
Executive Summary - Chart on Company Market Positioning

2. Technavio Analysis

2.1 Analysis of price sensitivity, lifecycle, customer purchase basket, adoption rates, and purchase criteria

2.2 Criticality of inputs and Factors of differentiation

Chart on Overview on criticality of inputs and factors of differentiation

2.3 Factors of disruption

Chart on Overview on factors of disruption

2.4 Impact of drivers and challenges

Chart on Impact of drivers and challenges in 2025 and 2030

3. Market Landscape

3.1 Market ecosystem

Chart on Parent Market
Data Table on - Parent Market

3.2 Market characteristics

Chart on Market characteristics analysis

3.3 Value chain analysis

Chart on Value chain analysis

4. Market Sizing

4.1 Market definition

Data Table on Offerings of companies included in the market definition

4.2 Market segment analysis

Market segments

4.3 Market size 2025

4.4 Market outlook: Forecast for 2025-2030

Chart on Global - Market size and forecast 2025-2030 ($ million)
Data Table on Global - Market size and forecast 2025-2030 ($ million)
Chart on Global Market: Year-over-year growth 2025-2030 (%)
Data Table on Global Market: Year-over-year growth 2025-2030 (%)

5. Historic Market Size

5.1 Global Vitamin D3 Market 2020 - 2024

Historic Market Size - Data Table on Global Vitamin D3 Market 2020 - 2024 ($ million)

5.2 Application segment analysis 2020 - 2024

Historic Market Size - Application Segment 2020 - 2024 ($ million)

5.3 Formulation segment analysis 2020 - 2024

Historic Market Size - Formulation Segment 2020 - 2024 ($ million)

5.4 Grade Type segment analysis 2020 - 2024

Historic Market Size - Grade Type Segment 2020 - 2024 ($ million)

5.5 Geography segment analysis 2020 - 2024

Historic Market Size - Geography Segment 2020 - 2024 ($ million)

5.6 Country segment analysis 2020 - 2024

Historic Market Size - Country Segment 2020 - 2024 ($ million)

6. Qualitative Analysis

6.1 Impact of AI on Global Vitamin D3 Market

6.2 Impact of geopolitical conflict on Global Vitamin D3 Market

7. Five Forces Analysis

7.1 Five forces summary

Five forces analysis - Comparison between 2025 and 2030

7.2 Bargaining power of buyers

Bargaining power of buyers - Impact of key factors 2025 and 2030

7.3 Bargaining power of suppliers

Bargaining power of suppliers - Impact of key factors in 2025 and 2030

7.4 Threat of new entrants

Threat of new entrants - Impact of key factors in 2025 and 2030

7.5 Threat of substitutes

Threat of substitutes - Impact of key factors in 2025 and 2030

7.6 Threat of rivalry

Threat of rivalry - Impact of key factors in 2025 and 2030

7.7 Market condition

Chart on Market condition - Five forces 2025 and 2030

8. Market Segmentation by Application

8.1 Market segments

Chart on Application - Market share 2025-2030 (%)
Data Table on Application - Market share 2025-2030 (%)

8.2 Comparison by Application

Chart on Comparison by Application
Data Table on Comparison by Application

8.3 Functional nutritions - Market size and forecast 2025-2030

Chart on Functional nutritions - Market size and forecast 2025-2030 ($ million)
Data Table on Functional nutritions - Market size and forecast 2025-2030 ($ million)
Chart on Functional nutritions - Year-over-year growth 2025-2030 (%)
Data Table on Functional nutritions - Year-over-year growth 2025-2030 (%)

8.4 Pharma - Market size and forecast 2025-2030

Chart on Pharma - Market size and forecast 2025-2030 ($ million)
Data Table on Pharma - Market size and forecast 2025-2030 ($ million)
Chart on Pharma - Year-over-year growth 2025-2030 (%)
Data Table on Pharma - Year-over-year growth 2025-2030 (%)

8.5 Others - Market size and forecast 2025-2030

Chart on Others - Market size and forecast 2025-2030 ($ million)
Data Table on Others - Market size and forecast 2025-2030 ($ million)
Chart on Others - Year-over-year growth 2025-2030 (%)
Data Table on Others - Year-over-year growth 2025-2030 (%)

8.6 Market opportunity by Application

Market opportunity by Application ($ million)
Data Table on Market opportunity by Application ($ million)

9. Market Segmentation by Formulation

9.1 Market segments

Chart on Formulation - Market share 2025-2030 (%)
Data Table on Formulation - Market share 2025-2030 (%)

9.2 Comparison by Formulation

Chart on Comparison by Formulation
Data Table on Comparison by Formulation

9.3 Powder - Market size and forecast 2025-2030

Chart on Powder - Market size and forecast 2025-2030 ($ million)
Data Table on Powder - Market size and forecast 2025-2030 ($ million)
Chart on Powder - Year-over-year growth 2025-2030 (%)
Data Table on Powder - Year-over-year growth 2025-2030 (%)

9.4 Crystal - Market size and forecast 2025-2030

Chart on Crystal - Market size and forecast 2025-2030 ($ million)
Data Table on Crystal - Market size and forecast 2025-2030 ($ million)
Chart on Crystal - Year-over-year growth 2025-2030 (%)
Data Table on Crystal - Year-over-year growth 2025-2030 (%)

9.5 Oil - Market size and forecast 2025-2030

Chart on Oil - Market size and forecast 2025-2030 ($ million)
Data Table on Oil - Market size and forecast 2025-2030 ($ million)
Chart on Oil - Year-over-year growth 2025-2030 (%)
Data Table on Oil - Year-over-year growth 2025-2030 (%)

9.6 Others - Market size and forecast 2025-2030

Chart on Others - Market size and forecast 2025-2030 ($ million)
Data Table on Others - Market size and forecast 2025-2030 ($ million)
Chart on Others - Year-over-year growth 2025-2030 (%)
Data Table on Others - Year-over-year growth 2025-2030 (%)

9.7 Market opportunity by Formulation

Market opportunity by Formulation ($ million)
Data Table on Market opportunity by Formulation ($ million)

10. Market Segmentation by Grade Type

10.1 Market segments

Chart on Grade Type - Market share 2025-2030 (%)
Data Table on Grade Type - Market share 2025-2030 (%)

10.2 Comparison by Grade Type

Chart on Comparison by Grade Type
Data Table on Comparison by Grade Type

10.3 Food - Market size and forecast 2025-2030

Chart on Food - Market size and forecast 2025-2030 ($ million)
Data Table on Food - Market size and forecast 2025-2030 ($ million)
Chart on Food - Year-over-year growth 2025-2030 (%)
Data Table on Food - Year-over-year growth 2025-2030 (%)

10.4 Feed - Market size and forecast 2025-2030

Chart on Feed - Market size and forecast 2025-2030 ($ million)
Data Table on Feed - Market size and forecast 2025-2030 ($ million)
Chart on Feed - Year-over-year growth 2025-2030 (%)
Data Table on Feed - Year-over-year growth 2025-2030 (%)

10.5 Market opportunity by Grade Type

Market opportunity by Grade Type ($ million)
Data Table on Market opportunity by Grade Type ($ million)

11. Customer Landscape

11.1 Customer landscape overview

Analysis of price sensitivity, lifecycle, customer purchase basket, adoption rates, and purchase criteria

12. Geographic Landscape

12.1 Geographic segmentation

Chart on Market share by geography 2025-2030 (%)
Data Table on Market share by geography 2025-2030 (%)

12.2 Geographic comparison

Chart on Geographic comparison
Data Table on Geographic comparison

12.3 North America - Market size and forecast 2025-2030

Chart on North America - Market size and forecast 2025-2030 ($ million)
Data Table on North America - Market size and forecast 2025-2030 ($ million)
Chart on North America - Year-over-year growth 2025-2030 (%)
Data Table on North America - Year-over-year growth 2025-2030 (%)
Chart on Regional Comparison - North America
Data Table on Regional Comparison - North America

12.3.1 US - Market size and forecast 2025-2030

Chart on US - Market size and forecast 2025-2030 ($ million)
Data Table on US - Market size and forecast 2025-2030 ($ million)
Chart on US - Year-over-year growth 2025-2030 (%)
Data Table on US - Year-over-year growth 2025-2030 (%)

12.3.2 Canada - Market size and forecast 2025-2030

Chart on Canada - Market size and forecast 2025-2030 ($ million)
Data Table on Canada - Market size and forecast 2025-2030 ($ million)
Chart on Canada - Year-over-year growth 2025-2030 (%)
Data Table on Canada - Year-over-year growth 2025-2030 (%)

12.3.3 Mexico - Market size and forecast 2025-2030

Chart on Mexico - Market size and forecast 2025-2030 ($ million)
Data Table on Mexico - Market size and forecast 2025-2030 ($ million)
Chart on Mexico - Year-over-year growth 2025-2030 (%)
Data Table on Mexico - Year-over-year growth 2025-2030 (%)

12.4 Europe - Market size and forecast 2025-2030

Chart on Europe - Market size and forecast 2025-2030 ($ million)
Data Table on Europe - Market size and forecast 2025-2030 ($ million)
Chart on Europe - Year-over-year growth 2025-2030 (%)
Data Table on Europe - Year-over-year growth 2025-2030 (%)
Chart on Regional Comparison - Europe
Data Table on Regional Comparison - Europe

12.4.1 Germany - Market size and forecast 2025-2030

Chart on Germany - Market size and forecast 2025-2030 ($ million)
Data Table on Germany - Market size and forecast 2025-2030 ($ million)
Chart on Germany - Year-over-year growth 2025-2030 (%)
Data Table on Germany - Year-over-year growth 2025-2030 (%)

12.4.2 France - Market size and forecast 2025-2030

Chart on France - Market size and forecast 2025-2030 ($ million)
Data Table on France - Market size and forecast 2025-2030 ($ million)
Chart on France - Year-over-year growth 2025-2030 (%)
Data Table on France - Year-over-year growth 2025-2030 (%)

12.4.3 UK - Market size and forecast 2025-2030

Chart on UK - Market size and forecast 2025-2030 ($ million)
Data Table on UK - Market size and forecast 2025-2030 ($ million)
Chart on UK - Year-over-year growth 2025-2030 (%)
Data Table on UK - Year-over-year growth 2025-2030 (%)

12.4.4 Italy - Market size and forecast 2025-2030

Chart on Italy - Market size and forecast 2025-2030 ($ million)
Data Table on Italy - Market size and forecast 2025-2030 ($ million)
Chart on Italy - Year-over-year growth 2025-2030 (%)
Data Table on Italy - Year-over-year growth 2025-2030 (%)

12.4.5 Spain - Market size and forecast 2025-2030

Chart on Spain - Market size and forecast 2025-2030 ($ million)
Data Table on Spain - Market size and forecast 2025-2030 ($ million)
Chart on Spain - Year-over-year growth 2025-2030 (%)
Data Table on Spain - Year-over-year growth 2025-2030 (%)

12.4.6 The Netherlands - Market size and forecast 2025-2030

Chart on The Netherlands - Market size and forecast 2025-2030 ($ million)
Data Table on The Netherlands - Market size and forecast 2025-2030 ($ million)
Chart on The Netherlands - Year-over-year growth 2025-2030 (%)
Data Table on The Netherlands - Year-over-year growth 2025-2030 (%)

12.5 Asia - Market size and forecast 2025-2030

Chart on Asia - Market size and forecast 2025-2030 ($ million)
Data Table on Asia - Market size and forecast 2025-2030 ($ million)
Chart on Asia - Year-over-year growth 2025-2030 (%)
Data Table on Asia - Year-over-year growth 2025-2030 (%)
Chart on Regional Comparison - Asia
Data Table on Regional Comparison - Asia

12.5.1 China - Market size and forecast 2025-2030

Chart on China - Market size and forecast 2025-2030 ($ million)
Data Table on China - Market size and forecast 2025-2030 ($ million)
Chart on China - Year-over-year growth 2025-2030 (%)
Data Table on China - Year-over-year growth 2025-2030 (%)

12.5.2 India - Market size and forecast 2025-2030

Chart on India - Market size and forecast 2025-2030 ($ million)
Data Table on India - Market size and forecast 2025-2030 ($ million)
Chart on India - Year-over-year growth 2025-2030 (%)
Data Table on India - Year-over-year growth 2025-2030 (%)

12.5.3 Japan - Market size and forecast 2025-2030

Chart on Japan - Market size and forecast 2025-2030 ($ million)
Data Table on Japan - Market size and forecast 2025-2030 ($ million)
Chart on Japan - Year-over-year growth 2025-2030 (%)
Data Table on Japan - Year-over-year growth 2025-2030 (%)

12.5.4 South Korea - Market size and forecast 2025-2030

Chart on South Korea - Market size and forecast 2025-2030 ($ million)
Data Table on South Korea - Market size and forecast 2025-2030 ($ million)
Chart on South Korea - Year-over-year growth 2025-2030 (%)
Data Table on South Korea - Year-over-year growth 2025-2030 (%)

12.5.5 Singapore - Market size and forecast 2025-2030

Chart on Singapore - Market size and forecast 2025-2030 ($ million)
Data Table on Singapore - Market size and forecast 2025-2030 ($ million)
Chart on Singapore - Year-over-year growth 2025-2030 (%)
Data Table on Singapore - Year-over-year growth 2025-2030 (%)

12.5.6 Indonesia - Market size and forecast 2025-2030

Chart on Indonesia - Market size and forecast 2025-2030 ($ million)
Data Table on Indonesia - Market size and forecast 2025-2030 ($ million)
Chart on Indonesia - Year-over-year growth 2025-2030 (%)
Data Table on Indonesia - Year-over-year growth 2025-2030 (%)

12.6 Rest of World (ROW) - Market size and forecast 2025-2030

Chart on Rest of World (ROW) - Market size and forecast 2025-2030 ($ million)
Data Table on Rest of World (ROW) - Market size and forecast 2025-2030 ($ million)
Chart on Rest of World (ROW) - Year-over-year growth 2025-2030 (%)
Data Table on Rest of World (ROW) - Year-over-year growth 2025-2030 (%)
Chart on Regional Comparison - Rest of World (ROW)
Data Table on Regional Comparison - Rest of World (ROW)

12.6.1 Brazil - Market size and forecast 2025-2030

Chart on Brazil - Market size and forecast 2025-2030 ($ million)
Data Table on Brazil - Market size and forecast 2025-2030 ($ million)
Chart on Brazil - Year-over-year growth 2025-2030 (%)
Data Table on Brazil - Year-over-year growth 2025-2030 (%)

12.6.2 Saudi Arabia - Market size and forecast 2025-2030

Chart on Saudi Arabia - Market size and forecast 2025-2030 ($ million)
Data Table on Saudi Arabia - Market size and forecast 2025-2030 ($ million)
Chart on Saudi Arabia - Year-over-year growth 2025-2030 (%)
Data Table on Saudi Arabia - Year-over-year growth 2025-2030 (%)

12.6.3 Argentina - Market size and forecast 2025-2030

Chart on Argentina - Market size and forecast 2025-2030 ($ million)
Data Table on Argentina - Market size and forecast 2025-2030 ($ million)
Chart on Argentina - Year-over-year growth 2025-2030 (%)
Data Table on Argentina - Year-over-year growth 2025-2030 (%)

12.6.4 UAE - Market size and forecast 2025-2030

Chart on UAE - Market size and forecast 2025-2030 ($ million)
Data Table on UAE - Market size and forecast 2025-2030 ($ million)
Chart on UAE - Year-over-year growth 2025-2030 (%)
Data Table on UAE - Year-over-year growth 2025-2030 (%)

12.6.5 South Africa - Market size and forecast 2025-2030

Chart on South Africa - Market size and forecast 2025-2030 ($ million)
Data Table on South Africa - Market size and forecast 2025-2030 ($ million)
Chart on South Africa - Year-over-year growth 2025-2030 (%)
Data Table on South Africa - Year-over-year growth 2025-2030 (%)

12.6.6 Colombia - Market size and forecast 2025-2030

Chart on Colombia - Market size and forecast 2025-2030 ($ million)
Data Table on Colombia - Market size and forecast 2025-2030 ($ million)
Chart on Colombia - Year-over-year growth 2025-2030 (%)
Data Table on Colombia - Year-over-year growth 2025-2030 (%)

12.6.7 Turkey - Market size and forecast 2025-2030

Chart on Turkey - Market size and forecast 2025-2030 ($ million)
Data Table on Turkey - Market size and forecast 2025-2030 ($ million)
Chart on Turkey - Year-over-year growth 2025-2030 (%)
Data Table on Turkey - Year-over-year growth 2025-2030 (%)

12.6.8 Egypt - Market size and forecast 2025-2030

Chart on Egypt - Market size and forecast 2025-2030 ($ million)
Data Table on Egypt - Market size and forecast 2025-2030 ($ million)
Chart on Egypt - Year-over-year growth 2025-2030 (%)
Data Table on Egypt - Year-over-year growth 2025-2030 (%)

12.7 Market opportunity by geography

Market opportunity by geography ($ million)
Data Tables on Market opportunity by geography ($ million)

13. Drivers, Challenges, and Opportunity

13.1 Market drivers

Rising demand for plant-based and sustainable nutritional solutions
Technological advancements in microencapsulation and product stability
Regulatory expansion and validation of novel vitamin D3 metabolites

13.2 Market challenges

Complex and divergent regulatory landscapes
Supply chain volatility and raw material dependency
Pervasive consumer misinformation and dosing controversies

13.3 Impact of drivers and challenges

Impact of drivers and challenges in 2025 and 2030

13.4 Market opportunities

Proliferation of vegan and sustainable alternatives
Expansion of advanced metabolites for clinical and animal health
Rising adoption of multi-nutrient and functional fortification solutions

14. Competitive Landscape

14.1 Overview

14.2

Overview on criticality of inputs and factors of differentiation

14.3 Landscape disruption

Overview on factors of disruption

14.4 Industry risks

Impact of key risks on business

15. Competitive Analysis

15.1 Companies profiled

Companies covered

15.2 Company ranking index

15.3 Market positioning of companies

Matrix on companies position and classification

15.4 BASF SE

BASF SE - Overview
BASF SE - Business segments
BASF SE - Key news
BASF SE - Key offerings
BASF SE - Segment focus
SWOT

15.5 BioTech Pharmacal Inc.

BioTech Pharmacal Inc. - Overview
BioTech Pharmacal Inc. - Product / Service
BioTech Pharmacal Inc. - Key offerings
SWOT

15.6 DSM Firmenich AG

DSM Firmenich AG - Overview
DSM Firmenich AG - Business segments
DSM Firmenich AG - Key offerings
DSM Firmenich AG - Segment focus
SWOT

15.7 Innobio Corp. Ltd.

Innobio Corp. Ltd. - Overview
Innobio Corp. Ltd. - Product / Service
Innobio Corp. Ltd. - Key offerings
SWOT

15.8 Makers Nutrition LLC

Makers Nutrition LLC - Overview
Makers Nutrition LLC - Product / Service
Makers Nutrition LLC - Key offerings
SWOT

15.9 Nordic Naturals Inc.

Nordic Naturals Inc. - Overview
Nordic Naturals Inc. - Product / Service
Nordic Naturals Inc. - Key offerings
SWOT

15.10 NOW Health Group Inc.

NOW Health Group Inc. - Overview
NOW Health Group Inc. - Product / Service
NOW Health Group Inc. - Key offerings
SWOT

15.11 Nutriearth

Nutriearth - Overview
Nutriearth - Product / Service
Nutriearth - Key offerings
SWOT

15.12 Pharmavite LLC

Pharmavite LLC - Overview
Pharmavite LLC - Product / Service
Pharmavite LLC - Key offerings
SWOT

15.13 Pure Encapsulations LLC

Pure Encapsulations LLC - Overview
Pure Encapsulations LLC - Product / Service
Pure Encapsulations LLC - Key offerings
SWOT

15.14 Sports Research Corp.

Sports Research Corp. - Overview
Sports Research Corp. - Product / Service
Sports Research Corp. - Key offerings
SWOT

15.15 Thorne HealthTech Inc.

Thorne HealthTech Inc. - Overview
Thorne HealthTech Inc. - Product / Service
Thorne HealthTech Inc. - Key offerings
SWOT

15.16 Xiamen Kingdomway Group Co.

Xiamen Kingdomway Group Co. - Overview
Xiamen Kingdomway Group Co. - Business segments
Xiamen Kingdomway Group Co. - Key offerings
Xiamen Kingdomway Group Co. - Segment focus
SWOT

15.17 Zhejiang Medicine Co. Ltd.

Zhejiang Medicine Co. Ltd. - Overview
Zhejiang Medicine Co. Ltd. - Business segments
Zhejiang Medicine Co. Ltd. - Key offerings
Zhejiang Medicine Co. Ltd. - Segment focus
SWOT

15.18 Zhejiang NHU Co. Ltd.

Zhejiang NHU Co. Ltd. - Overview
Zhejiang NHU Co. Ltd. - Business segments
Zhejiang NHU Co. Ltd. - Key offerings
Zhejiang NHU Co. Ltd. - Segment focus
SWOT

16. Appendix

16.1 Scope of the report

Market definition
Objectives
Notes and caveats

16.2 Inclusions and exclusions checklist

Inclusions checklist
Exclusions checklist

16.3 Currency conversion rates for US$

16.4 Research methodology

16.5 Data procurement

Information sources

16.6 Data validation

16.7 Validation techniques employed for market sizing

16.8 Data synthesis

16.9 360 degree market analysis

16.10 List of abbreviations

Research Methodology

Technavio presents a detailed picture of the market by way of study, synthesis, and summation of data from multiple sources. The analysts have presented the various facets of the market with a particular focus on identifying the key industry influencers. The data thus presented is comprehensive, reliable, and the result of extensive research, both primary and secondary.

INFORMATION SOURCES

Primary sources

  • Manufacturers and suppliers
  • Channel partners
  • Industry experts
  • Strategic decision makers

Secondary sources

  • Industry journals and periodicals
  • Government data
  • Financial reports of key industry players
  • Historical data
  • Press releases

DATA ANALYSIS

Data Synthesis

  • Collation of data
  • Estimation of key figures
  • Analysis of derived insights

Data Validation

  • Triangulation with data models
  • Reference against proprietary databases
  • Corroboration with industry experts

REPORT WRITING

Qualitative

  • Market drivers
  • Market challenges
  • Market trends
  • Five forces analysis

Quantitative

  • Market size and forecast
  • Market segmentation
  • Geographical insights
  • Competitive landscape

Interested in this report?

Get your sample now to see our research methodology and insights!

Download Now

Frequently Asked Questions

Vitamin D3 market growth will increase by USD 914.9 million during 2026-2030.

The Vitamin D3 market is expected to grow at a CAGR of 7.1% during 2026-2030.

Vitamin D3 market is segmented by Application (Functional nutritions, Pharma, Others) Formulation (Powder, Crystal, Oil, Others) Grade type (Food, Feed)

BASF SE, BioTech Pharmacal Inc., DSM Firmenich AG, Innobio Corp. Ltd., Lycored Corp., Makers Nutrition LLC, Nordic Naturals Inc., NOW Health Group Inc., Nutriearth, Pharma Nord Inc., Pharmavite LLC, Pure Encapsulations LLC, Sports Research Corp., Thorne HealthTech Inc., Vitaweishi, Xiamen Kingdomway Group Co., Zhejiang Medicine Co. Ltd., Zhejiang NHU Co. Ltd. are a few of the key vendors in the Vitamin D3 market.

North America will register the highest growth rate of 40.1% among the other regions. Therefore, the Vitamin D3 market in North America is expected to garner significant business opportunities for the vendors during the forecast period.

US, Canada, Mexico, Germany, France, UK, Italy, Spain, The Netherlands, China, India, Japan, South Korea, Singapore, Indonesia, Brazil, Saudi Arabia, Argentina, UAE, South Africa, Colombia, Turkey, Egypt

  • Rising demand for plant-based and sustainable nutritional solutions is the driving factor this market.

The Vitamin D3 market vendors should focus on grabbing business opportunities from the Application segment as it accounted for the largest market share in the base year.
RIA - Research AI Assistant
Ask RIA