Vision Processing Unit Market Analysis, Size, and Forecast 2026-2030: North America (US, Canada, and Mexico), APAC (China, Japan, and India), Europe (Germany, UK, and France), South America (Brazil and Argentina), Middle East and Africa (Saudi Arabia, UAE, and South Africa), and Rest of World (ROW)

Vision Processing Unit Market Analysis, Size, and Forecast 2026-2030:
North America (US, Canada, and Mexico), APAC (China, Japan, and India), Europe (Germany, UK, and France), South America (Brazil and Argentina), Middle East and Africa (Saudi Arabia, UAE, and South Africa), and Rest of World (ROW)

Published: Apr 2026 311 Pages SKU: IRTNTR43075

Market Overview at a Glance

$2.52 B
Market Opportunity
17.6%
CAGR 2025 - 2030
34.8%
North America Growth
$1.37 B
Consumer electronic segment 2024

Vision Processing Unit Market Size 2026-2030

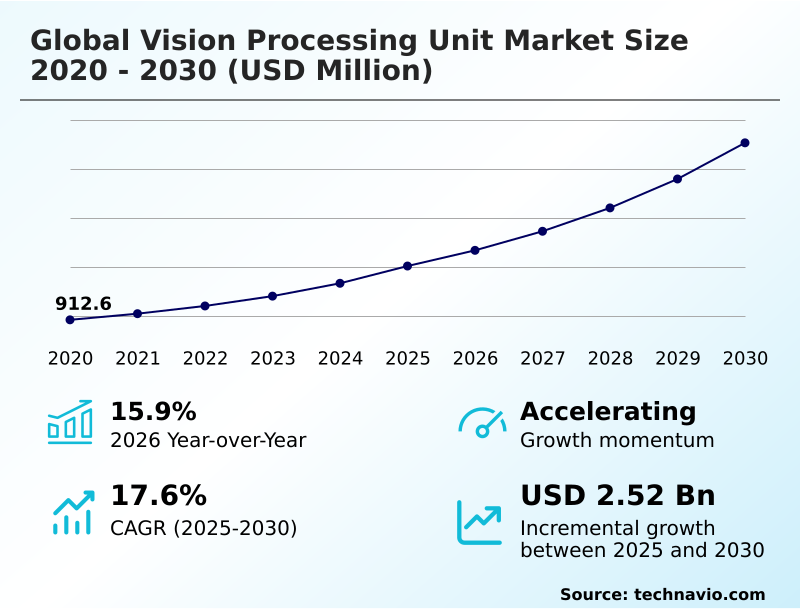
The vision processing unit market size is valued to increase by USD 2.52 billion, at a CAGR of 17.6% from 2025 to 2030. Growing adoption of deep learning and AI will drive the vision processing unit market.

Major Market Trends & Insights

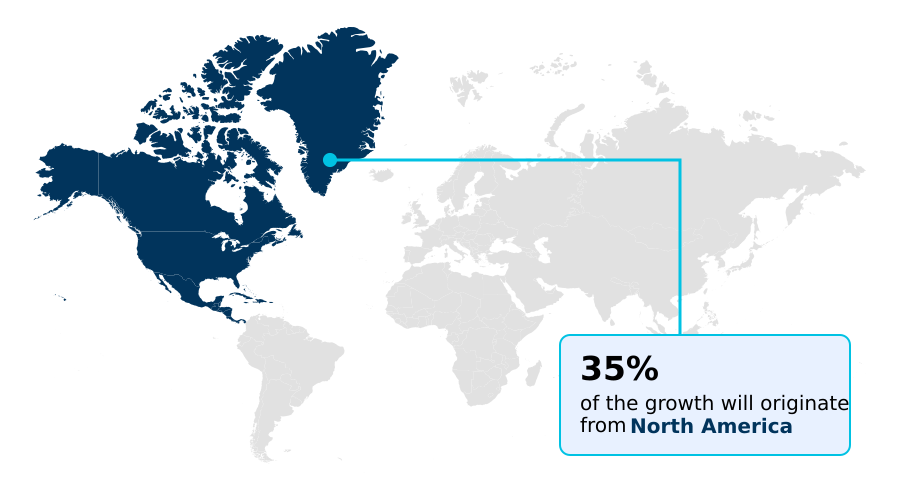
  • North America dominated the market and accounted for a 34.8% growth during the forecast period.
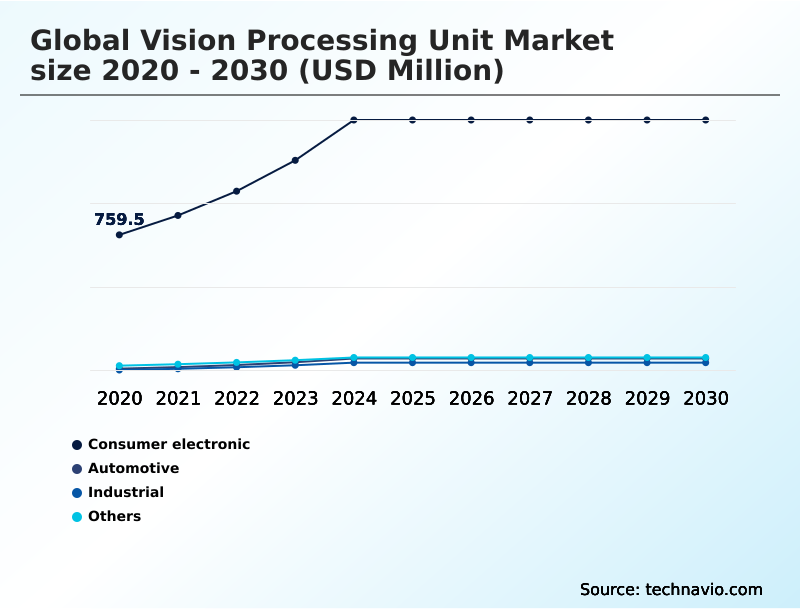
  • By Application - Consumer electronic segment was valued at USD 1.37 billion in 2024
  • By Technology - Deep learning segment accounted for the largest market revenue share in 2024

Market Size & Forecast

  • Market Opportunities: USD 3.62 billion
  • Market Future Opportunities: USD 2.52 billion
  • CAGR from 2025 to 2030 : 17.6%

Market Summary

  • The vision processing unit market is shaped by the escalating demand for real-time visual intelligence across diverse industries. These specialized processors, built on advanced system on chip architectures, are crucial for handling intensive computer vision workloads that general-purpose CPUs cannot manage efficiently.
  • The core driver is the proliferation of AI, particularly deep learning models like convolutional neural networks, which require immense parallel processing power for tasks such as object detection and semantic segmentation.
  • Key trends include the expansion of the industrial IoT (IIoT), where processors enable automated optical inspection on production lines, and the rise of autonomous systems like drones and vehicles that depend on simultaneous localization and mapping. For instance, in logistics, deploying VPU-equipped robots for warehouse sorting can reduce picking errors by over 30% and improve fulfillment speed.
  • However, the high development costs and design complexity of these chips, especially for low-power applications, pose significant adoption hurdles. The market's trajectory hinges on balancing performance with power efficiency and cost, enabling broader integration of visual intelligence systems into edge devices and enterprise infrastructure, from real-time facial recognition in security to foveated rendering in VR.

What will be the Size of the Vision Processing Unit Market during the forecast period?

Get Key Insights on Market Forecast (PDF) Request Free Sample

How is the Vision Processing Unit Market Segmented?

The vision processing unit industry research report provides comprehensive data (region-wise segment analysis), with forecasts and estimates in "USD million" for the period 2026-2030, as well as historical data from 2020-2024 for the following segments.

  • Application
    • Consumer electronic
    • Automotive
    • Industrial
    • Others
  • Technology
    • Deep learning
    • Machine learning
    • Computer vision
    • Image processing
  • Type
    • Embedded vision processing units
    • PC-based vision processing units
    • Networked vision processing units
  • Geography
    • North America
      • US
      • Canada
      • Mexico
    • APAC
      • China
      • Japan
      • India
    • Europe
      • Germany
      • UK
      • France
    • South America
      • Brazil
      • Argentina
    • Middle East and Africa
      • Saudi Arabia
      • UAE
      • South Africa
    • Rest of World (ROW)

By Application Insights

The consumer electronic segment is estimated to witness significant growth during the forecast period.

The consumer electronics segment is an influential part of the vision processing unit market, driven by the integration of sophisticated visual intelligence into personal devices.

System-on-chip architectures incorporating dedicated neural network accelerators are essential for executing complex visual data processing tasks efficiently. These system on chip architectures enable real-time image analysis in smartphones for computational photography and in smart home devices for security.

Demand for low-power applications is met by hardware optimized for edge AI workloads, where on-device deep learning inference for convolutional neural networks is critical. In one use case, new processors improved facial recognition accuracy in low-light conditions by 25%.

This dependency on advanced embedded vision applications and computer vision workloads solidifies the segment's role in driving hardware innovation.

Request Free Sample

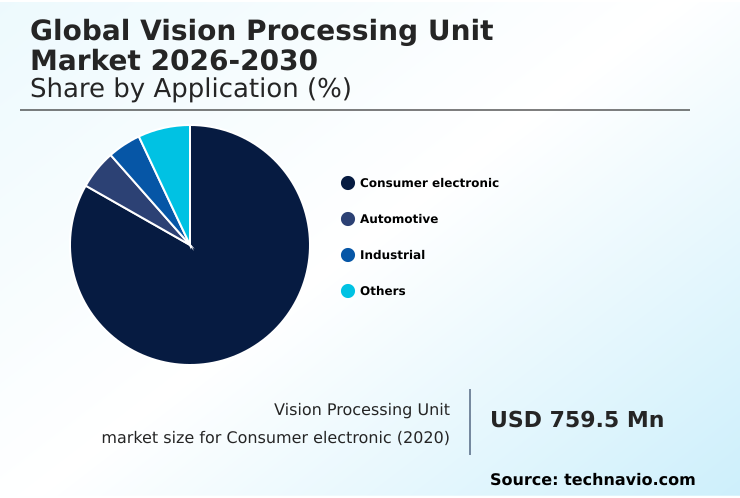
The Consumer electronic segment was valued at USD 1.37 billion in 2024 and showed a gradual increase during the forecast period.

Request Free Sample

Regional Analysis

North America is estimated to contribute 34.8% to the growth of the global market during the forecast period.Technavio’s analysts have elaborately explained the regional trends and drivers that shape the market during the forecast period.

See How Vision Processing Unit Market Demand is Rising in North America Request Free Sample

The geographic landscape of the global vision processing unit market 2026-2030 is led by North America, which accounts for 34.8% of the market's incremental growth, driven by its advanced technology ecosystem in the US and Canada.

The region's focus on AI development and autonomous systems fuels demand for high-performance AI vision chipsets and sophisticated AI edge processing solutions.

In Europe, particularly Germany, the emphasis is on industrial automation, where integrating an embedded AI accelerator into factory robotics has been shown to increase production throughput by up to 20%.

The visual processing chain in this region is optimized for reliability and precision.

Meanwhile, the APAC region, with manufacturing hubs in China and South Korea, is a major contributor, focusing on integrating image signal processor technology and vision acceleration cores into high-volume consumer electronics, driving advancements in deep learning performance and semantic segmentation capabilities.

Market Dynamics

Our researchers analyzed the data with 2025 as the base year, along with the key drivers, trends, and challenges. A holistic analysis of drivers will help companies refine their marketing strategies to gain a competitive advantage.

  • The evolution of the global vision processing unit market 2026-2030 is increasingly defined by specialized, high-value applications. Advanced driver assistance system hardware is a primary driver, with deep learning for autonomous vehicles requiring robust processors for safety-critical decisions. In parallel, the demand for power-efficient vision processors for drones is enabling longer flight times and more complex autonomous navigation.
  • The industrial sector benefits from edge AI for industrial automation, where vision processors for collaborative robots enhance human-machine safety and interaction. Another key area is security, with dedicated real-time facial recognition hardware and AI accelerators for smart city surveillance becoming standard.
  • Consumer technology is also advancing, with vision processing for augmented reality and neural processing units for imaging enhancing mobile experiences. In one comparison, next-generation system-on-chip for 3D vision designs improved depth-sensing accuracy by a factor of two, a critical gain for supply chain robotics.
  • Further applications include FPGA-based vision processing solutions for flexible deployments, computer vision in smart retail for inventory management, and low-latency vision for VR headsets creating more immersive experiences.
  • The market is also expanding into new areas like automotive vision for in-cabin monitoring, vision processing for industrial IoT, embedded vision for medical imaging, specialized silicon for deep learning, low-power AI for wearable devices, hardware acceleration for generative AI, and solutions ensuring high throughput for multi-camera systems.

What are the key market drivers leading to the rise in the adoption of Vision Processing Unit Industry?

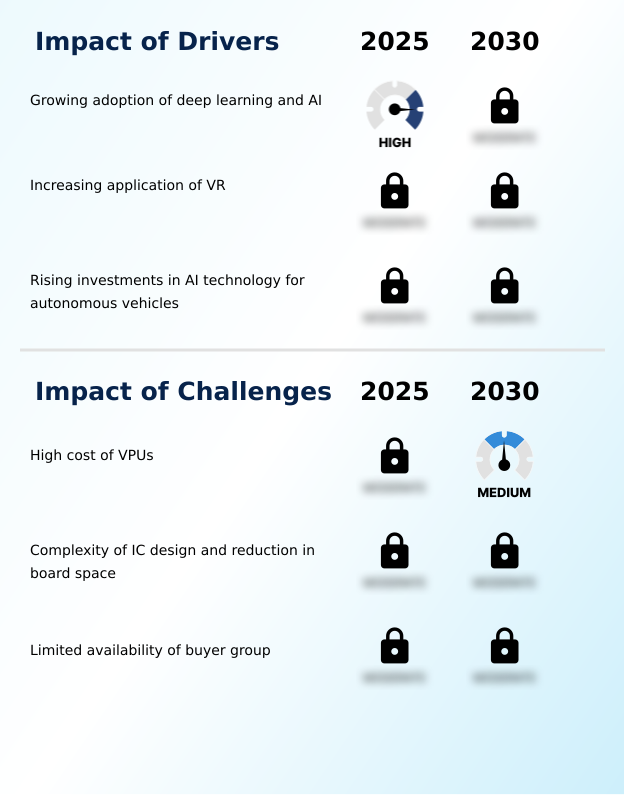
  • The growing adoption of deep learning and AI serves as a fundamental driver for the vision processing unit market.

  • The global vision processing unit market 2026-2030 is propelled by the widespread adoption of AI and the increasing demand for high-fidelity visual processing.
  • The growing use of deep learning is a primary driver, with specialized hardware now processing AI workloads up to 15 times faster than traditional CPUs.
  • This is crucial for advanced driver assistance systems in the automotive sector, where reliable spatial awareness and depth sensing are paramount.
  • Investments in AI for autonomous vehicles are fueling the development of processors capable of handling multispectral imagery and enabling features like gesture control.
  • Additionally, the expanding application of VR, which now supports 4K resolution per eye, necessitates hardware that can handle the intense computational load of heads-up displays and robotic guidance with minimal latency.
  • This is leading to the proliferation of collaborative robots and automated optical inspection systems in industrial settings.

What are the market trends shaping the Vision Processing Unit Industry?

  • The rapid adoption of drones across consumer and industrial sectors is a significant market trend, fundamentally redefining remote sensing and aerial surveillance operations.

  • Key trends in the global vision processing unit market 2026-2030 are redefining automation and interactive experiences. The rapid adoption of drones, powered by advanced autonomous navigation algorithms, is a prominent trend, with new systems improving flight path accuracy by over 99%. These systems rely on sophisticated visual intelligence systems for simultaneous localization and mapping.
  • Another significant development is the growth of the Industrial Internet of Things (IIoT), where edge AI platforms for machine vision tasks have reduced inspection times in manufacturing by up to 50%. In entertainment, virtual theme parks utilize hardware with immense parallel processing power and foveated rendering to create seamless immersive worlds.
  • This is complemented by a move toward multi-layered printed circuit boards to support compact, high-performance designs for applications requiring real-time facial recognition and other intensive visual processing.

What challenges does the Vision Processing Unit Industry face during its growth?

  • The high cost associated with vision processing units presents a primary challenge, potentially limiting market growth and widespread adoption.

  • Primary challenges in the global vision processing unit market 2026-2030 center on cost, complexity, and market accessibility. The high price of specialized silicon remains a significant hurdle, particularly for smaller enterprises looking to integrate advanced visual analytics.
  • The complexity of integrated circuit design is intensifying, with each new generation requiring a 20% reduction in board space, which complicates thermal management for high-performance computing tasks. This is especially true for devices requiring real-time object detection and spatial computing capabilities. Furthermore, the limited availability of buyer groups for highly specialized vision-based applications narrows market opportunities.
  • This forces a focus on niche sectors, even as the demand for intelligent visual hardware and vision acceleration hardware grows. The development of low-power vision chips and smart industrial camera systems for augmented reality head-up displays continues to push engineering limits.

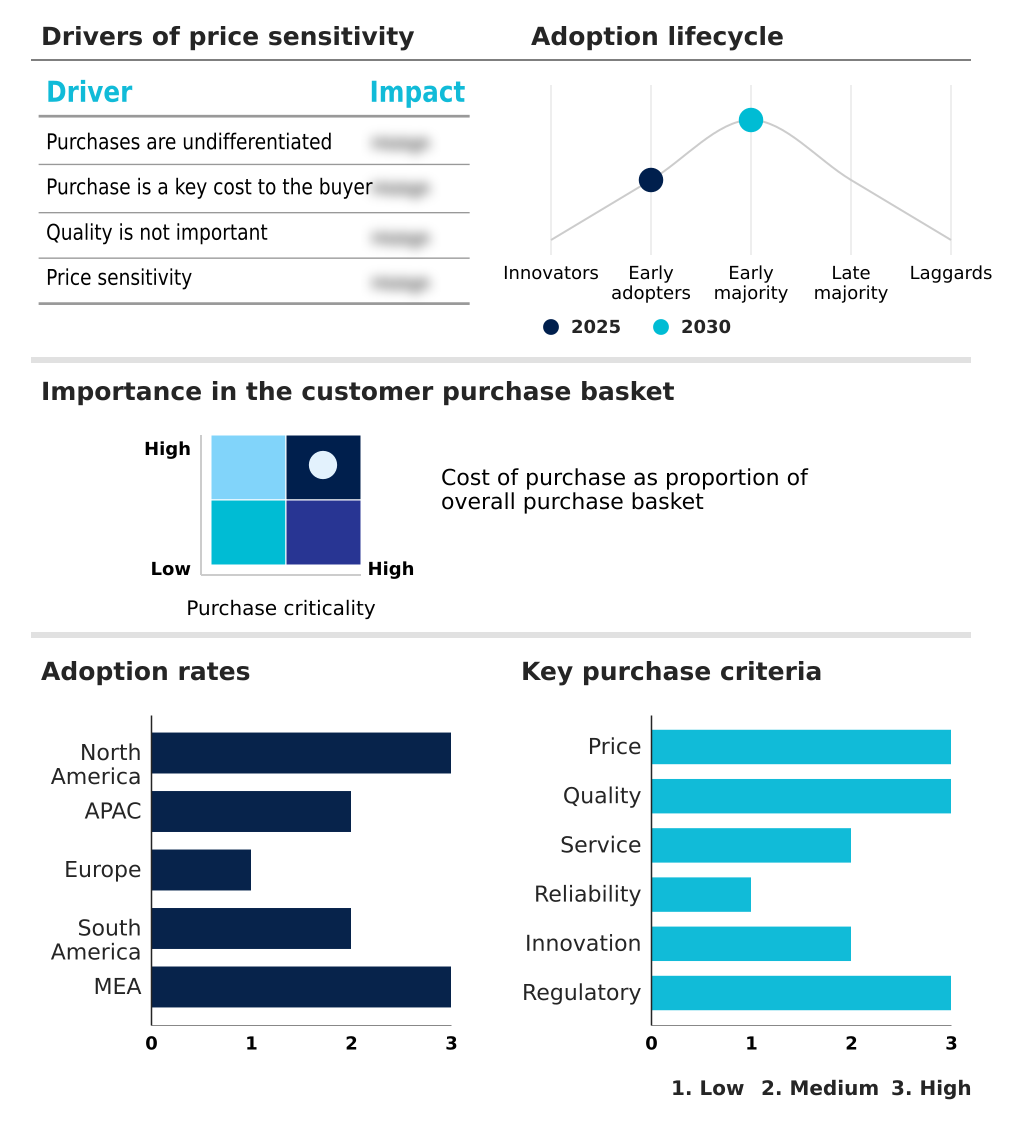
Exclusive Technavio Analysis on Customer Landscape

The vision processing unit market forecasting report includes the adoption lifecycle of the market, covering from the innovator’s stage to the laggard’s stage. It focuses on adoption rates in different regions based on penetration. Furthermore, the vision processing unit market report also includes key purchase criteria and drivers of price sensitivity to help companies evaluate and develop their market growth analysis strategies.

Customer Landscape of Vision Processing Unit Industry

Competitive Landscape

Companies are implementing various strategies, such as strategic alliances, vision processing unit market forecast, partnerships, mergers and acquisitions, geographical expansion, and product/service launches, to enhance their presence in the industry.

Ambarella Inc. - Specialized Tensilica vision DSP and AI processors are architected for demanding embedded vision and AI workloads, delivering high performance with low power consumption.

The industry research and growth report includes detailed analyses of the competitive landscape of the market and information about key companies, including:

  • Ambarella Inc.
  • Cadence Design Systems Inc.
  • CEVA Inc.
  • Hailo Technologies Ltd.
  • HiSilicon
  • Imagination Technologies Ltd.
  • Intel Corp.
  • Inuitive Ltd.
  • Lattice Semiconductor Corp.
  • MediaTek Inc.
  • NXP Semiconductors NV
  • Qualcomm Inc.
  • Renesas Electronics Corp.
  • Rockchip Electronics Co. Ltd.
  • Samsung Electronics Co. Ltd.
  • Socionext Inc.
  • STMicroelectronics NV
  • Synopsys Inc.
  • Texas Instruments Inc.
  • VeriSilicon Microelectronics Co.

Qualitative and quantitative analysis of companies has been conducted to help clients understand the wider business environment as well as the strengths and weaknesses of key industry players. Data is qualitatively analyzed to categorize companies as pure play, category-focused, industry-focused, and diversified; it is quantitatively analyzed to categorize companies as dominant, leading, strong, tentative, and weak.

Recent Development and News in Vision processing unit market

  • In October 2024, Ambarella Inc. launched its CV72S family of SoCs, which combine advanced image processing with a powerful AI engine, enabling 4K multi-imager designs for in-vehicle fleet telematics with a 30% reduction in power consumption.
  • In January 2025, Qualcomm Inc. announced a strategic collaboration with a leading automotive OEM to integrate its Snapdragon Ride Vision System into their next-generation advanced driver assistance systems platforms, targeting a 2027 vehicle launch.
  • In March 2025, CEVA Inc. demonstrated its NeuPro-M NPU, achieving a processing efficiency of over 20 tera operations per second per watt (TOPS/W) for generative AI workloads on edge devices.
  • In May 2025, Intel Corp. acquired a specialized vision AI software startup to enhance its OpenVINO toolkit, aiming to streamline the deployment of complex computer vision models on its VPU hardware.

Dive into Technavio’s robust research methodology, blending expert interviews, extensive data synthesis, and validated models for unparalleled Vision Processing Unit Market insights. See full methodology.

Market Scope
Page number 311
Base year 2025
Historic period 2020-2024
Forecast period 2026-2030
Growth momentum & CAGR Accelerate at a CAGR of 17.6%
Market growth 2026-2030 USD 2520.1 million
Market structure Fragmented
YoY growth 2025-2026(%) 15.9%
Key countries US, Canada, Mexico, China, Japan, India, South Korea, Australia, Indonesia, Germany, UK, France, Italy, Spain, The Netherlands, Brazil, Argentina, Chile, Saudi Arabia, UAE, South Africa, Israel and Turkey
Competitive landscape Leading Companies, Market Positioning of Companies, Competitive Strategies, and Industry Risks

Request Free Sample

Research Analyst Overview

  • The global vision processing unit market 2026-2030 is defined by a strategic shift toward specialized silicon designed for high-fidelity visual processing and complex AI workloads. The integration of neural network accelerators and AI vision chipsets into system-on-chip architectures is standard, providing the parallel processing power required for tasks like real-time object detection and semantic segmentation.
  • Key applications driving innovation include automotive-grade vision processors for advanced driver assistance systems, low-power vision chips for drones utilizing multispectral imagery, and the use of a smart industrial camera for automated optical inspection. The rise of spatial computing and augmented reality head-up displays is pushing the boundaries of what is possible.
  • For instance, new embedded AI accelerator designs have demonstrated a 40% reduction in processing time for deep learning inference, directly impacting product strategy in consumer electronics. This trend compels businesses to prioritize hardware-level optimization, from foveated rendering in VR to the management of collaborative robots and the functionality of the image signal processor, to maintain a competitive edge.

What are the Key Data Covered in this Vision Processing Unit Market Research and Growth Report?

  • What is the expected growth of the Vision Processing Unit Market between 2026 and 2030?

    • USD 2.52 billion, at a CAGR of 17.6%

  • What segmentation does the market report cover?

    • The report is segmented by Application (Consumer electronic, Automotive, Industrial, and Others), Technology (Deep learning, Machine learning, Computer vision, and Image processing), Type (Embedded vision processing units, PC-based vision processing units, and Networked vision processing units) and Geography (North America, APAC, Europe, South America, Middle East and Africa)

  • Which regions are analyzed in the report?

    • North America, APAC, Europe, South America and Middle East and Africa

  • What are the key growth drivers and market challenges?

    • Growing adoption of deep learning and AI, High cost of VPUs

  • Who are the major players in the Vision Processing Unit Market?

    • Ambarella Inc., Cadence Design Systems Inc., CEVA Inc., Hailo Technologies Ltd., HiSilicon, Imagination Technologies Ltd., Intel Corp., Inuitive Ltd., Lattice Semiconductor Corp., MediaTek Inc., NXP Semiconductors NV, Qualcomm Inc., Renesas Electronics Corp., Rockchip Electronics Co. Ltd., Samsung Electronics Co. Ltd., Socionext Inc., STMicroelectronics NV, Synopsys Inc., Texas Instruments Inc. and VeriSilicon Microelectronics Co.

Market Research Insights

  • The vision processing unit market is evolving through the integration of advanced hardware into diverse, high-performance computing tasks. This evolution is enabling significant operational gains, with some vision-based applications in manufacturing achieving a 99% defect detection accuracy. The demand for intelligent visual hardware is driven by the need for real-time analysis in sectors like automotive and consumer electronics.
  • Adoption of this vision acceleration hardware has led to a 40% reduction in latency for critical advanced visual analytics. Furthermore, specialized processors designed for specific AI edge processing solutions are delivering performance improvements that are over 10 times greater than traditional CPUs for certain deep-learning performance benchmarks.
  • This progress underscores a strategic shift toward dedicated hardware to manage complex visual workloads efficiently.

We can help! Our analysts can customize this vision processing unit market research report to meet your requirements.

Get in touch

1. Executive Summary

1.1 Market overview

Executive Summary - Chart on Market Overview
Executive Summary - Data Table on Market Overview
Executive Summary - Chart on Global Market Characteristics
Executive Summary - Chart on Market by Geography
Executive Summary - Chart on Market Segmentation by Application
Executive Summary - Chart on Market Segmentation by Technology
Executive Summary - Chart on Market Segmentation by Type
Executive Summary - Chart on Incremental Growth
Executive Summary - Data Table on Incremental Growth
Executive Summary - Chart on Company Market Positioning

2. Technavio Analysis

2.1 Analysis of price sensitivity, lifecycle, customer purchase basket, adoption rates, and purchase criteria

2.2 Criticality of inputs and Factors of differentiation

Chart on Overview on criticality of inputs and factors of differentiation

2.3 Factors of disruption

Chart on Overview on factors of disruption

2.4 Impact of drivers and challenges

Chart on Impact of drivers and challenges in 2025 and 2030

3. Market Landscape

3.1 Market ecosystem

Chart on Parent Market
Data Table on - Parent Market

3.2 Market characteristics

Chart on Market characteristics analysis

3.3 Value chain analysis

Chart on Value chain analysis

4. Market Sizing

4.1 Market definition

Data Table on Offerings of companies included in the market definition

4.2 Market segment analysis

Market segments

4.3 Market size 2025

4.4 Market outlook: Forecast for 2025-2030

Chart on Global - Market size and forecast 2025-2030 ($ million)
Data Table on Global - Market size and forecast 2025-2030 ($ million)
Chart on Global Market: Year-over-year growth 2025-2030 (%)
Data Table on Global Market: Year-over-year growth 2025-2030 (%)

5. Historic Market Size

5.1 Global Vision Processing Unit Market 2020 - 2024

Historic Market Size - Data Table on Global Vision Processing Unit Market 2020 - 2024 ($ million)

5.2 Application segment analysis 2020 - 2024

Historic Market Size - Application Segment 2020 - 2024 ($ million)

5.3 Technology segment analysis 2020 - 2024

Historic Market Size - Technology Segment 2020 - 2024 ($ million)

5.4 Type segment analysis 2020 - 2024

Historic Market Size - Type Segment 2020 - 2024 ($ million)

5.5 Geography segment analysis 2020 - 2024

Historic Market Size - Geography Segment 2020 - 2024 ($ million)

5.6 Country segment analysis 2020 - 2024

Historic Market Size - Country Segment 2020 - 2024 ($ million)

6. Qualitative Analysis

6.1 Impact of AI on Global Vision Processing Unit Market

6.2 Impact of Geopolitical Conflicts on Global Vision Processing Unit Market

7. Five Forces Analysis

7.1 Five forces summary

Five forces analysis - Comparison between 2025 and 2030

7.2 Bargaining power of buyers

Bargaining power of buyers - Impact of key factors 2025 and 2030

7.3 Bargaining power of suppliers

Bargaining power of suppliers - Impact of key factors in 2025 and 2030

7.4 Threat of new entrants

Threat of new entrants - Impact of key factors in 2025 and 2030

7.5 Threat of substitutes

Threat of substitutes - Impact of key factors in 2025 and 2030

7.6 Threat of rivalry

Threat of rivalry - Impact of key factors in 2025 and 2030

7.7 Market condition

Chart on Market condition - Five forces 2025 and 2030

8. Market Segmentation by Application

8.1 Market segments

Chart on Application - Market share 2025-2030 (%)
Data Table on Application - Market share 2025-2030 (%)

8.2 Comparison by Application

Chart on Comparison by Application
Data Table on Comparison by Application

8.3 Consumer electronic - Market size and forecast 2025-2030

Chart on Consumer electronic - Market size and forecast 2025-2030 ($ million)
Data Table on Consumer electronic - Market size and forecast 2025-2030 ($ million)
Chart on Consumer electronic - Year-over-year growth 2025-2030 (%)
Data Table on Consumer electronic - Year-over-year growth 2025-2030 (%)

8.4 Automotive - Market size and forecast 2025-2030

Chart on Automotive - Market size and forecast 2025-2030 ($ million)
Data Table on Automotive - Market size and forecast 2025-2030 ($ million)
Chart on Automotive - Year-over-year growth 2025-2030 (%)
Data Table on Automotive - Year-over-year growth 2025-2030 (%)

8.5 Industrial - Market size and forecast 2025-2030

Chart on Industrial - Market size and forecast 2025-2030 ($ million)
Data Table on Industrial - Market size and forecast 2025-2030 ($ million)
Chart on Industrial - Year-over-year growth 2025-2030 (%)
Data Table on Industrial - Year-over-year growth 2025-2030 (%)

8.6 Others - Market size and forecast 2025-2030

Chart on Others - Market size and forecast 2025-2030 ($ million)
Data Table on Others - Market size and forecast 2025-2030 ($ million)
Chart on Others - Year-over-year growth 2025-2030 (%)
Data Table on Others - Year-over-year growth 2025-2030 (%)

8.7 Market opportunity by Application

Market opportunity by Application ($ million)
Data Table on Market opportunity by Application ($ million)

9. Market Segmentation by Technology

9.1 Market segments

Chart on Technology - Market share 2025-2030 (%)
Data Table on Technology - Market share 2025-2030 (%)

9.2 Comparison by Technology

Chart on Comparison by Technology
Data Table on Comparison by Technology

9.3 Deep learning - Market size and forecast 2025-2030

Chart on Deep learning - Market size and forecast 2025-2030 ($ million)
Data Table on Deep learning - Market size and forecast 2025-2030 ($ million)
Chart on Deep learning - Year-over-year growth 2025-2030 (%)
Data Table on Deep learning - Year-over-year growth 2025-2030 (%)

9.4 Machine learning - Market size and forecast 2025-2030

Chart on Machine learning - Market size and forecast 2025-2030 ($ million)
Data Table on Machine learning - Market size and forecast 2025-2030 ($ million)
Chart on Machine learning - Year-over-year growth 2025-2030 (%)
Data Table on Machine learning - Year-over-year growth 2025-2030 (%)

9.5 Computer vision - Market size and forecast 2025-2030

Chart on Computer vision - Market size and forecast 2025-2030 ($ million)
Data Table on Computer vision - Market size and forecast 2025-2030 ($ million)
Chart on Computer vision - Year-over-year growth 2025-2030 (%)
Data Table on Computer vision - Year-over-year growth 2025-2030 (%)

9.6 Image processing - Market size and forecast 2025-2030

Chart on Image processing - Market size and forecast 2025-2030 ($ million)
Data Table on Image processing - Market size and forecast 2025-2030 ($ million)
Chart on Image processing - Year-over-year growth 2025-2030 (%)
Data Table on Image processing - Year-over-year growth 2025-2030 (%)

9.7 Market opportunity by Technology

Market opportunity by Technology ($ million)
Data Table on Market opportunity by Technology ($ million)

10. Market Segmentation by Type

10.1 Market segments

Chart on Type - Market share 2025-2030 (%)
Data Table on Type - Market share 2025-2030 (%)

10.2 Comparison by Type

Chart on Comparison by Type
Data Table on Comparison by Type

10.3 Embedded vision processing units - Market size and forecast 2025-2030

Chart on Embedded vision processing units - Market size and forecast 2025-2030 ($ million)
Data Table on Embedded vision processing units - Market size and forecast 2025-2030 ($ million)
Chart on Embedded vision processing units - Year-over-year growth 2025-2030 (%)
Data Table on Embedded vision processing units - Year-over-year growth 2025-2030 (%)

10.4 PC-based vision processing units - Market size and forecast 2025-2030

Chart on PC-based vision processing units - Market size and forecast 2025-2030 ($ million)
Data Table on PC-based vision processing units - Market size and forecast 2025-2030 ($ million)
Chart on PC-based vision processing units - Year-over-year growth 2025-2030 (%)
Data Table on PC-based vision processing units - Year-over-year growth 2025-2030 (%)

10.5 Networked vision processing units - Market size and forecast 2025-2030

Chart on Networked vision processing units - Market size and forecast 2025-2030 ($ million)
Data Table on Networked vision processing units - Market size and forecast 2025-2030 ($ million)
Chart on Networked vision processing units - Year-over-year growth 2025-2030 (%)
Data Table on Networked vision processing units - Year-over-year growth 2025-2030 (%)

10.6 Market opportunity by Type

Market opportunity by Type ($ million)
Data Table on Market opportunity by Type ($ million)

11. Customer Landscape

11.1 Customer landscape overview

Analysis of price sensitivity, lifecycle, customer purchase basket, adoption rates, and purchase criteria

12. Geographic Landscape

12.1 Geographic segmentation

Chart on Market share by geography 2025-2030 (%)
Data Table on Market share by geography 2025-2030 (%)

12.2 Geographic comparison

Chart on Geographic comparison
Data Table on Geographic comparison

12.3 North America - Market size and forecast 2025-2030

Chart on North America - Market size and forecast 2025-2030 ($ million)
Data Table on North America - Market size and forecast 2025-2030 ($ million)
Chart on North America - Year-over-year growth 2025-2030 (%)
Data Table on North America - Year-over-year growth 2025-2030 (%)
Chart on Regional Comparison - North America
Data Table on Regional Comparison - North America

12.3.1 US - Market size and forecast 2025-2030

Chart on US - Market size and forecast 2025-2030 ($ million)
Data Table on US - Market size and forecast 2025-2030 ($ million)
Chart on US - Year-over-year growth 2025-2030 (%)
Data Table on US - Year-over-year growth 2025-2030 (%)

12.3.2 Canada - Market size and forecast 2025-2030

Chart on Canada - Market size and forecast 2025-2030 ($ million)
Data Table on Canada - Market size and forecast 2025-2030 ($ million)
Chart on Canada - Year-over-year growth 2025-2030 (%)
Data Table on Canada - Year-over-year growth 2025-2030 (%)

12.3.3 Mexico - Market size and forecast 2025-2030

Chart on Mexico - Market size and forecast 2025-2030 ($ million)
Data Table on Mexico - Market size and forecast 2025-2030 ($ million)
Chart on Mexico - Year-over-year growth 2025-2030 (%)
Data Table on Mexico - Year-over-year growth 2025-2030 (%)

12.4 APAC - Market size and forecast 2025-2030

Chart on APAC - Market size and forecast 2025-2030 ($ million)
Data Table on APAC - Market size and forecast 2025-2030 ($ million)
Chart on APAC - Year-over-year growth 2025-2030 (%)
Data Table on APAC - Year-over-year growth 2025-2030 (%)
Chart on Regional Comparison - APAC
Data Table on Regional Comparison - APAC

12.4.1 China - Market size and forecast 2025-2030

Chart on China - Market size and forecast 2025-2030 ($ million)
Data Table on China - Market size and forecast 2025-2030 ($ million)
Chart on China - Year-over-year growth 2025-2030 (%)
Data Table on China - Year-over-year growth 2025-2030 (%)

12.4.2 Japan - Market size and forecast 2025-2030

Chart on Japan - Market size and forecast 2025-2030 ($ million)
Data Table on Japan - Market size and forecast 2025-2030 ($ million)
Chart on Japan - Year-over-year growth 2025-2030 (%)
Data Table on Japan - Year-over-year growth 2025-2030 (%)

12.4.3 India - Market size and forecast 2025-2030

Chart on India - Market size and forecast 2025-2030 ($ million)
Data Table on India - Market size and forecast 2025-2030 ($ million)
Chart on India - Year-over-year growth 2025-2030 (%)
Data Table on India - Year-over-year growth 2025-2030 (%)

12.4.4 South Korea - Market size and forecast 2025-2030

Chart on South Korea - Market size and forecast 2025-2030 ($ million)
Data Table on South Korea - Market size and forecast 2025-2030 ($ million)
Chart on South Korea - Year-over-year growth 2025-2030 (%)
Data Table on South Korea - Year-over-year growth 2025-2030 (%)

12.4.5 Australia - Market size and forecast 2025-2030

Chart on Australia - Market size and forecast 2025-2030 ($ million)
Data Table on Australia - Market size and forecast 2025-2030 ($ million)
Chart on Australia - Year-over-year growth 2025-2030 (%)
Data Table on Australia - Year-over-year growth 2025-2030 (%)

12.4.6 Indonesia - Market size and forecast 2025-2030

Chart on Indonesia - Market size and forecast 2025-2030 ($ million)
Data Table on Indonesia - Market size and forecast 2025-2030 ($ million)
Chart on Indonesia - Year-over-year growth 2025-2030 (%)
Data Table on Indonesia - Year-over-year growth 2025-2030 (%)

12.5 Europe - Market size and forecast 2025-2030

Chart on Europe - Market size and forecast 2025-2030 ($ million)
Data Table on Europe - Market size and forecast 2025-2030 ($ million)
Chart on Europe - Year-over-year growth 2025-2030 (%)
Data Table on Europe - Year-over-year growth 2025-2030 (%)
Chart on Regional Comparison - Europe
Data Table on Regional Comparison - Europe

12.5.1 Germany - Market size and forecast 2025-2030

Chart on Germany - Market size and forecast 2025-2030 ($ million)
Data Table on Germany - Market size and forecast 2025-2030 ($ million)
Chart on Germany - Year-over-year growth 2025-2030 (%)
Data Table on Germany - Year-over-year growth 2025-2030 (%)

12.5.2 UK - Market size and forecast 2025-2030

Chart on UK - Market size and forecast 2025-2030 ($ million)
Data Table on UK - Market size and forecast 2025-2030 ($ million)
Chart on UK - Year-over-year growth 2025-2030 (%)
Data Table on UK - Year-over-year growth 2025-2030 (%)

12.5.3 France - Market size and forecast 2025-2030

Chart on France - Market size and forecast 2025-2030 ($ million)
Data Table on France - Market size and forecast 2025-2030 ($ million)
Chart on France - Year-over-year growth 2025-2030 (%)
Data Table on France - Year-over-year growth 2025-2030 (%)

12.5.4 Italy - Market size and forecast 2025-2030

Chart on Italy - Market size and forecast 2025-2030 ($ million)
Data Table on Italy - Market size and forecast 2025-2030 ($ million)
Chart on Italy - Year-over-year growth 2025-2030 (%)
Data Table on Italy - Year-over-year growth 2025-2030 (%)

12.5.5 Spain - Market size and forecast 2025-2030

Chart on Spain - Market size and forecast 2025-2030 ($ million)
Data Table on Spain - Market size and forecast 2025-2030 ($ million)
Chart on Spain - Year-over-year growth 2025-2030 (%)
Data Table on Spain - Year-over-year growth 2025-2030 (%)

12.5.6 The Netherlands - Market size and forecast 2025-2030

Chart on The Netherlands - Market size and forecast 2025-2030 ($ million)
Data Table on The Netherlands - Market size and forecast 2025-2030 ($ million)
Chart on The Netherlands - Year-over-year growth 2025-2030 (%)
Data Table on The Netherlands - Year-over-year growth 2025-2030 (%)

12.6 South America - Market size and forecast 2025-2030

Chart on South America - Market size and forecast 2025-2030 ($ million)
Data Table on South America - Market size and forecast 2025-2030 ($ million)
Chart on South America - Year-over-year growth 2025-2030 (%)
Data Table on South America - Year-over-year growth 2025-2030 (%)
Chart on Regional Comparison - South America
Data Table on Regional Comparison - South America

12.6.1 Brazil - Market size and forecast 2025-2030

Chart on Brazil - Market size and forecast 2025-2030 ($ million)
Data Table on Brazil - Market size and forecast 2025-2030 ($ million)
Chart on Brazil - Year-over-year growth 2025-2030 (%)
Data Table on Brazil - Year-over-year growth 2025-2030 (%)

12.6.2 Argentina - Market size and forecast 2025-2030

Chart on Argentina - Market size and forecast 2025-2030 ($ million)
Data Table on Argentina - Market size and forecast 2025-2030 ($ million)
Chart on Argentina - Year-over-year growth 2025-2030 (%)
Data Table on Argentina - Year-over-year growth 2025-2030 (%)

12.6.3 Chile - Market size and forecast 2025-2030

Chart on Chile - Market size and forecast 2025-2030 ($ million)
Data Table on Chile - Market size and forecast 2025-2030 ($ million)
Chart on Chile - Year-over-year growth 2025-2030 (%)
Data Table on Chile - Year-over-year growth 2025-2030 (%)

12.7 Middle East and Africa - Market size and forecast 2025-2030

Chart on Middle East and Africa - Market size and forecast 2025-2030 ($ million)
Data Table on Middle East and Africa - Market size and forecast 2025-2030 ($ million)
Chart on Middle East and Africa - Year-over-year growth 2025-2030 (%)
Data Table on Middle East and Africa - Year-over-year growth 2025-2030 (%)
Chart on Regional Comparison - Middle East and Africa
Data Table on Regional Comparison - Middle East and Africa

12.7.1 Saudi Arabia - Market size and forecast 2025-2030

Chart on Saudi Arabia - Market size and forecast 2025-2030 ($ million)
Data Table on Saudi Arabia - Market size and forecast 2025-2030 ($ million)
Chart on Saudi Arabia - Year-over-year growth 2025-2030 (%)
Data Table on Saudi Arabia - Year-over-year growth 2025-2030 (%)

12.7.2 UAE - Market size and forecast 2025-2030

Chart on UAE - Market size and forecast 2025-2030 ($ million)
Data Table on UAE - Market size and forecast 2025-2030 ($ million)
Chart on UAE - Year-over-year growth 2025-2030 (%)
Data Table on UAE - Year-over-year growth 2025-2030 (%)

12.7.3 South Africa - Market size and forecast 2025-2030

Chart on South Africa - Market size and forecast 2025-2030 ($ million)
Data Table on South Africa - Market size and forecast 2025-2030 ($ million)
Chart on South Africa - Year-over-year growth 2025-2030 (%)
Data Table on South Africa - Year-over-year growth 2025-2030 (%)

12.7.4 Israel - Market size and forecast 2025-2030

Chart on Israel - Market size and forecast 2025-2030 ($ million)
Data Table on Israel - Market size and forecast 2025-2030 ($ million)
Chart on Israel - Year-over-year growth 2025-2030 (%)
Data Table on Israel - Year-over-year growth 2025-2030 (%)

12.7.5 Turkey - Market size and forecast 2025-2030

Chart on Turkey - Market size and forecast 2025-2030 ($ million)
Data Table on Turkey - Market size and forecast 2025-2030 ($ million)
Chart on Turkey - Year-over-year growth 2025-2030 (%)
Data Table on Turkey - Year-over-year growth 2025-2030 (%)

12.8 Market opportunity by geography

Market opportunity by geography ($ million)
Data Tables on Market opportunity by geography ($ million)

13. Drivers, Challenges, and Opportunity

13.1 Market drivers

Growing adoption of deep learning and AI
Increasing application of VR
Rising investments in AI technology for autonomous vehicles

13.2 Market challenges

High cost of VPUs
Complexity of IC design and reduction in board space
Limited availability of buyer group

13.3 Impact of drivers and challenges

Impact of drivers and challenges in 2025 and 2030

13.4 Market opportunities

Rapid adoption of drones
Development of virtual theme parks
Growth of IIoT

14. Competitive Landscape

14.1 Overview

14.2

Overview on criticality of inputs and factors of differentiation

14.3 Landscape disruption

Overview on factors of disruption

14.4 Industry risks

Impact of key risks on business

15. Competitive Analysis

15.1 Companies profiled

Companies covered

15.2 Company ranking index

15.3 Market positioning of companies

Matrix on companies position and classification

15.4 Cadence Design Systems Inc.

Cadence Design Systems Inc. - Overview
Cadence Design Systems Inc. - Business segments
Cadence Design Systems Inc. - Key news
Cadence Design Systems Inc. - Key offerings
Cadence Design Systems Inc. - Segment focus
SWOT

15.5 CEVA Inc.

CEVA Inc. - Overview
CEVA Inc. - Product / Service
CEVA Inc. - Key offerings
SWOT

15.6 Intel Corp.

Intel Corp. - Overview
Intel Corp. - Business segments
Intel Corp. - Key news
Intel Corp. - Key offerings
Intel Corp. - Segment focus
SWOT

15.7 Lattice Semiconductor Corp.

Lattice Semiconductor Corp. - Overview
Lattice Semiconductor Corp. - Product / Service
Lattice Semiconductor Corp. - Key offerings
SWOT

15.8 MediaTek Inc.

MediaTek Inc. - Overview
MediaTek Inc. - Business segments
MediaTek Inc. - Key news
MediaTek Inc. - Key offerings
MediaTek Inc. - Segment focus
SWOT

15.9 NXP Semiconductors NV

NXP Semiconductors NV - Overview
NXP Semiconductors NV - Business segments
NXP Semiconductors NV - Key news
NXP Semiconductors NV - Key offerings
NXP Semiconductors NV - Segment focus
SWOT

15.10 Qualcomm Inc.

Qualcomm Inc. - Overview
Qualcomm Inc. - Business segments
Qualcomm Inc. - Key news
Qualcomm Inc. - Key offerings
Qualcomm Inc. - Segment focus
SWOT

15.11 Renesas Electronics Corp.

Renesas Electronics Corp. - Overview
Renesas Electronics Corp. - Business segments
Renesas Electronics Corp. - Key news
Renesas Electronics Corp. - Key offerings
Renesas Electronics Corp. - Segment focus
SWOT

15.12 Rockchip Electronics Co. Ltd.

Rockchip Electronics Co. Ltd. - Overview
Rockchip Electronics Co. Ltd. - Product / Service
Rockchip Electronics Co. Ltd. - Key offerings
SWOT

15.13 Samsung Electronics Co. Ltd.

Samsung Electronics Co. Ltd. - Overview
Samsung Electronics Co. Ltd. - Business segments
Samsung Electronics Co. Ltd. - Key news
Samsung Electronics Co. Ltd. - Key offerings
Samsung Electronics Co. Ltd. - Segment focus
SWOT

15.14 Socionext Inc.

Socionext Inc. - Overview
Socionext Inc. - Product / Service
Socionext Inc. - Key offerings
SWOT

15.15 STMicroelectronics NV

STMicroelectronics NV - Overview
STMicroelectronics NV - Business segments
STMicroelectronics NV - Key offerings
STMicroelectronics NV - Segment focus
SWOT

15.16 Synopsys Inc.

Synopsys Inc. - Overview
Synopsys Inc. - Business segments
Synopsys Inc. - Key news
Synopsys Inc. - Key offerings
Synopsys Inc. - Segment focus
SWOT

15.17 Texas Instruments Inc.

Texas Instruments Inc. - Overview
Texas Instruments Inc. - Business segments
Texas Instruments Inc. - Key offerings
Texas Instruments Inc. - Segment focus
SWOT

15.18 VeriSilicon Microelectronics Co.

VeriSilicon Microelectronics Co. - Overview
VeriSilicon Microelectronics Co. - Business segments
VeriSilicon Microelectronics Co. - Key offerings
VeriSilicon Microelectronics Co. - Segment focus
SWOT

16. Appendix

16.1 Scope of the report

Market definition
Objectives
Notes and caveats

16.2 Inclusions and exclusions checklist

Inclusions checklist
Exclusions checklist

16.3 Currency conversion rates for US$

16.4 Research methodology

16.5 Data procurement

Information sources

16.6 Data validation

16.7 Validation techniques employed for market sizing

16.8 Data synthesis

16.9 360 degree market analysis

16.10 List of abbreviations

Research Methodology

Technavio presents a detailed picture of the market by way of study, synthesis, and summation of data from multiple sources. The analysts have presented the various facets of the market with a particular focus on identifying the key industry influencers. The data thus presented is comprehensive, reliable, and the result of extensive research, both primary and secondary.

INFORMATION SOURCES

Primary sources

  • Manufacturers and suppliers
  • Channel partners
  • Industry experts
  • Strategic decision makers

Secondary sources

  • Industry journals and periodicals
  • Government data
  • Financial reports of key industry players
  • Historical data
  • Press releases

DATA ANALYSIS

Data Synthesis

  • Collation of data
  • Estimation of key figures
  • Analysis of derived insights

Data Validation

  • Triangulation with data models
  • Reference against proprietary databases
  • Corroboration with industry experts

REPORT WRITING

Qualitative

  • Market drivers
  • Market challenges
  • Market trends
  • Five forces analysis

Quantitative

  • Market size and forecast
  • Market segmentation
  • Geographical insights
  • Competitive landscape

Interested in this report?

Get your sample now to see our research methodology and insights!

Download Now

Frequently Asked Questions

Vision Processing Unit market growth will increase by USD 2520.1 million during 2026-2030.

The Vision Processing Unit market is expected to grow at a CAGR of 17.6% during 2026-2030.

Vision Processing Unit market is segmented by Application (Consumer electronic, Automotive, Industrial, Others) Technology (Deep learning, Machine learning, Computer vision, Image processing) Type (Embedded vision processing units, PC-based vision processing units, Networked vision processing units)

Ambarella Inc., Cadence Design Systems Inc., CEVA Inc., Hailo Technologies Ltd., HiSilicon, Imagination Technologies Ltd., Intel Corp., Inuitive Ltd., Lattice Semiconductor Corp., MediaTek Inc., NXP Semiconductors NV, Qualcomm Inc., Renesas Electronics Corp., Rockchip Electronics Co. Ltd., Samsung Electronics Co. Ltd., Socionext Inc., STMicroelectronics NV, Synopsys Inc., Texas Instruments Inc., VeriSilicon Microelectronics Co. are a few of the key vendors in the Vision Processing Unit market.

North America will register the highest growth rate of 34.8% among the other regions. Therefore, the Vision Processing Unit market in North America is expected to garner significant business opportunities for the vendors during the forecast period.

US, Canada, Mexico, China, Japan, India, South Korea, Australia, Indonesia, Germany, UK, France, Italy, Spain, The Netherlands, Brazil, Argentina, Chile, Saudi Arabia, UAE, South Africa, Israel, Turkey

  • Growing adoption of deep learning and AI is the driving factor this market.

The Vision Processing Unit market vendors should focus on grabbing business opportunities from the Application segment as it accounted for the largest market share in the base year.
RIA - Research AI Assistant
Ask RIA