Video Game Market Analysis, Size, and Forecast 2025-2029: North America (US and Canada), Europe (France, Germany, Italy, and UK), Middle East and Africa (Egypt, KSA, Oman, and UAE), APAC (China, India, and Japan), South America (Argentina and Brazil), and Rest of World (ROW)

Video Game Market Analysis, Size, and Forecast 2025-2029:
North America (US and Canada), Europe (France, Germany, Italy, and UK), Middle East and Africa (Egypt, KSA, Oman, and UAE), APAC (China, India, and Japan), South America (Argentina and Brazil), and Rest of World (ROW)

Published: Jan 2025 202 Pages SKU: IRTNTR73571

Market Overview at a Glance

$111.7 B
Market Opportunity
8.6%
CAGR
8.1
YoY growth 2024-2025(%)

Video Game Market Size 2025-2029

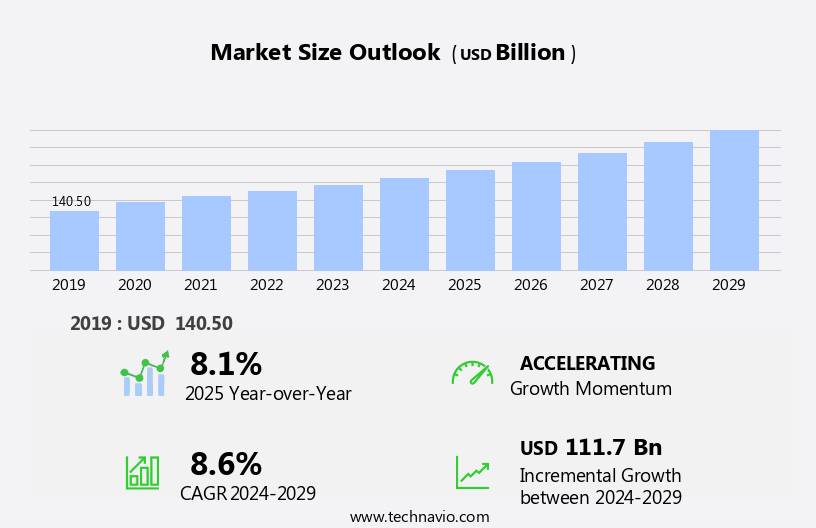
The video game market size is forecast to increase by USD 111.7 billion, at a CAGR of 8.6% between 2024 and 2029.

  • The market is experiencing significant growth, driven by the increasing penetration of smartphones and improving internet access worldwide. This digital transformation has expanded the gaming audience beyond traditional demographics, with an increasing number of women embracing gaming. However, the market faces a notable challenge that is the escalating cost of game development. To remain competitive, companies must continuously innovate and invest in advanced technologies, such as virtual reality and artificial intelligence, to create immersive gaming experiences.
  • Additionally, the growing demand for mobile games necessitates a focus on cross-platform compatibility and adaptive game design. Companies that successfully navigate these challenges and cater to the evolving needs of diverse gaming demographics will thrive in this dynamic market.

What will be the Size of the Video Game Market during the forecast period?

Video Game Market Size

Explore in-depth regional segment analysis with market size data - historical 2019-2023 and forecasts 2025-2029 - in the full report.  
Request Free Sample

The market continues to evolve, with dynamic market dynamics shaping various sectors. Simulation games, esports organizations, and AAA titles coexist, each presenting unique challenges and opportunities. Competitor analysis is crucial for game publishers seeking to optimize player engagement and revenue generation. Real-time strategy (RTS) games and monetization strategies, such as in-app purchases and subscription models, are key areas of focus. Game studios invest in intellectual property (IP) development, leveraging game engines like Unreal and Unity for game development and user interface (UI) design. Augmented reality (AR) and virtual reality (VR) technologies, along with cloud gaming, are transforming the gaming landscape.

Player retention is a top priority, with game updates, social media, and game streaming platforms playing essential roles. Game testing, network programming, and AI programming ensure optimal user experience (UX). Character modeling, fighting games, and puzzle games cater to diverse target audiences, while game design documents guide game development processes. PC gaming and console gaming continue to dominate, with mobile devices expanding the market reach. Game physics, sound design, and level design are integral components of game development. Game marketing strategies, player communities, and online forums foster user engagement. Game localization and quality assurance (QA) processes ensure global accessibility and product excellence.

The continuous unfolding of market activities and evolving patterns underscore the dynamic nature of the video game industry.

How is this Video Game Industry segmented?

The video game industry research report provides comprehensive data (region-wise segment analysis), with forecasts and estimates in "USD billion" for the period 2025-2029, as well as historical data from 2019-2023 for the following segments.

  • Platform
    • PlayStation
    • Xbox
    • Nintendo
    • PC (Steam, Epic Games Store, etc.)
    • Mobile (iOS, Android)
  • Type
    • Offline
    • Online
  • End-User
    • Hardcore Gamers
    • Casual Gamers
    • Esports Enthusiasts
  • Revenue Model
    • Game Sales (Digital & Physical)
    • In-Game Purchases
    • Subscriptions
    • Advertising
  • Geography
    • North America
      • US
      • Canada
    • Europe
      • France
      • Germany
      • Italy
      • UK
    • Middle East and Africa
      • Egypt
      • KSA
      • Oman
      • UAE
    • APAC
      • China
      • India
      • Japan
    • South America
      • Argentina
      • Brazil
    • Rest of World (ROW)

By Platform Insights

The playstation segment is estimated to witness significant growth during the forecast period.

The market encompasses various segments, including sports games, data analytics, game engines, user interface (UI), game development, augmented reality (AR), game controllers, game testing,  game art, subscription models, and console gaming. In 2024, the mobile devices segment was the largest and continues to be the leading segment in the market, with over 3.5 billion smartphone and tablet users worldwide. Mobile games cater to a broader audience, including casual gamers, as they are typically smaller in scale and complexity and can be played in short bursts. The market's growth is driven by advancements in technology, increasing consumer demand, and the integration of social media and streaming platforms. Game development companies invest in AI programming, game physics, and game engines like Unreal Engine to create immersive and harmonious gaming experiences. They also focus on player engagement, player retention, and monetization strategies, including in-app purchases, subscription models, and advertising.

Game publishers collaborate with game studios to develop and release new titles, ensuring game balance, quality assurance, and localization for a global audience. AAA games and esports organizations attract professional gamers and large fan bases, generating significant revenue through sponsorships, merchandise sales, and media rights. Competitor analysis and game marketing are crucial for success in the market, with companies leveraging social media, online forums, and game design documents to reach their target audience and build strong game communities. In conclusion, The market is a dynamic and evolving industry, with various segments, trends, and players shaping its growth. From mobile gaming to console gaming, PC gaming, and esports, the market offers diverse opportunities for innovation and revenue generation.

Companies must stay informed about the latest developments and consumer preferences to remain competitive and succeed in this immersive and engaging industry.

Video Game Market Size

Request Free Sample

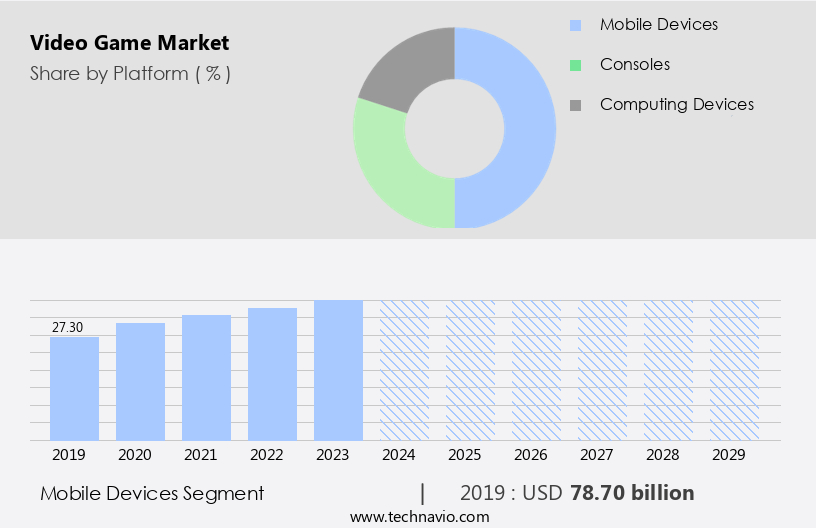
The PlayStation segment was valued at USD 78.70 billion in 2019 and showed a gradual increase during the forecast period.

Regional Analysis

APAC is estimated to contribute 54% to the growth of the global market during the forecast period.Technavio's analysts have elaborately explained the regional trends and drivers that shape the market during the forecast period.

Video Game Market Share by Geography

 Request Free Sample

The market is experiencing significant growth, particularly in the Asia Pacific (APAC) region. In 2024, China, South Korea, and Japan were the leading contributors to the APAC market's revenue, making it one of the largest and fastest-growing sectors globally. The popularity of online video games in Southeast Asia and the expansion of broadband connectivity have fueled the region's dominance in PC online gaming. The increasing use of smartphones and the growing internet penetration in countries like China, Thailand, Indonesia, and Vietnam are further expanding the market's potential. This trend is leading to an increase in mobile gaming, generating substantial revenue for the industry.

Game development continues to evolve, with advancements in game engines, user interface (UI), game physics, and augmented reality (AR). First-person shooters (FPS), racing games, role-playing games (RPGs), and real-time strategy (RTS) games remain popular genres. Cloud gaming and subscription models are gaining traction, offering players access to a vast library of games without the need for high-end hardware. Indie games and game studios are also making a mark, challenging the dominance of AAA games. Social media and streaming platforms are transforming the way games are marketed and consumed. Player engagement is a key focus, with in-app purchases, online forums, and game updates essential components of the user experience (UX).

Game testing, quality assurance (QA), and level design are crucial aspects of game development, ensuring a harmonious balance between game mechanics, player retention, and revenue generation. Intellectual property (IP) and game licensing are essential considerations for game publishers, while network programming and game consoles are foundational technologies. AI programming and player engagement are becoming increasingly important, with esports organizations and professional gamers driving competition and innovation. Virtual reality (VR) and character modeling are pushing the boundaries of immersive gaming experiences, while sound design and game art add depth and richness to the overall experience. Monetization strategies, such as free-to-play (F2P) and subscription models, are essential for game developers to generate revenue and sustain their businesses.

The market is a dynamic and ever-evolving industry, with continuous innovation and growth.

Market Dynamics

Our researchers analyzed the data with 2024 as the base year, along with the key drivers, trends, and challenges. A holistic analysis of drivers will help companies refine their marketing strategies to gain a competitive advantage.

The Global Video Game Market is thriving, driven by innovations like cloud gaming services and virtual reality games. The mobile gaming market continues to dominate, with 5G gaming connectivity enhancing experiences, especially in mobile gaming trends in Asia. Esports tournaments attract millions, while cross-platform gaming fosters seamless multiplayer interactions. Emerging technologies, such as artificial intelligence in gaming and AI-powered NPC behavior in games, elevate immersive storytelling. Blockchain in gaming and how NFTs are used in video games are reshaping ownership models. Gamers demand high-quality gaming peripherals, with guides like best gaming peripherals for PC and gaming console comparison 2025 gaining traction. Game streaming platforms and virtual reality gaming setup guide searches highlight evolving player preferences, positioning the market for exponential growth.

What are the key market drivers leading to the rise in the adoption of Video Game Industry?

  • The increasing prevalence of smartphones and enhanced internet connectivity serves as the primary catalyst for market growth. 
  • The market encompasses various genres, including sports games, with data analytics playing a pivotal role in enhancing user experience. Game engines and user interfaces are essential components of game development, enabling the creation of immersive and harmonious gaming experiences. Augmented reality technology and advanced game controllers have revolutionized the industry, providing innovative gaming solutions. Game testing ensures the quality of games before their release, while social media and game streaming platforms expand their reach. Game physics and network programming are critical elements for the development of first-person shooters and racing games.
  • Personal computers remain a significant platform for gaming, with cloud gaming offering accessibility and convenience. Game licensing is an essential aspect of the industry, ensuring intellectual property protection. The market dynamics are continually evolving, with the integration of technology and user preferences shaping its future.

What are the market trends shaping the Video Game Industry?

  • The growing interest in gaming among women represents a significant market trend. This demographic is increasingly engaging with the industry, presenting opportunities for businesses to cater to their unique needs and preferences.
  • The market in the US has experienced significant demographic shifts in recent years, with an increasing number of female gamers. According to the latest industry data, approximately 45% of American gamers are now female, a figure that is projected to grow. This trend is attributed to the popularity of mobile gaming and role-playing games (RPGs), which have attracted a larger female audience. Notable titles like League of Legends, Grand Theft Auto, and World of Warcraft have reported an increase in female players in the past two years. This demographic shift is expected to positively impact the sales of gaming merchandise, software, and hardware.
  • Moreover, the gaming industry's evolution is not limited to demographics. Game programming has seen advancements in AI programming, and streaming platforms have emerged as a popular distribution channel. Indie games have gained traction, and game design documents have become essential for effective game marketing. Unreal Engine and other advanced game development tools have made it easier for developers to create immersive and harmonious gaming experiences. In-app purchases and player retention are crucial aspects of game design, with online forums and community engagement playing a vital role in fostering a loyal player base. The market for adventure games, puzzle games, turn-based strategy, and casual games continues to grow, catering to diverse player preferences.
  • Overall, the market is a dynamic and evolving industry, with ongoing innovations in game design, technology, and player engagement.

What challenges does the Video Game Industry face during its growth?

  • The escalating costs of game development pose a significant challenge to the growth and expansion of the gaming industry. 
  • The market experiences continuous growth due to the increasing demand for immersive and harmonious gaming experiences. This trend is driven by the development of complex simulations games, real-time strategy (RTS), and fighting games, among others. Esports organizations and AAA games have become significant revenue generators, necessitating game publishers and game studios to invest heavily in game development. Game balance and user experience (UX) are critical factors in player engagement and revenue generation. Developers employ advanced tools like Speed Tree for automated tree creation and product modeling software for intricate custom graphics. The demand for high-quality character modeling and visual effects has led to increased manufacturing costs.
  • Monetization strategies, such as in-game purchases and subscriptions, have become essential for game publishers to recoup their investments in intellectual property (IP) and development costs. Competitor analysis is crucial for game developers to stay competitive and meet the evolving demands of players. Mobile devices have expanded the reach of gaming, making it accessible to a broader audience. In conclusion, the market is dynamic, with a focus on innovation, player engagement, and monetization strategies to generate revenue.

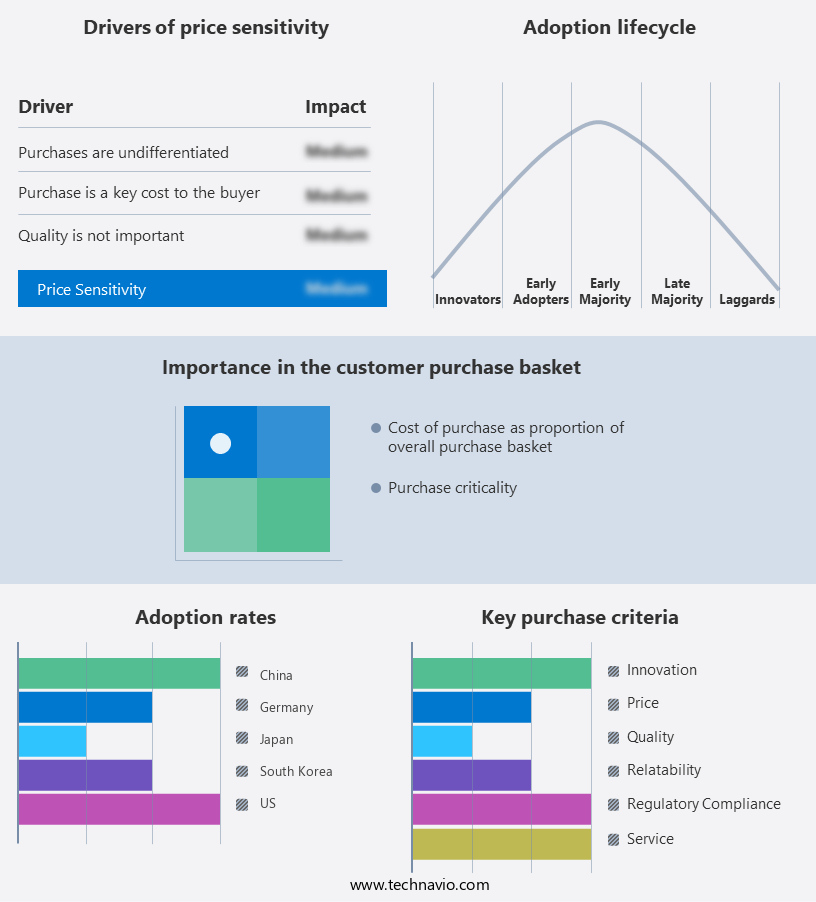
Exclusive Customer Landscape

The video game market forecasting report includes the adoption lifecycle of the market, covering from the innovator's stage to the laggard's stage. It focuses on adoption rates in different regions based on penetration. Furthermore, the video game market report also includes key purchase criteria and drivers of price sensitivity to help companies evaluate and develop their market growth analysis strategies.

Video Game Market Share by Geography

 Customer Landscape

Key Companies & Market Insights

Companies are implementing various strategies, such as strategic alliances, video game market forecast, partnerships, mergers and acquisitions, geographical expansion, and product/service launches, to enhance their presence in the industry.

Activision Blizzard - This company specializes in providing immersive digital entertainment through video games, including titles such as World of Warcraft and Diablo. 

The industry research and growth report includes detailed analyses of the competitive landscape of the market and information about key companies, including:

  • Activision Blizzard
  • Bandai Namco Holdings Inc.
  • Capcom Co., Ltd.
  • Electronic Arts Inc. (EA)
  • Epic Games, Inc.
  • Krafton, Inc.
  • Microsoft Corporation
  • MiHoYo Co., Ltd.
  • NetEase, Inc.
  • Nintendo Co., Ltd.
  • Roblox Corporation
  • Sega Sammy Holdings Inc.
  • Sony Group Corporation (PlayStation)
  • Square Enix Holdings Co., Ltd.
  • Take-Two Interactive Software, Inc.
  • Tencent Holdings Ltd.
  • Ubisoft Entertainment SA
  • Valve Corporation
  • Warner 1 Bros. Games (Warner Bros. Discovery)
  • Zynga Inc.

Qualitative and quantitative analysis of companies has been conducted to help clients understand the wider business environment as well as the strengths and weaknesses of key industry players. Data is qualitatively analyzed to categorize companies as pure play, category-focused, industry-focused, and diversified; it is quantitatively analyzed to categorize companies as dominant, leading, strong, tentative, and weak.

Recent Development and News in Video Game Market

  • In January 2024, Sony Interactive Entertainment and Microsoft Gaming announced a major collaboration, with Sony becoming Microsoft's strategic partner for bringing Microsoft's games to PlayStation consoles and subscribers of PlayStation Plus (Reuters). This marked a significant shift in the console gaming landscape, blurring the lines between competitors.
  • In March 2024, Tencent Holdings, the Chinese tech giant, made a strategic investment of USD1.5 billion in Activision Blizzard, the American video game company, increasing its stake to 17.5% (Bloomberg). This investment strengthened Tencent's position in the global gaming market and expanded its influence over popular franchises like Call of Duty and World of Warcraft.
  • In April 2025, Electronic Arts (EA) and Apple announced a multi-year partnership, with EA bringing its games to Apple Arcade, Apple's subscription-based gaming service (EA Press Release). This partnership marked a significant expansion for EA, making its games accessible to a wider audience through Apple's platform.
  • In May 2025, Nvidia, the technology company, launched its GeForce Now cloud gaming service in Europe, following its successful debut in the US (Nvidia Press Release). This expansion marked a significant milestone for Nvidia, as it aimed to compete with Google's Stadia and Microsoft's xCloud in the growing cloud gaming market.

Research Analyst Overview

  • In the dynamic market, various trends and technologies are shaping the industry's future. Cheating prevention measures, such as AI and machine learning, are increasingly important to maintain fair play and enhance the overall gaming experience. Therapeutic games, which leverage blockchain technology and web3 gaming, offer new opportunities for players seeking health benefits and financial rewards. Brand partnerships and affiliate marketing strategies are essential for publishers to expand their reach and engage audiences. Technical support, game localization tools, bug fixes, and content updates are crucial elements of game development and maintenance. AI and ML are also utilized for customer support, server infrastructure, and performance capture to improve user experience.
  • Data privacy is a significant concern, with press releases and public relations efforts addressing these issues. Game events, balancing updates, and accessibility features cater to diverse player communities. In-game advertising, translation services, and licensed music contribute to immersive gaming experiences. Esports sponsorships and streaming platforms are transforming competitive gaming, while social media marketing and game trailers engage fans and generate buzz. Cross-platform play and procedural generation offer innovative gameplay experiences, further enhancing the market's appeal.

Dive into Technavio's robust research methodology, blending expert interviews, extensive data synthesis, and validated models for unparalleled Video Game Market insights. See full methodology.

Market Scope

Report Coverage

Details

Page number

202

Base year

2024

Historic period

2019-2023

Forecast period

2025-2029

Growth momentum & CAGR

Accelerate at a CAGR of 8.6%

Market growth 2025-2029

USD 111.7 billion

Market structure

Fragmented

YoY growth 2024-2025(%)

8.1

Key countries

US, Canada, Germany, UK, Italy, France, China, India, Japan, Brazil, Egypt, UAE, Oman, Argentina, KSA, UAE, Brazil, and Rest of World (ROW)

Competitive landscape

Leading Companies, Market Positioning of Companies, Competitive Strategies, and Industry Risks

Request Free Sample

What are the Key Data Covered in this Video Game Market Research and Growth Report?

  • CAGR of the Video Game industry during the forecast period
  • Detailed information on factors that will drive the growth and forecasting between 2025 and 2029
  • Precise estimation of the size of the market and its contribution of the industry in focus to the parent market
  • Accurate predictions about upcoming growth and trends and changes in consumer behaviour
  • Growth of the market across APAC, North America, Europe, South America, and Middle East and Africa
  • Thorough analysis of the market's competitive landscape and detailed information about companies
  • Comprehensive analysis of factors that will challenge the video game market growth of industry companies

We can help! Our analysts can customize this video game market research report to meet your requirements.

Get in touch

1 Executive Summary

  • 1.1 Market overview
    • Executive Summary - Chart on Market Overview
    • Executive Summary - Data Table on Market Overview
    • Executive Summary - Chart on Global Market Characteristics
    • Executive Summary - Chart on Market by Geography
    • Executive Summary - Chart on Market Segmentation by Platform
    • Executive Summary - Chart on Market Segmentation by Type
    • Executive Summary - Chart on Incremental Growth
    • Executive Summary - Data Table on Incremental Growth
    • Executive Summary - Chart on Company Market Positioning

2 Technavio Analysis

  • 2.1 Analysis of price sensitivity, lifecycle, customer purchase basket, adoption rates, and purchase criteria
    • Analysis of price sensitivity, lifecycle, customer purchase basket, adoption rates, and purchase criteria
  • 2.2 Criticality of inputs and Factors of differentiation
    • Overview on criticality of inputs and factors of differentiation
  • 2.3 Factors of disruption
    • Overview on factors of disruption
  • 2.4 Impact of drivers and challenges
    • Impact of drivers and challenges in 2024 and 2029

3 Market Landscape

  • 3.1 Market ecosystem
    • Parent Market
    • Data Table on - Parent Market
  • 3.2 Market characteristics
    • Market characteristics analysis
  • 3.3 Value chain analysis
    • Value chain analysis

4 Market Sizing

  • 4.1 Market definition
    • Offerings of companies included in the market definition
  • 4.2 Market segment analysis
    • Market segments
  • 4.3 Market size 2024
    • 4.4 Market outlook: Forecast for 2024-2029
      • Chart on Global - Market size and forecast 2024-2029 ($ billion)
      • Data Table on Global - Market size and forecast 2024-2029 ($ billion)
      • Chart on Global Market: Year-over-year growth 2024-2029 (%)
      • Data Table on Global Market: Year-over-year growth 2024-2029 (%)

    5 Historic Market Size

    • 5.1 Global Video Game Market 2019 - 2023
      • Historic Market Size - Data Table on Global Video Game Market 2019 - 2023 ($ billion)
    • 5.2 Platform segment analysis 2019 - 2023
      • Historic Market Size - Platform Segment 2019 - 2023 ($ billion)
    • 5.3 Type segment analysis 2019 - 2023
      • Historic Market Size - Type Segment 2019 - 2023 ($ billion)
    • 5.4 Geography segment analysis 2019 - 2023
      • Historic Market Size - Geography Segment 2019 - 2023 ($ billion)
    • 5.5 Country segment analysis 2019 - 2023
      • Historic Market Size - Country Segment 2019 - 2023 ($ billion)

    6 Qualitative Analysis

    • 6.1 Impact of AI on the Global Video Game Market

      7 Five Forces Analysis

      • 7.1 Five forces summary
        • Five forces analysis - Comparison between 2024 and 2029
      • 7.2 Bargaining power of buyers
        • Bargaining power of buyers - Impact of key factors 2024 and 2029
      • 7.3 Bargaining power of suppliers
        • Bargaining power of suppliers - Impact of key factors in 2024 and 2029
      • 7.4 Threat of new entrants
        • Threat of new entrants - Impact of key factors in 2024 and 2029
      • 7.5 Threat of substitutes
        • Threat of substitutes - Impact of key factors in 2024 and 2029
      • 7.6 Threat of rivalry
        • Threat of rivalry - Impact of key factors in 2024 and 2029
      • 7.7 Market condition
        • Chart on Market condition - Five forces 2024 and 2029

      8 Market Segmentation by Platform

      • 8.1 Market segments
        • Chart on Platform - Market share (2024-2029) (%)
        • Data Table on Platform - Market share (2024-2029) (%)
      • 8.2 Comparison by Platform
        • Chart on Comparison by Platform
        • Data Table on Comparison by Platform
      • 8.3 PlayStation - Market size and forecast (2024-2029)
        • Chart on PlayStation - Market size and forecast (2024-2029) ($ billion)
        • Data Table on PlayStation - Market size and forecast (2024-2029) ($ billion)
        • Chart on PlayStation - Year-over-year growth (2024-2029) (%)
        • Data Table on PlayStation - Year-over-year growth (2024-2029) (%)
      • 8.4 Xbox - Market size and forecast (2024-2029)
        • Chart on Xbox - Market size and forecast (2024-2029) ($ billion)
        • Data Table on Xbox - Market size and forecast (2024-2029) ($ billion)
        • Chart on Xbox - Year-over-year growth (2024-2029) (%)
        • Data Table on Xbox - Year-over-year growth (2024-2029) (%)
      • 8.5 Nintendo - Market size and forecast (2024-2029)
        • Chart on Nintendo - Market size and forecast (2024-2029) ($ billion)
        • Data Table on Nintendo - Market size and forecast (2024-2029) ($ billion)
        • Chart on Nintendo - Year-over-year growth (2024-2029) (%)
        • Data Table on Nintendo - Year-over-year growth (2024-2029) (%)
      • 8.6 PC (Steam, Epic Games Store, etc.) - Market size and forecast (2024-2029)
        • Chart on PC (Steam, Epic Games Store, etc.) - Market size and forecast (2024-2029) ($ billion)
        • Data Table on PC (Steam, Epic Games Store, etc.) - Market size and forecast (2024-2029) ($ billion)
        • Chart on PC (Steam, Epic Games Store, etc.) - Year-over-year growth (2024-2029) (%)
        • Data Table on PC (Steam, Epic Games Store, etc.) - Year-over-year growth (2024-2029) (%)
      • 8.7 Mobile (iOS, Android) - Market size and forecast (2024-2029)
        • Chart on Mobile (iOS, Android) - Market size and forecast (2024-2029) ($ billion)
        • Data Table on Mobile (iOS, Android) - Market size and forecast (2024-2029) ($ billion)
        • Chart on Mobile (iOS, Android) - Year-over-year growth (2024-2029) (%)
        • Data Table on Mobile (iOS, Android) - Year-over-year growth (2024-2029) (%)
      • 8.8 Market opportunity by Platform
        • Market opportunity by Platform ($ billion)
        • Data Table on Market opportunity by Platform ($ billion)

      9 Market Segmentation by Type

      • 9.1 Market segments
        • Chart on Type - Market share (2024-2029) (%)
        • Data Table on Type - Market share (2024-2029) (%)
      • 9.2 Comparison by Type
        • Chart on Comparison by Type
        • Data Table on Comparison by Type
      • 9.3 Offline - Market size and forecast (2024-2029)
        • Chart on Offline - Market size and forecast (2024-2029) ($ billion)
        • Data Table on Offline - Market size and forecast (2024-2029) ($ billion)
        • Chart on Offline - Year-over-year growth (2024-2029) (%)
        • Data Table on Offline - Year-over-year growth (2024-2029) (%)
      • 9.4 Online - Market size and forecast (2024-2029)
        • Chart on Online - Market size and forecast (2024-2029) ($ billion)
        • Data Table on Online - Market size and forecast (2024-2029) ($ billion)
        • Chart on Online - Year-over-year growth (2024-2029) (%)
        • Data Table on Online - Year-over-year growth (2024-2029) (%)
      • 9.5 Market opportunity by Type
        • Market opportunity by Type ($ billion)
        • Data Table on Market opportunity by Type ($ billion)

      10 Market Segmentation by End-User

      • 10.1 Market segments
        • Chart on End-User - Market share (2024-2029) (%)
        • Data Table on End-User - Market share (2024-2029) (%)
      • 10.2 Comparison by End-User
        • Chart on Comparison by End-User
        • Data Table on Comparison by End-User
      • 10.3 Hardcore Gamers - Market size and forecast (2024-2029)
        • Chart on Hardcore Gamers - Market size and forecast (2024-2029) ($ billion)
        • Data Table on Hardcore Gamers - Market size and forecast (2024-2029) ($ billion)
        • Chart on Hardcore Gamers - Year-over-year growth (2024-2029) (%)
        • Data Table on Hardcore Gamers - Year-over-year growth (2024-2029) (%)
      • 10.4 Casual Gamers - Market size and forecast (2024-2029)
        • Chart on Casual Gamers - Market size and forecast (2024-2029) ($ billion)
        • Data Table on Casual Gamers - Market size and forecast (2024-2029) ($ billion)
        • Chart on Casual Gamers - Year-over-year growth (2024-2029) (%)
        • Data Table on Casual Gamers - Year-over-year growth (2024-2029) (%)
      • 10.5 Esports Enthusiasts - Market size and forecast (2024-2029)
        • Chart on Esports Enthusiasts - Market size and forecast (2024-2029) ($ billion)
        • Data Table on Esports Enthusiasts - Market size and forecast (2024-2029) ($ billion)
        • Chart on Esports Enthusiasts - Year-over-year growth (2024-2029) (%)
        • Data Table on Esports Enthusiasts - Year-over-year growth (2024-2029) (%)
      • 10.6 Market opportunity by End-User
        • Market opportunity by End-User ($ billion)
        • Data Table on Market opportunity by End-User ($ billion)

      11 Market Segmentation by Revenue Model

      • 11.1 Market segments
        • Chart on Revenue Model - Market share (2024-2029) (%)
        • Data Table on Revenue Model - Market share (2024-2029) (%)
      • 11.2 Comparison by Revenue Model
        • Chart on Comparison by Revenue Model
        • Data Table on Comparison by Revenue Model
      • 11.3 Game Sales (Digital & Physical) - Market size and forecast (2024-2029)
        • Chart on Game Sales (Digital & Physical) - Market size and forecast (2024-2029) ($ billion)
        • Data Table on Game Sales (Digital & Physical) - Market size and forecast (2024-2029) ($ billion)
        • Chart on Game Sales (Digital & Physical) - Year-over-year growth (2024-2029) (%)
        • Data Table on Game Sales (Digital & Physical) - Year-over-year growth (2024-2029) (%)
      • 11.4 In-Game Purchases - Market size and forecast (2024-2029)
        • Chart on In-Game Purchases - Market size and forecast (2024-2029) ($ billion)
        • Data Table on In-Game Purchases - Market size and forecast (2024-2029) ($ billion)
        • Chart on In-Game Purchases - Year-over-year growth (2024-2029) (%)
        • Data Table on In-Game Purchases - Year-over-year growth (2024-2029) (%)
      • 11.5 Subscriptions - Market size and forecast (2024-2029)
        • Chart on Subscriptions - Market size and forecast (2024-2029) ($ billion)
        • Data Table on Subscriptions - Market size and forecast (2024-2029) ($ billion)
        • Chart on Subscriptions - Year-over-year growth (2024-2029) (%)
        • Data Table on Subscriptions - Year-over-year growth (2024-2029) (%)
      • 11.6 Advertising - Market size and forecast (2024-2029)
        • Chart on Advertising - Market size and forecast (2024-2029) ($ billion)
        • Data Table on Advertising - Market size and forecast (2024-2029) ($ billion)
        • Chart on Advertising - Year-over-year growth (2024-2029) (%)
        • Data Table on Advertising - Year-over-year growth (2024-2029) (%)
      • 11.7 Market opportunity by Revenue Model
        • Market opportunity by Revenue Model ($ billion)
        • Data Table on Market opportunity by Revenue Model ($ billion)

      12 Customer Landscape

      • 12.1 Customer landscape overview
        • Analysis of price sensitivity, lifecycle, customer purchase basket, adoption rates, and purchase criteria

      13 Geographic Landscape

      • 13.1 Geographic segmentation
        • Chart on Market share by geography 2024-2029 (%)
        • Data Table on Market share by geography 2024-2029 (%)
      • 13.2 Geographic comparison
        • Chart on Geographic comparison
        • Data Table on Geographic comparison
      • 13.3 APAC - Market size and forecast 2024-2029
        • Chart on APAC - Market size and forecast 2024-2029 ($ billion)
        • Data Table on APAC - Market size and forecast 2024-2029 ($ billion)
        • Chart on APAC - Year-over-year growth 2024-2029 (%)
        • Data Table on APAC - Year-over-year growth 2024-2029 (%)
      • 13.4 North America - Market size and forecast 2024-2029
        • Chart on North America - Market size and forecast 2024-2029 ($ billion)
        • Data Table on North America - Market size and forecast 2024-2029 ($ billion)
        • Chart on North America - Year-over-year growth 2024-2029 (%)
        • Data Table on North America - Year-over-year growth 2024-2029 (%)
      • 13.5 Europe - Market size and forecast 2024-2029
        • Chart on Europe - Market size and forecast 2024-2029 ($ billion)
        • Data Table on Europe - Market size and forecast 2024-2029 ($ billion)
        • Chart on Europe - Year-over-year growth 2024-2029 (%)
        • Data Table on Europe - Year-over-year growth 2024-2029 (%)
      • 13.6 South America - Market size and forecast 2024-2029
        • Chart on South America - Market size and forecast 2024-2029 ($ billion)
        • Data Table on South America - Market size and forecast 2024-2029 ($ billion)
        • Chart on South America - Year-over-year growth 2024-2029 (%)
        • Data Table on South America - Year-over-year growth 2024-2029 (%)
      • 13.7 Middle East and Africa - Market size and forecast 2024-2029
        • Chart on Middle East and Africa - Market size and forecast 2024-2029 ($ billion)
        • Data Table on Middle East and Africa - Market size and forecast 2024-2029 ($ billion)
        • Chart on Middle East and Africa - Year-over-year growth 2024-2029 (%)
        • Data Table on Middle East and Africa - Year-over-year growth 2024-2029 (%)
      • 13.8 US - Market size and forecast 2024-2029
        • Chart on US - Market size and forecast 2024-2029 ($ billion)
        • Data Table on US - Market size and forecast 2024-2029 ($ billion)
        • Chart on US - Year-over-year growth 2024-2029 (%)
        • Data Table on US - Year-over-year growth 2024-2029 (%)
      • 13.9 China - Market size and forecast 2024-2029
        • Chart on China - Market size and forecast 2024-2029 ($ billion)
        • Data Table on China - Market size and forecast 2024-2029 ($ billion)
        • Chart on China - Year-over-year growth 2024-2029 (%)
        • Data Table on China - Year-over-year growth 2024-2029 (%)
      • 13.10 South Korea - Market size and forecast 2024-2029
        • Chart on South Korea - Market size and forecast 2024-2029 ($ billion)
        • Data Table on South Korea - Market size and forecast 2024-2029 ($ billion)
        • Chart on South Korea - Year-over-year growth 2024-2029 (%)
        • Data Table on South Korea - Year-over-year growth 2024-2029 (%)
      • 13.11 Canada - Market size and forecast 2024-2029
        • Chart on Canada - Market size and forecast 2024-2029 ($ billion)
        • Data Table on Canada - Market size and forecast 2024-2029 ($ billion)
        • Chart on Canada - Year-over-year growth 2024-2029 (%)
        • Data Table on Canada - Year-over-year growth 2024-2029 (%)
      • 13.12 Germany - Market size and forecast 2024-2029
        • Chart on Germany - Market size and forecast 2024-2029 ($ billion)
        • Data Table on Germany - Market size and forecast 2024-2029 ($ billion)
        • Chart on Germany - Year-over-year growth 2024-2029 (%)
        • Data Table on Germany - Year-over-year growth 2024-2029 (%)
      • 13.13 India - Market size and forecast 2024-2029
        • Chart on India - Market size and forecast 2024-2029 ($ billion)
        • Data Table on India - Market size and forecast 2024-2029 ($ billion)
        • Chart on India - Year-over-year growth 2024-2029 (%)
        • Data Table on India - Year-over-year growth 2024-2029 (%)
      • 13.14 UK - Market size and forecast 2024-2029
        • Chart on UK - Market size and forecast 2024-2029 ($ billion)
        • Data Table on UK - Market size and forecast 2024-2029 ($ billion)
        • Chart on UK - Year-over-year growth 2024-2029 (%)
        • Data Table on UK - Year-over-year growth 2024-2029 (%)
      • 13.15 Japan - Market size and forecast 2024-2029
        • Chart on Japan - Market size and forecast 2024-2029 ($ billion)
        • Data Table on Japan - Market size and forecast 2024-2029 ($ billion)
        • Chart on Japan - Year-over-year growth 2024-2029 (%)
        • Data Table on Japan - Year-over-year growth 2024-2029 (%)
      • 13.16 France - Market size and forecast 2024-2029
        • Chart on France - Market size and forecast 2024-2029 ($ billion)
        • Data Table on France - Market size and forecast 2024-2029 ($ billion)
        • Chart on France - Year-over-year growth 2024-2029 (%)
        • Data Table on France - Year-over-year growth 2024-2029 (%)
      • 13.17 Brazil - Market size and forecast 2024-2029
        • Chart on Brazil - Market size and forecast 2024-2029 ($ billion)
        • Data Table on Brazil - Market size and forecast 2024-2029 ($ billion)
        • Chart on Brazil - Year-over-year growth 2024-2029 (%)
        • Data Table on Brazil - Year-over-year growth 2024-2029 (%)
      • 13.18 Market opportunity by geography
        • Market opportunity by geography ($ billion)
        • Data Tables on Market opportunity by geography ($ billion)
      • 13.19 Italy - Market size and forecast (2024-2029)
        • Chart on Italy - Market size and forecast (2024-2029) ($ billion)
        • Data Table on Italy - Market size and forecast (2024-2029) ($ billion)
        • Chart on Italy - Year-over-year growth (2024-2029) (%)
        • Data Table on Italy - Year-over-year growth (2024-2029) (%)
      • 13.20 Egypt - Market size and forecast (2024-2029)
        • Chart on Egypt - Market size and forecast (2024-2029) ($ billion)
        • Data Table on Egypt - Market size and forecast (2024-2029) ($ billion)
        • Chart on Egypt - Year-over-year growth (2024-2029) (%)
        • Data Table on Egypt - Year-over-year growth (2024-2029) (%)
      • 13.21 UAE - Market size and forecast (2024-2029)
        • Chart on UAE - Market size and forecast (2024-2029) ($ billion)
        • Data Table on UAE - Market size and forecast (2024-2029) ($ billion)
        • Chart on UAE - Year-over-year growth (2024-2029) (%)
        • Data Table on UAE - Year-over-year growth (2024-2029) (%)
      • 13.22 Oman - Market size and forecast (2024-2029)
        • Chart on Oman - Market size and forecast (2024-2029) ($ billion)
        • Data Table on Oman - Market size and forecast (2024-2029) ($ billion)
        • Chart on Oman - Year-over-year growth (2024-2029) (%)
        • Data Table on Oman - Year-over-year growth (2024-2029) (%)
      • 13.23 Argentina - Market size and forecast (2024-2029)
        • Chart on Argentina - Market size and forecast (2024-2029) ($ billion)
        • Data Table on Argentina - Market size and forecast (2024-2029) ($ billion)
        • Chart on Argentina - Year-over-year growth (2024-2029) (%)
        • Data Table on Argentina - Year-over-year growth (2024-2029) (%)
      • 13.24 KSA - Market size and forecast (2024-2029)
        • Chart on KSA - Market size and forecast (2024-2029) ($ billion)
        • Data Table on KSA - Market size and forecast (2024-2029) ($ billion)
        • Chart on KSA - Year-over-year growth (2024-2029) (%)
        • Data Table on KSA - Year-over-year growth (2024-2029) (%)
      • 13.25 Rest of World (ROW) - Market size and forecast (2024-2029)
        • Chart on Rest of World (ROW) - Market size and forecast (2024-2029) ($ billion)
        • Data Table on Rest of World (ROW) - Market size and forecast (2024-2029) ($ billion)
        • Chart on Rest of World (ROW) - Year-over-year growth (2024-2029) (%)
        • Data Table on Rest of World (ROW) - Year-over-year growth (2024-2029) (%)

      14 Drivers, Challenges, and Opportunity/Restraints

      • 14.1 Market drivers
        • 14.2 Market challenges
          • 14.3 Impact of drivers and challenges
            • Impact of drivers and challenges in 2024 and 2029
          • 14.4 Market opportunities/restraints

            15 Competitive Landscape

            • 15.1 Overview
              • 15.2 Competitive Landscape
                • Overview on criticality of inputs and factors of differentiation
              • 15.3 Landscape disruption
                • Overview on factors of disruption
              • 15.4 Industry risks
                • Impact of key risks on business

              16 Competitive Analysis

              • 16.1 Companies profiled
                • Companies covered
              • 16.2 Market positioning of companies
                • Matrix on companies position and classification
              • 16.3 Activision Blizzard
                • Activision Blizzard - Overview
                • Activision Blizzard - Product / Service
                • Activision Blizzard - Key offerings
              • 16.4 Bandai Namco Holdings Inc.
                • Bandai Namco Holdings Inc. - Overview
                • Bandai Namco Holdings Inc. - Product / Service
                • Bandai Namco Holdings Inc. - Key offerings
              • 16.5 Capcom Co., Ltd.
                • Capcom Co., Ltd. - Overview
                • Capcom Co., Ltd. - Product / Service
                • Capcom Co., Ltd. - Key offerings
              • 16.6 Electronic Arts Inc. (EA)
                • Electronic Arts Inc. (EA) - Overview
                • Electronic Arts Inc. (EA) - Product / Service
                • Electronic Arts Inc. (EA) - Key offerings
              • 16.7 Epic Games, Inc.
                • Epic Games, Inc. - Overview
                • Epic Games, Inc. - Product / Service
                • Epic Games, Inc. - Key offerings
              • 16.8 Krafton, Inc.
                • Krafton, Inc. - Overview
                • Krafton, Inc. - Product / Service
                • Krafton, Inc. - Key offerings
              • 16.9 Microsoft Corporation
                • Microsoft Corporation - Overview
                • Microsoft Corporation - Product / Service
                • Microsoft Corporation - Key offerings
              • 16.10 MiHoYo Co., Ltd.
                • MiHoYo Co., Ltd. - Overview
                • MiHoYo Co., Ltd. - Product / Service
                • MiHoYo Co., Ltd. - Key offerings
              • 16.11 NetEase, Inc.
                • NetEase, Inc. - Overview
                • NetEase, Inc. - Product / Service
                • NetEase, Inc. - Key offerings
              • 16.12 Nintendo Co., Ltd.
                • Nintendo Co., Ltd. - Overview
                • Nintendo Co., Ltd. - Product / Service
                • Nintendo Co., Ltd. - Key offerings
              • 16.13 Roblox Corporation
                • Roblox Corporation - Overview
                • Roblox Corporation - Product / Service
                • Roblox Corporation - Key offerings
              • 16.14 Sega Sammy Holdings Inc.
                • Sega Sammy Holdings Inc. - Overview
                • Sega Sammy Holdings Inc. - Product / Service
                • Sega Sammy Holdings Inc. - Key offerings
              • 16.15 Sony Group Corporation (PlayStation)
                • Sony Group Corporation (PlayStation) - Overview
                • Sony Group Corporation (PlayStation) - Product / Service
                • Sony Group Corporation (PlayStation) - Key offerings
              • 16.16 Square Enix Holdings Co., Ltd.
                • Square Enix Holdings Co., Ltd. - Overview
                • Square Enix Holdings Co., Ltd. - Product / Service
                • Square Enix Holdings Co., Ltd. - Key offerings
              • 16.17 Take-Two Interactive Software, Inc.
                • Take-Two Interactive Software, Inc. - Overview
                • Take-Two Interactive Software, Inc. - Product / Service
                • Take-Two Interactive Software, Inc. - Key offerings
              • 16.18 Tencent Holdings Ltd.
                • Tencent Holdings Ltd. - Overview
                • Tencent Holdings Ltd. - Product / Service
                • Tencent Holdings Ltd. - Key offerings
              • 16.19 Ubisoft Entertainment SA
                • Ubisoft Entertainment SA - Overview
                • Ubisoft Entertainment SA - Product / Service
                • Ubisoft Entertainment SA - Key offerings
              • 16.20 Valve Corporation
                • Valve Corporation - Overview
                • Valve Corporation - Product / Service
                • Valve Corporation - Key offerings
              • 16.21 Warner 1 Bros. Games (Warner Bros. Discovery)
                • Warner 1 Bros. Games (Warner Bros. Discovery) - Overview
                • Warner 1 Bros. Games (Warner Bros. Discovery) - Product / Service
                • Warner 1 Bros. Games (Warner Bros. Discovery) - Key offerings
              • 16.22 Zynga Inc.
                • Zynga Inc. - Overview
                • Zynga Inc. - Product / Service
                • Zynga Inc. - Key offerings
              • 16.23 Activision Blizzard Inc.
                • Activision Blizzard Inc. - Overview
                • Activision Blizzard Inc. - Product / Service
                • Activision Blizzard Inc. - Key offerings
              • 16.24 Apple Inc.
                • Apple Inc. - Overview
                • Apple Inc. - Product / Service
                • Apple Inc. - Key offerings
              • 16.25 Aristocrat Leisure Ltd.
                • Aristocrat Leisure Ltd. - Overview
                • Aristocrat Leisure Ltd. - Product / Service
                • Aristocrat Leisure Ltd. - Key offerings
              • 16.26 Bandai Namco Holdings Inc.
                • Bandai Namco Holdings Inc. - Overview
                • Bandai Namco Holdings Inc. - Product / Service
                • Bandai Namco Holdings Inc. - Key offerings
              • 16.27 Capcom Co. Ltd.
                • Capcom Co. Ltd. - Overview
                • Capcom Co. Ltd. - Product / Service
                • Capcom Co. Ltd. - Key offerings
              • 16.28 Electronic Arts Inc.
                • Electronic Arts Inc. - Overview
                • Electronic Arts Inc. - Product / Service
                • Electronic Arts Inc. - Key offerings
              • 16.29 Enad Global 7 AB
                • Enad Global 7 AB - Overview
                • Enad Global 7 AB - Product / Service
                • Enad Global 7 AB - Key offerings
              • 16.30 Epic Games Inc.
                • Epic Games Inc. - Overview
                • Epic Games Inc. - Product / Service
                • Epic Games Inc. - Key offerings
              • 16.31 Konami Group Corp.
                • Konami Group Corp. - Overview
                • Konami Group Corp. - Product / Service
                • Konami Group Corp. - Key offerings
              • 16.32 Krafton Inc.
                • Krafton Inc. - Overview
                • Krafton Inc. - Product / Service
                • Krafton Inc. - Key offerings
              • 16.33 Microsoft Corp.
                • Microsoft Corp. - Overview
                • Microsoft Corp. - Product / Service
                • Microsoft Corp. - Key offerings
              • 16.34 MOBIRIX Corp.
                • MOBIRIX Corp. - Overview
                • MOBIRIX Corp. - Product / Service
                • MOBIRIX Corp. - Key offerings
              • 16.35 NetEase Inc.
                • NetEase Inc. - Overview
                • NetEase Inc. - Product / Service
                • NetEase Inc. - Key offerings
              • 16.36 Nintendo Co. Ltd.
                • Nintendo Co. Ltd. - Overview
                • Nintendo Co. Ltd. - Product / Service
                • Nintendo Co. Ltd. - Key offerings
              • 16.37 Playtika Holding Corp.
                • Playtika Holding Corp. - Overview
                • Playtika Holding Corp. - Product / Service
                • Playtika Holding Corp. - Key offerings
              • 16.38 Roblox Corp.
                • Roblox Corp. - Overview
                • Roblox Corp. - Product / Service
                • Roblox Corp. - Key offerings
              • 16.39 SEGA SAMMY CREATION INC.
                • SEGA SAMMY CREATION INC. - Overview
                • SEGA SAMMY CREATION INC. - Product / Service
                • SEGA SAMMY CREATION INC. - Key offerings
              • 16.40 Sony Group Corp.
                • Sony Group Corp. - Overview
                • Sony Group Corp. - Product / Service
                • Sony Group Corp. - Key offerings
              • 16.41 Take Two Interactive Software Inc.
                • Take Two Interactive Software Inc. - Overview
                • Take Two Interactive Software Inc. - Product / Service
                • Take Two Interactive Software Inc. - Key offerings
              • 16.42 Tencent Holdings Ltd.
                • Tencent Holdings Ltd. - Overview
                • Tencent Holdings Ltd. - Product / Service
                • Tencent Holdings Ltd. - Key offerings

              17 Appendix

              • 17.1 Scope of the report
                • 17.2 Inclusions and exclusions checklist
                  • Inclusions checklist
                  • Exclusions checklist
                • 17.3 Currency conversion rates for US$
                  • Currency conversion rates for US$
                • 17.4 Research methodology
                  • Research methodology
                • 17.5 Data procurement
                  • Information sources
                • 17.6 Data validation
                  • Data validation
                • 17.7 Validation techniques employed for market sizing
                  • Validation techniques employed for market sizing
                • 17.8 Data synthesis
                  • Data synthesis
                • 17.9 360 degree market analysis
                  • 360 degree market analysis
                • 17.10 List of abbreviations
                  • List of abbreviations

                Research Methodology

                Technavio presents a detailed picture of the market by way of study, synthesis, and summation of data from multiple sources. The analysts have presented the various facets of the market with a particular focus on identifying the key industry influencers. The data thus presented is comprehensive, reliable, and the result of extensive research, both primary and secondary.

                INFORMATION SOURCES

                Primary sources

                • Manufacturers and suppliers
                • Channel partners
                • Industry experts
                • Strategic decision makers

                Secondary sources

                • Industry journals and periodicals
                • Government data
                • Financial reports of key industry players
                • Historical data
                • Press releases

                DATA ANALYSIS

                Data Synthesis

                • Collation of data
                • Estimation of key figures
                • Analysis of derived insights

                Data Validation

                • Triangulation with data models
                • Reference against proprietary databases
                • Corroboration with industry experts

                REPORT WRITING

                Qualitative

                • Market drivers
                • Market challenges
                • Market trends
                • Five forces analysis

                Quantitative

                • Market size and forecast
                • Market segmentation
                • Geographical insights
                • Competitive landscape

                Interested in this report?

                Get your sample now to see our research methodology and insights!

                Download Now

                Frequently Asked Questions

                Video Game market growth will increase by $ 111.7 bn during 2025-2029.

                The Video Game market is expected to grow at a CAGR of 8.6% during 2025-2029.

                Video Game market is segmented by Platform( Mobile devices, Consoles, Computing devices, South America, Middle East and Africa) Type( Offline, Online, Europe, South America, Middle East and Africa)

                Activision Blizzard, Bandai Namco Holdings Inc., Capcom Co., Ltd., Electronic Arts Inc. (EA), Epic Games, Inc., Krafton, Inc., Microsoft Corporation, MiHoYo Co., Ltd., NetEase, Inc., Nintendo Co., Ltd., Roblox Corporation, Sega Sammy Holdings Inc., Sony Group Corporation (PlayStation), Square Enix Holdings Co., Ltd., Take-Two Interactive Software, Inc., Tencent Holdings Ltd., Ubisoft Entertainment SA, Valve Corporation, Warner 1 Bros. Games (Warner Bros. Discovery), Zynga Inc. are a few of the key vendors in the Video Game market.

                APAC will register the highest growth rate of 54% among the other regions. Therefore, the Video Game market in APAC is expected to garner significant business opportunities for the vendors during the forecast period.

                US, Canada, Germany, UK, Italy, France, China, India, Japan, Brazil, Egypt, UAE, Oman, Argentina, KSA, UAE, Brazil, Rest of World (ROW)

                • Rising penetration of smartphones and improving internet accessMobile gaming is a key segment of the entire video game industry. The growth of the mobile gaming segment is driven by the increasing penetration of smartphones and improving access to the Internet. Mobile gaming is the largest segment of the global video game market and is growing significantly compared with the segments.The availability of affordable smartphones is boosting demand for such gadgets in developing nations like China is the driving factor this market.
                • India is the driving factor this market.
                • and Mexico is the driving factor this market.
                • which is propelling the expansion of the mobile gaming industry. Xiaomis Redmi series is the driving factor this market.
                • Samsungs J series is the driving factor this market.
                • and OPPOs A series are a few well-liked low-cost smartphone models that are used for mobile gaming in India. The number of mobile gamers is also rising as more high-end smartphones become available is the driving factor this market.
                • particularly in developing nations like China and India. The user experience is enhanced when large-screen mobile devices with high display resolutions are used for gaming.Users may easily access multiplayer games on the Internet is the driving factor this market.
                • particularly free games. Furthermore is the driving factor this market.
                • the expansion of the worldwide video game market is also fueled by advances in access to high-speed Internet. Hence is the driving factor this market.
                • many vendors is the driving factor this market.
                • such as Gameloft and Rovio Entertainment is the driving factor this market.
                • have ventured into mobile gaming platforms to provide online games and capitalize on the mobile gaming phenomenon. Hence is the driving factor this market.
                • improvements in Internet access will drive the growth of the global video game market during the forecast period. is the driving factor this market.

                The Video Game market vendors should focus on grabbing business opportunities from the Mobile devices segment as it accounted for the largest market share in the base year.