Vapor Compression Distiller Market Analysis APAC, Europe, North America, Middle East and Africa, South America - US, China, India, Germany, UK - Size and Forecast 2024-2028

Vapor Compression Distiller Market Analysis APAC, Europe, North America, Middle East and Africa, South America - US, China, India, Germany, UK - Size and Forecast 2024-2028

Published: Mar 2024 168 Pages SKU: IRTNTR77783

Market Overview at a Glance

$543.67 Mn
Market Opportunity
6.2%
CAGR
5.36
YoY growth 2023-2024(%)

Vapor Compression Distiller Market Size 2024-2028

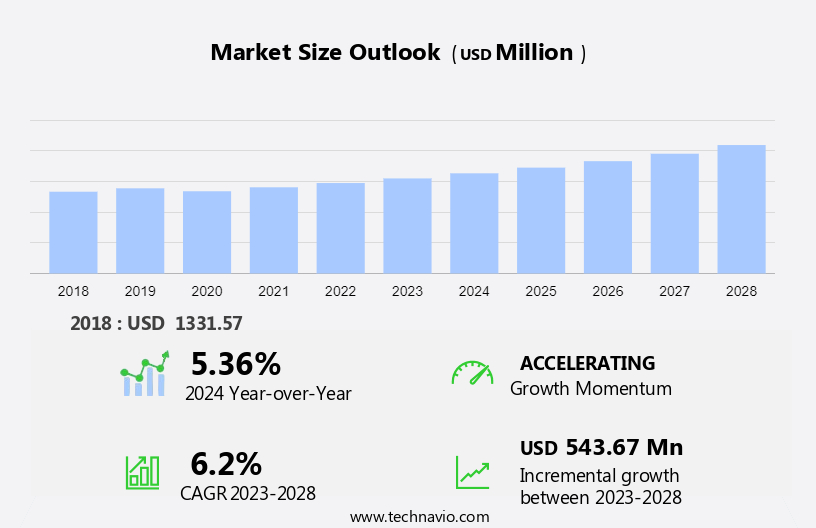
The vapor compression distiller market size is forecast to increase by USD 543.67 million at a CAGR of 6.2% between 2023 and 2028.

  • The market is experiencing significant growth due to several key factors. The increasing population and resulting rise in demand for potable water are major drivers for market expansion. Additionally, investments in wastewater treatment plants are on the rise, providing opportunities for the vapor compression distillation technology to gain traction. Vapor compression distillation plays a pivotal role in desalination plants, providing freshwater in regions facing scarcity or contamination. These systems utilize mechanical compressors to compress vapor, enabling the efficient separation of impurities and contaminants from water or other liquids. However, the high costs associated with this technology pose a challenge to market growth. Despite this, the market is expected to continue its upward trajectory, driven by the pressing need for clean water solutions. The vapor compression distillation process offers an effective method for producing high-quality water, making it a valuable solution for various industries and applications.

What will be the Size of the Market During the Forecast Period?

Vapor Compression Distiller Market Size

 Request Free Sample

  • The market encompasses the production and application of advanced distillation systems used for the purification of water and various industrial processes. Industrialization and the increasing demand for clean water sources have fueled market growth. Energy efficiency and reduced operating costs are key trends, with advancements in technology incorporating IoT capabilities, automation, and renewable energy sources. Applications span across various industries, including pharmaceuticals for drug formulations and laboratory testing, food and beverage processing, and the purification of chemicals and solvents.
  • Installation costs and maintenance requirements remain important considerations, while thermocompression distillation, which combines vapor compression and thermocompression techniques, offers enhanced performance and versatility. The market continues to evolve, driven by industry developments and the growing importance of water treatment solutions.

How is this Industry segmented and which is the largest segment?

The industry research report provides comprehensive data (region-wise segment analysis), with forecasts and estimates in "USD million" for the period 2024-2028, as well as historical data from 2018-2022 for the following segments.
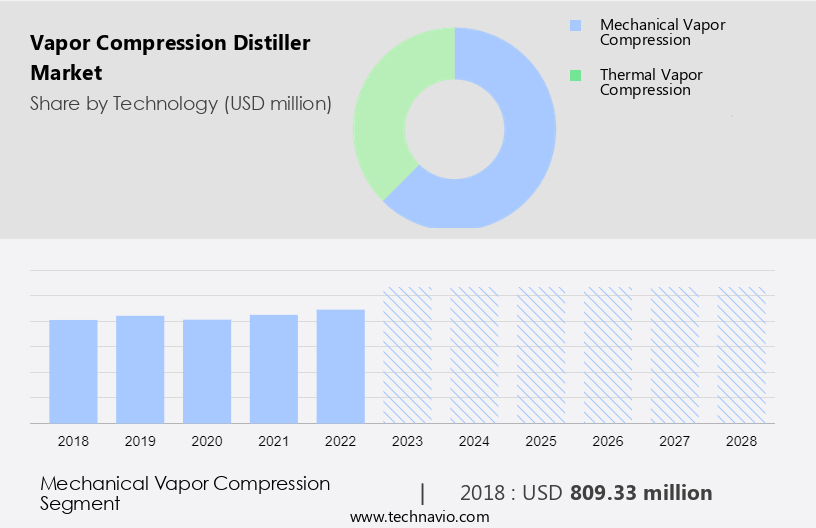
  • Technology
    • Mechanical vapor compression
    • Thermal vapor compression
  • Application
    • Pharmaceutical
    • Food industry
    • Chemical industry
    • Others
  • Geography
    • APAC
      • China
      • India
    • Europe
      • Germany
      • UK
    • North America
      • US
    • Middle East and Africa
    • South America

By Technology Insights

  • The mechanical vapor compression segment is estimated to witness significant growth during the forecast period.

The segment is projected to expand due to its extensive usage in water desalination, particularly for treating high-salinity water sources such as seawater and river estuaries in remote areas. Mechanical vapor compression distillers are compact distillation units with a capacity of 250-3,000 m3/d. These distillers employ an electrically operated compressor to compress water vapor, which also functions as a heater for the evaporator. Despite their high energy consumption and cost, mechanical vapor compression distillers offer advantages such as flexibility in compressor selection to cater to varying application requirements and long-term safety and reliability. These distillers play a crucial role in addressing the global water scarcity issue by providing clean water for various industries, including pharmaceuticals, food processing, beverage production, and desalination plants.

Vapor Compression Distiller Market Size

Get a glance at the market report of share of various segments Request Free Sample

The mechanical vapor compression segment was valued at USD 809.33 million in 2018 and showed a gradual increase during the forecast period.

Regional Analysis

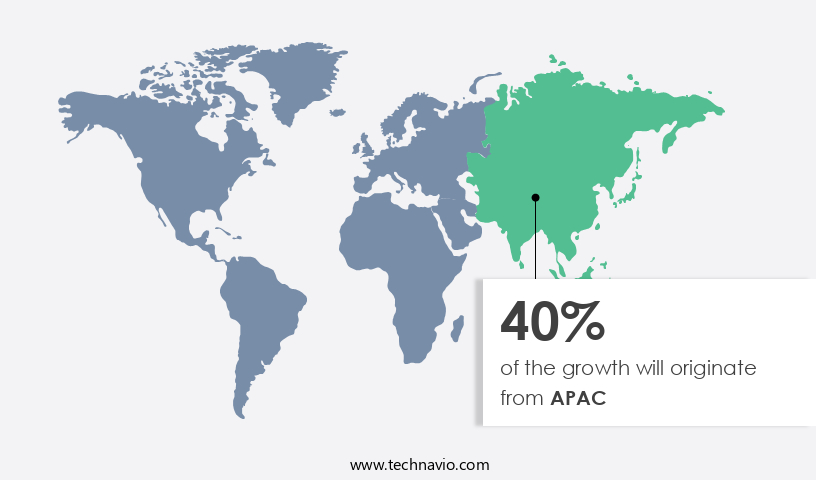
  • APAC is estimated to contribute 40% to the growth of the global market during the forecast period.

Technavio's analysts have elaborately explained the regional trends and drivers that shape the market during the forecast period.

Vapor Compression Distiller Market Share by Geography

For more insights on the market size of various regions, Request Free Sample

The Asia Pacific region is projected to drive the expansion of the market due to the growing demand for clean water sources in response to population growth and industrialization. China, India, Japan, and Australia are major contributors to market growth In the region, as these countries grapple with water scarcity and climate change. Governments In these nations are prioritizing desalination plants as a sustainable solution to address the issue, leading to increased demand for vapor compression distillation systems. This technology is particularly effective for producing pure water from seawater or brackish water, making it a valuable asset in regions experiencing water stress.

Market Dynamics

Our researchers analyzed the data with 2023 as the base year, along with the key drivers, trends, and challenges. A holistic analysis of drivers will help companies refine their marketing strategies to gain a competitive advantage.

What are the key market drivers leading to the rise In the adoption of Industry?

Increase in population and rise in demand for potable water is the key driver of the market.

  • The market is experiencing significant growth due to the increasing global population and the resulting demand for clean water sources. By 2050, the world population is projected to reach 9.73 billion, yet only 2.2 billion people currently have access to safe, potable water. The uneven distribution of freshwater reserves necessitates an increase in desalination demand. Contaminants, such as industrial waste, pollutants, and pathogenic bacteria and microorganisms, render much of the available water unfit for consumption. Vapor compression distillation is an energy-efficient technology that effectively separates components and purifies water, making it an essential solution for addressing the global water scarcity issue.
  • This technology is widely used in various industries, including pharmaceuticals, food processing, beverage processing, and solvents purification, among others. Advancements in technology, such as automation, IoT capabilities, and integration with renewable energy sources, are further enhancing the market's growth potential. Despite the benefits, installation costs and maintenance requirements remain challenges for market participants.

What are the market trends shaping the Vapor Compression Distiller Industry?

Increasing investments in wastewater treatment plants is the upcoming market trend.

  • The market holds significance In the wastewater treatment industry due to its application In the high-efficiency treatment of water containing impurities. This technology is increasingly utilized in packaged and mobile wastewater treatment systems, particularly in water-scarce regions where clean water sources are a concern. The global market for vapor compression distillers is driven by the increasing investments in desalination plants and industrialization. For instance, in March 2023, over USD57 million was allocated by the US government towards upgrading wastewater and stormwater systems in New England states. This investment underscores the growing demand for advanced water treatment solutions, including vapor compression distillers, to address contamination and scarcity issues.
  • Vapor compression distillers offer energy efficiency, reduced operating costs, and the ability to treat contaminants, making them a preferred choice for water treatment applications. Advancements in technology, such as automation and IoT capabilities, and the integration of renewable energy sources, are further enhancing the market's growth prospects. The market caters to various industries, including pharmaceutical, food, and beverage processing, drug formulations, injections, laboratory testing, and solvents, among others, by providing pure water through the purification of chemicals and separation of components. The market's competitive environment is shaped by industry developments and dynamics, with key players focusing on innovation and outsourcing to meet the growing demand for water treatment solutions.

What challenges does the Vapor Compression Distiller Industry face during its growth?

High costs of vapor compression distillation is a key challenge affecting the industry growth.

  • Vapor compression distillation is a distillation system used for separating water from impurities, particularly in desalination plants. The high capital investment required to establish a vapor compression distillation unit is influenced by factors such as energy efficiency, component availability, and project funding. Despite the decline in desalination costs, vapor compression distillation technology consumes significantly more energy than other water treatment methods, contributing to over 50% of the total operating expenses in seawater desalination plants. Approximately 200 million kilowatt-hours per day are needed to power vapor compression distillation units worldwide. Advancements in technology, including automation, IoT capabilities, and renewable energy sources, aim to improve energy efficiency and reduce costs.
  • Industries such as pharmaceuticals, food processing, and beverage manufacturing rely on vapor compression distillation for purifying water, drug formulations, injections, and laboratory testing. The technology is also used for separating components in solvents and purifying chemicals. The competitive environment In the water treatment industry drives innovation and industry developments, including outsourcing and desktop outsourcing market opportunities.

Exclusive Customer Landscape

The market forecasting report includes the adoption lifecycle of the market, covering from the innovator's stage to the laggard's stage. It focuses on adoption rates in different regions based on penetration. Furthermore, the market report also includes key purchase criteria and drivers of price sensitivity to help companies evaluate and develop their market growth analysis strategies.

Vapor Compression Distiller Market Share by Geography

 Customer Landscape

Key Companies & Market Insights

Companies are implementing various strategies, such as strategic alliances, market forecast, partnerships, mergers and acquisitions, geographical expansion, and product/service launches, to enhance their presence in the industry.

The industry research and growth report includes detailed analyses of the competitive landscape of the market and information about key companies, including:

  • Alfa Laval AB
  • Aqua Chem Inc.
  • BRAM COR S.p.A.
  • Chart Industries Inc.
  • Chutian Technology Co. Ltd.
  • GEA Group AG
  • Genist Technocracy Pvt Ltd
  • Grundfos Holding AS
  • Kalina Engineering Pvt Ltd.
  • LPR Global Inc.
  • Paul Mueller Co. Inc.
  • Puretech
  • RAG Stiftung
  • wemacequipment.com
  • Zibo Huazhou Pharmaceutical Equipment Co. Ltd.

Qualitative and quantitative analysis of companies has been conducted to help clients understand the wider business environment as well as the strengths and weaknesses of key industry players. Data is qualitatively analyzed to categorize companies as pure play, category-focused, industry-focused, and diversified; it is quantitatively analyzed to categorize companies as dominant, leading, strong, tentative, and weak.

Research Analyst Overview

The market encompasses the provision of advanced distillation systems designed to purify water and various industrial liquids. These distillation systems employ vapor compression technology, which involves the evaporation of water under pressure, followed by the condensation of the resulting steam to produce pure water. The demand for vapor compression distillers is driven by the scarcity and contamination of clean water sources, as well as the increasing industrialization and energy efficiency requirements across numerous industries. Impurities in water and industrial liquids can pose significant challenges for businesses and organizations. Desalination plants, for instance, rely on distillation technology to produce freshwater from seawater.

Moreover, in the pharmaceutical industry, pure water is essential for drug formulations, injections, and laboratory testing. Similarly, the food and beverage processing sectors require water purification to maintain product quality and ensure consumer safety. Vapor compression distillers offer several advantages over traditional distillation methods. They are more energy-efficient due to the recycling of condensation heat back into the distillation process. Moreover, these systems can be automated and integrated with IoT capabilities, enabling remote monitoring and control. Renewable energy sources, such as solar or wind power, can also be employed to power vapor compression distillers, further reducing operating costs and environmental impact.

Furthermore, advancements in technology have led to the development of thermocompression distillers, which combine vapor compression and thermocompression techniques to enhance efficiency and reduce energy consumption. Thermocompression distillers operate at higher pressures and temperatures, enabling the separation of components with close boiling points that are difficult to separate using conventional distillation methods. Despite the numerous benefits, the installation costs and maintenance requirements of vapor compression distillers can be significant. However, the outsourcing of water treatment services and desktop outsourcing In the distillation market have emerged as viable solutions for businesses seeking to minimize capital expenditures and focus on their core competencies.

Moreover, the market is characterized by a competitive environment, with numerous players vying for market share. Industry developments and dynamics continue to shape the market, with companies investing in research and development to improve efficiency, reduce costs, and expand their product offerings. The market is expected to grow steadily, driven by the increasing demand for clean water and the need for efficient, cost-effective purification solutions across various industries.

Market Scope

Report Coverage

Details

Page number

168

Base year

2023

Historic period

2018-2022

Forecast period

2024-2028

Growth momentum & CAGR

Accelerate at a CAGR of 6.2%

Market growth 2024-2028

USD 543.67 million

Market structure

Fragmented

YoY growth 2023-2024(%)

5.36

Key countries

US, China, India, Germany, and UK

Competitive landscape

Leading Companies, market growth and forecasting, Market Positioning of Companies, Competitive Strategies, and Industry Risks

Request Free Sample

What are the Key Data Covered in this Market Research and Growth Report?

  • CAGR of the industry during the forecast period
  • Detailed information on factors that will drive the growth and forecasting between 2024 and 2028
  • Precise estimation of the size of the market and its contribution of the industry in focus to the parent market
  • Accurate predictions about upcoming growth and trends and changes in consumer behaviour
  • Growth of the market across APAC, Europe, North America, Middle East and Africa, and South America
  • Thorough analysis of the market's competitive landscape and detailed information about companies
  • Comprehensive analysis of factors that will challenge the market growth of industry companies

We can help! Our analysts can customize this market research report to meet your requirements.

Get in touch

1 Executive Summary

  • 1.1 Market overview
    • Exhibit 01: Executive Summary – Chart on Market Overview
    • Exhibit 02: Executive Summary – Data Table on Market Overview
    • Exhibit 03: Executive Summary – Chart on Global Market Characteristics
    • Exhibit 04: Executive Summary – Chart on Market by Geography
    • Exhibit 05: Executive Summary – Chart on Market Segmentation by Technology
    • Exhibit 06: Executive Summary – Chart on Market Segmentation by Application
    • Exhibit 07: Executive Summary – Chart on Incremental Growth
    • Exhibit 08: Executive Summary – Data Table on Incremental Growth
    • Exhibit 09: Executive Summary – Chart on Vendor Market Positioning

2 Market Landscape

  • 2.1 Market ecosystem
    • Exhibit 10: Parent market
    • Exhibit 11: Market Characteristics

3 Market Sizing

  • 3.1 Market definition
    • Exhibit 12: Offerings of vendors included in the market definition
  • 3.2 Market segment analysis
    • Exhibit 13: Market segments
  • 3.3 Market size 2023
    • 3.4 Market outlook: Forecast for 2023-2028
      • Exhibit 14: Chart on Global - Market size and forecast 2023-2028 ($ million)
      • Exhibit 15: Data Table on Global - Market size and forecast 2023-2028 ($ million)
      • Exhibit 16: Chart on Global Market: Year-over-year growth 2023-2028 (%)
      • Exhibit 17: Data Table on Global Market: Year-over-year growth 2023-2028 (%)

    4 Historic Market Size

    • 4.1 Global vapor compression distiller market 2018 - 2022
      • Exhibit 18: Historic Market Size – Data Table on global vapor compression distiller market 2018 - 2022 ($ million)
    • 4.2 Technology Segment Analysis 2018 - 2022
      • Exhibit 19: Historic Market Size – Technology Segment 2018 - 2022 ($ million)
    • 4.3 Application Segment Analysis 2018 - 2022
      • Exhibit 20: Historic Market Size – Application Segment 2018 - 2022 ($ million)
    • 4.4 Geography Segment Analysis 2018 - 2022
      • Exhibit 21: Historic Market Size – Geography Segment 2018 - 2022 ($ million)
    • 4.5 Country Segment Analysis 2018 - 2022
      • Exhibit 22: Historic Market Size – Country Segment 2018 - 2022 ($ million)

    5 Five Forces Analysis

    • 5.1 Five forces summary
      • Exhibit 23: Five forces analysis - Comparison between 2023 and 2028
    • 5.2 Bargaining power of buyers
      • Exhibit 24: Chart on Bargaining power of buyers – Impact of key factors 2023 and 2028
    • 5.3 Bargaining power of suppliers
      • Exhibit 25: Bargaining power of suppliers – Impact of key factors in 2023 and 2028
    • 5.4 Threat of new entrants
      • Exhibit 26: Threat of new entrants – Impact of key factors in 2023 and 2028
    • 5.5 Threat of substitutes
      • Exhibit 27: Threat of substitutes – Impact of key factors in 2023 and 2028
    • 5.6 Threat of rivalry
      • Exhibit 28: Threat of rivalry – Impact of key factors in 2023 and 2028
    • 5.7 Market condition
      • Exhibit 29: Chart on Market condition - Five forces 2023 and 2028

    6 Market Segmentation by Technology

    • 6.1 Market segments
      • Exhibit 30: Chart on Technology - Market share 2023-2028 (%)
      • Exhibit 31: Data Table on Technology - Market share 2023-2028 (%)
    • 6.2 Comparison by Technology
      • Exhibit 32: Chart on Comparison by Technology
      • Exhibit 33: Data Table on Comparison by Technology
    • 6.3 Mechanical vapor compression - Market size and forecast 2023-2028
      • Exhibit 34: Chart on Mechanical vapor compression - Market size and forecast 2023-2028 ($ million)
      • Exhibit 35: Data Table on Mechanical vapor compression - Market size and forecast 2023-2028 ($ million)
      • Exhibit 36: Chart on Mechanical vapor compression - Year-over-year growth 2023-2028 (%)
      • Exhibit 37: Data Table on Mechanical vapor compression - Year-over-year growth 2023-2028 (%)
    • 6.4 Thermal vapor compression - Market size and forecast 2023-2028
      • Exhibit 38: Chart on Thermal vapor compression - Market size and forecast 2023-2028 ($ million)
      • Exhibit 39: Data Table on Thermal vapor compression - Market size and forecast 2023-2028 ($ million)
      • Exhibit 40: Chart on Thermal vapor compression - Year-over-year growth 2023-2028 (%)
      • Exhibit 41: Data Table on Thermal vapor compression - Year-over-year growth 2023-2028 (%)
    • 6.5 Market opportunity by Technology
      • Exhibit 42: Market opportunity by Technology ($ million)
      • Exhibit 43: Data Table on Market opportunity by Technology ($ million)

    7 Market Segmentation by Application

    • 7.1 Market segments
      • Exhibit 44: Chart on Application - Market share 2023-2028 (%)
      • Exhibit 45: Data Table on Application - Market share 2023-2028 (%)
    • 7.2 Comparison by Application
      • Exhibit 46: Chart on Comparison by Application
      • Exhibit 47: Data Table on Comparison by Application
    • 7.3 Pharmaceutical - Market size and forecast 2023-2028
      • Exhibit 48: Chart on Pharmaceutical - Market size and forecast 2023-2028 ($ million)
      • Exhibit 49: Data Table on Pharmaceutical - Market size and forecast 2023-2028 ($ million)
      • Exhibit 50: Chart on Pharmaceutical - Year-over-year growth 2023-2028 (%)
      • Exhibit 51: Data Table on Pharmaceutical - Year-over-year growth 2023-2028 (%)
    • 7.4 Food industry - Market size and forecast 2023-2028
      • Exhibit 52: Chart on Food industry - Market size and forecast 2023-2028 ($ million)
      • Exhibit 53: Data Table on Food industry - Market size and forecast 2023-2028 ($ million)
      • Exhibit 54: Chart on Food industry - Year-over-year growth 2023-2028 (%)
      • Exhibit 55: Data Table on Food industry - Year-over-year growth 2023-2028 (%)
    • 7.5 Chemical industry - Market size and forecast 2023-2028
      • Exhibit 56: Chart on Chemical industry - Market size and forecast 2023-2028 ($ million)
      • Exhibit 57: Data Table on Chemical industry - Market size and forecast 2023-2028 ($ million)
      • Exhibit 58: Chart on Chemical industry - Year-over-year growth 2023-2028 (%)
      • Exhibit 59: Data Table on Chemical industry - Year-over-year growth 2023-2028 (%)
    • 7.6 Others - Market size and forecast 2023-2028
      • Exhibit 60: Chart on Others - Market size and forecast 2023-2028 ($ million)
      • Exhibit 61: Data Table on Others - Market size and forecast 2023-2028 ($ million)
      • Exhibit 62: Chart on Others - Year-over-year growth 2023-2028 (%)
      • Exhibit 63: Data Table on Others - Year-over-year growth 2023-2028 (%)
    • 7.7 Market opportunity by Application
      • Exhibit 64: Market opportunity by Application ($ million)
      • Exhibit 65: Data Table on Market opportunity by Application ($ million)

    8 Customer Landscape

    • 8.1 Customer landscape overview
      • Exhibit 66: Analysis of price sensitivity, lifecycle, customer purchase basket, adoption rates, and purchase criteria

    9 Geographic Landscape

    • 9.1 Geographic segmentation
      • Exhibit 67: Chart on Market share by geography 2023-2028 (%)
      • Exhibit 68: Data Table on Market share by geography 2023-2028 (%)
    • 9.2 Geographic comparison
      • Exhibit 69: Chart on Geographic comparison
      • Exhibit 70: Data Table on Geographic comparison
    • 9.3 APAC - Market size and forecast 2023-2028
      • Exhibit 71: Chart on APAC - Market size and forecast 2023-2028 ($ million)
      • Exhibit 72: Data Table on APAC - Market size and forecast 2023-2028 ($ million)
      • Exhibit 73: Chart on APAC - Year-over-year growth 2023-2028 (%)
      • Exhibit 74: Data Table on APAC - Year-over-year growth 2023-2028 (%)
    • 9.4 Europe - Market size and forecast 2023-2028
      • Exhibit 75: Chart on Europe - Market size and forecast 2023-2028 ($ million)
      • Exhibit 76: Data Table on Europe - Market size and forecast 2023-2028 ($ million)
      • Exhibit 77: Chart on Europe - Year-over-year growth 2023-2028 (%)
      • Exhibit 78: Data Table on Europe - Year-over-year growth 2023-2028 (%)
    • 9.5 North America - Market size and forecast 2023-2028
      • Exhibit 79: Chart on North America - Market size and forecast 2023-2028 ($ million)
      • Exhibit 80: Data Table on North America - Market size and forecast 2023-2028 ($ million)
      • Exhibit 81: Chart on North America - Year-over-year growth 2023-2028 (%)
      • Exhibit 82: Data Table on North America - Year-over-year growth 2023-2028 (%)
    • 9.6 Middle East and Africa - Market size and forecast 2023-2028
      • Exhibit 83: Chart on Middle East and Africa - Market size and forecast 2023-2028 ($ million)
      • Exhibit 84: Data Table on Middle East and Africa - Market size and forecast 2023-2028 ($ million)
      • Exhibit 85: Chart on Middle East and Africa - Year-over-year growth 2023-2028 (%)
      • Exhibit 86: Data Table on Middle East and Africa - Year-over-year growth 2023-2028 (%)
    • 9.7 South America - Market size and forecast 2023-2028
      • Exhibit 87: Chart on South America - Market size and forecast 2023-2028 ($ million)
      • Exhibit 88: Data Table on South America - Market size and forecast 2023-2028 ($ million)
      • Exhibit 89: Chart on South America - Year-over-year growth 2023-2028 (%)
      • Exhibit 90: Data Table on South America - Year-over-year growth 2023-2028 (%)
    • 9.8 China - Market size and forecast 2023-2028
      • Exhibit 91: Chart on China - Market size and forecast 2023-2028 ($ million)
      • Exhibit 92: Data Table on China - Market size and forecast 2023-2028 ($ million)
      • Exhibit 93: Chart on China - Year-over-year growth 2023-2028 (%)
      • Exhibit 94: Data Table on China - Year-over-year growth 2023-2028 (%)
    • 9.9 US - Market size and forecast 2023-2028
      • Exhibit 95: Chart on US - Market size and forecast 2023-2028 ($ million)
      • Exhibit 96: Data Table on US - Market size and forecast 2023-2028 ($ million)
      • Exhibit 97: Chart on US - Year-over-year growth 2023-2028 (%)
      • Exhibit 98: Data Table on US - Year-over-year growth 2023-2028 (%)
    • 9.10 India - Market size and forecast 2023-2028
      • Exhibit 99: Chart on India - Market size and forecast 2023-2028 ($ million)
      • Exhibit 100: Data Table on India - Market size and forecast 2023-2028 ($ million)
      • Exhibit 101: Chart on India - Year-over-year growth 2023-2028 (%)
      • Exhibit 102: Data Table on India - Year-over-year growth 2023-2028 (%)
    • 9.11 Germany - Market size and forecast 2023-2028
      • Exhibit 103: Chart on Germany - Market size and forecast 2023-2028 ($ million)
      • Exhibit 104: Data Table on Germany - Market size and forecast 2023-2028 ($ million)
      • Exhibit 105: Chart on Germany - Year-over-year growth 2023-2028 (%)
      • Exhibit 106: Data Table on Germany - Year-over-year growth 2023-2028 (%)
    • 9.12 UK - Market size and forecast 2023-2028
      • Exhibit 107: Chart on UK - Market size and forecast 2023-2028 ($ million)
      • Exhibit 108: Data Table on UK - Market size and forecast 2023-2028 ($ million)
      • Exhibit 109: Chart on UK - Year-over-year growth 2023-2028 (%)
      • Exhibit 110: Data Table on UK - Year-over-year growth 2023-2028 (%)
    • 9.13 Market opportunity by geography
      • Exhibit 111: Market opportunity by geography ($ million)
      • Exhibit 112: Data Tables on Market opportunity by geography ($ million)

    10 Drivers, Challenges, and Trends

    • 10.1 Market drivers
      • 10.2 Market challenges
        • 10.3 Impact of drivers and challenges
          • Exhibit 113: Impact of drivers and challenges in 2023 and 2028
        • 10.4 Market trends

          11 Vendor Landscape

          • 11.1 Overview
            • 11.2 Vendor landscape
              • Exhibit 114: Overview on Criticality of inputs and Factors of differentiation
            • 11.3 Landscape disruption
              • Exhibit 115: Overview on factors of disruption
            • 11.4 Industry risks
              • Exhibit 116: Impact of key risks on business

            12 Vendor Analysis

            • 12.1 Vendors covered
              • Exhibit 117: Vendors covered
            • 12.2 Market positioning of vendors
              • Exhibit 118: Matrix on vendor position and classification
            • 12.3 Alfa Laval AB
              • Exhibit 119: Alfa Laval AB - Overview
              • Exhibit 120: Alfa Laval AB - Business segments
              • Exhibit 121: Alfa Laval AB - Key news
              • Exhibit 122: Alfa Laval AB - Key offerings
              • Exhibit 123: Alfa Laval AB - Segment focus
            • 12.4 Aqua Chem Inc.
              • Exhibit 124: Aqua Chem Inc. - Overview
              • Exhibit 125: Aqua Chem Inc. - Product / Service
              • Exhibit 126: Aqua Chem Inc. - Key offerings
            • 12.5 BRAM COR S.p.A.
              • Exhibit 127: BRAM COR S.p.A. - Overview
              • Exhibit 128: BRAM COR S.p.A. - Product / Service
              • Exhibit 129: BRAM COR S.p.A. - Key offerings
            • 12.6 Chart Industries Inc.
              • Exhibit 130: Chart Industries Inc. - Overview
              • Exhibit 131: Chart Industries Inc. - Business segments
              • Exhibit 132: Chart Industries Inc. - Key offerings
              • Exhibit 133: Chart Industries Inc. - Segment focus
            • 12.7 Chutian Technology Co. Ltd.
              • Exhibit 134: Chutian Technology Co. Ltd. - Overview
              • Exhibit 135: Chutian Technology Co. Ltd. - Product / Service
              • Exhibit 136: Chutian Technology Co. Ltd. - Key offerings
            • 12.8 GEA Group AG
              • Exhibit 137: GEA Group AG - Overview
              • Exhibit 138: GEA Group AG - Business segments
              • Exhibit 139: GEA Group AG - Key offerings
              • Exhibit 140: GEA Group AG - Segment focus
            • 12.9 Genist Technocracy Pvt Ltd
              • Exhibit 141: Genist Technocracy Pvt Ltd - Overview
              • Exhibit 142: Genist Technocracy Pvt Ltd - Product / Service
              • Exhibit 143: Genist Technocracy Pvt Ltd - Key offerings
            • 12.10 Grundfos Holding AS
              • Exhibit 144: Grundfos Holding AS - Overview
              • Exhibit 145: Grundfos Holding AS - Product / Service
              • Exhibit 146: Grundfos Holding AS - Key news
              • Exhibit 147: Grundfos Holding AS - Key offerings
            • 12.11 Kalina Engineering Pvt Ltd.
              • Exhibit 148: Kalina Engineering Pvt Ltd. - Overview
              • Exhibit 149: Kalina Engineering Pvt Ltd. - Product / Service
              • Exhibit 150: Kalina Engineering Pvt Ltd. - Key offerings
            • 12.12 LPR Global Inc.
              • Exhibit 151: LPR Global Inc. - Overview
              • Exhibit 152: LPR Global Inc. - Product / Service
              • Exhibit 153: LPR Global Inc. - Key offerings
            • 12.13 Paul Mueller Co. Inc.
              • Exhibit 154: Paul Mueller Co. Inc. - Overview
              • Exhibit 155: Paul Mueller Co. Inc. - Business segments
              • Exhibit 156: Paul Mueller Co. Inc. - Key offerings
              • Exhibit 157: Paul Mueller Co. Inc. - Segment focus
            • 12.14 Puretech
              • Exhibit 158: Puretech - Overview
              • Exhibit 159: Puretech - Product / Service
              • Exhibit 160: Puretech - Key offerings
            • 12.15 RAG Stiftung
              • Exhibit 161: RAG Stiftung - Overview
              • Exhibit 162: RAG Stiftung - Product / Service
              • Exhibit 163: RAG Stiftung - Key offerings
            • 12.16 wemacequipment.com
              • Exhibit 164: wemacequipment.com - Overview
              • Exhibit 165: wemacequipment.com - Product / Service
              • Exhibit 166: wemacequipment.com - Key offerings
            • 12.17 Zibo Huazhou Pharmaceutical Equipment Co. Ltd.
              • Exhibit 167: Zibo Huazhou Pharmaceutical Equipment Co. Ltd. - Overview
              • Exhibit 168: Zibo Huazhou Pharmaceutical Equipment Co. Ltd. - Product / Service
              • Exhibit 169: Zibo Huazhou Pharmaceutical Equipment Co. Ltd. - Key offerings

            13 Appendix

            • 13.1 Scope of the report
              • 13.2 Inclusions and exclusions checklist
                • Exhibit 170: Inclusions checklist
                • Exhibit 171: Exclusions checklist
              • 13.3 Currency conversion rates for US$
                • Exhibit 172: Currency conversion rates for US$
              • 13.4 Research methodology
                • Exhibit 173: Research methodology
                • Exhibit 174: Validation techniques employed for market sizing
                • Exhibit 175: Information sources
              • 13.5 List of abbreviations
                • Exhibit 176: List of abbreviations

              Research Methodology

              Technavio presents a detailed picture of the market by way of study, synthesis, and summation of data from multiple sources. The analysts have presented the various facets of the market with a particular focus on identifying the key industry influencers. The data thus presented is comprehensive, reliable, and the result of extensive research, both primary and secondary.

              INFORMATION SOURCES

              Primary sources

              • Manufacturers and suppliers
              • Channel partners
              • Industry experts
              • Strategic decision makers

              Secondary sources

              • Industry journals and periodicals
              • Government data
              • Financial reports of key industry players
              • Historical data
              • Press releases

              DATA ANALYSIS

              Data Synthesis

              • Collation of data
              • Estimation of key figures
              • Analysis of derived insights

              Data Validation

              • Triangulation with data models
              • Reference against proprietary databases
              • Corroboration with industry experts

              REPORT WRITING

              Qualitative

              • Market drivers
              • Market challenges
              • Market trends
              • Five forces analysis

              Quantitative

              • Market size and forecast
              • Market segmentation
              • Geographical insights
              • Competitive landscape

              Interested in this report?

              Get your sample now to see our research methodology and insights!

              Download Now

              Frequently Asked Questions

              Vapor Compression Distiller market growth will increase by $ 543.67 mn during 2024-2028.

              The Vapor Compression Distiller market is expected to grow at a CAGR of 6.2% during 2024-2028.

              Vapor Compression Distiller market is segmented by Technology( Mechanical vapor compression, Thermal vapor compression) Application( Pharmaceutical, Food industry, Chemical industry, Others)

              Alfa Laval AB, Aqua Chem Inc., BRAM COR S.p.A., Chart Industries Inc., Chutian Technology Co. Ltd., GEA Group AG, Genist Technocracy Pvt Ltd, Grundfos Holding AS, Kalina Engineering Pvt Ltd., LPR Global Inc., Paul Mueller Co. Inc., Puretech, RAG Stiftung, wemacequipment.com, Zibo Huazhou Pharmaceutical Equipment Co. Ltd. are a few of the key vendors in the Vapor Compression Distiller market.

              APAC will register the highest growth rate of 40% among the other regions. Therefore, the Vapor Compression Distiller market in APAC is expected to garner significant business opportunities for the vendors during the forecast period.

              US, China, India, Germany, UK

              • Increase in population and rise in demand for potable waterThe rising global population and increasing demand for potable water are the key factors that drive the growth of the global vapor compression distiller market. According to the World Bank Group is the driving factor this market.
              • by 2050 is the driving factor this market.
              • the global population is anticipated to reach 9.73 billion is the driving factor this market.
              • while only 2.2 billion people worldwide had access to safe potable water by the first half of 2022. Globally is the driving factor this market.
              • freshwater reserves are unevenly distributed is the driving factor this market.
              • and therefore is the driving factor this market.
              • the demand for desalination will witness an increase over the forecast period. Most of the water available in nature is not considered fit for consumption or potable as it contains various contaminants is the driving factor this market.
              • such as factory waste is the driving factor this market.
              • pollutants is the driving factor this market.
              • and pathogenic bacteria and microorganisms. The scarcity of safe is the driving factor this market.
              • potable water has created the demand for vapor compression distillers for recovering potable water. The increasing demand for clean water is mainly attributed to the rise in population and dietary changes. Clean water is extensively used in the global agricultural sector. The demand for water in the industrial and energy sectors accounts for around 20% of the global demand. For other purposes is the driving factor this market.
              • such as raw materials for solvent processing is the driving factor this market.
              • steam generation is the driving factor this market.
              • and heating and cooling systems is the driving factor this market.
              • the demand for water accounts for around 10%. The fast-paced depletion of freshwater resources across the world is driving the need for stringent regulations on water use and consumption and its discharge. As a result of the widespread global scarcity of water is the driving factor this market.
              • industries and organizations are obliged to treat and recycle wastewater before discharging it. Coastal communities and cities are increasingly depending on the desalination of seawater to meet their drinking water requirements is the driving factor this market.
              • while inland groundwater resources are witnessing a rising tendency to become brackish over a period of time. Urbanization is the driving factor this market.
              • which is one of the most important demographic trends is the driving factor this market.
              • also drives the demand for clean water. According to the World Bank Group is the driving factor this market.
              • the population in urban areas is expected to reach 6.3 billion by 2050 is the driving factor this market.
              • accounting for 70% of the global population. In order to meet the needs of the surging population is the driving factor this market.
              • the amount of potable and clean water is the driving factor this market.
              • which can be obtained through desalination is the driving factor this market.
              • should increase. Desalination of water is gaining traction as one of the important methods to meet the rising need for freshwater for various domestic is the driving factor this market.
              • industrial is the driving factor this market.
              • and agricultural purposes. The water desalination process is mainly performed on water sources such as seawater is the driving factor this market.
              • brackish water is the driving factor this market.
              • well water is the driving factor this market.
              • surface water is the driving factor this market.
              • wastewater is the driving factor this market.
              • and industrial process water. Thus is the driving factor this market.
              • the increasing global population is the driving factor this market.
              • coupled with rapid urbanization is the driving factor this market.
              • industrialization is the driving factor this market.
              • and rising levels of pollution is the driving factor this market.
              • along with the high demand for clean and potable water is the driving factor this market.
              • is expected to increase the demand for vapor compression distillers is the driving factor this market.
              • which is expected to boost the growth of the global vapor compression distiller market during the forecast period.  is the driving factor this market.

              The Vapor Compression Distiller market vendors should focus on grabbing business opportunities from the Mechanical vapor compression segment as it accounted for the largest market share in the base year.