Vacuum Cleaner Market Analysis, Size, and Forecast 2026-2030: North America (US, Canada, and Mexico), Europe (Germany, UK, and France), APAC (China, India, and Japan), Middle East and Africa (Saudi Arabia, UAE, and South Africa), South America (Brazil, Argentina, and Colombia), and Rest of World (ROW)

Vacuum Cleaner Market Analysis, Size, and Forecast 2026-2030:
North America (US, Canada, and Mexico), Europe (Germany, UK, and France), APAC (China, India, and Japan), Middle East and Africa (Saudi Arabia, UAE, and South Africa), South America (Brazil, Argentina, and Colombia), and Rest of World (ROW)

Published: Dec 2025 282 Pages SKU: IRTNTR76337

Market Overview at a Glance

$12.92 B
Market Opportunity
13.9%
CAGR 2025 - 2030
41.2%
North America Growth
$6.38 B
Residential segment 2024

Vacuum Cleaner Market Size 2026-2030

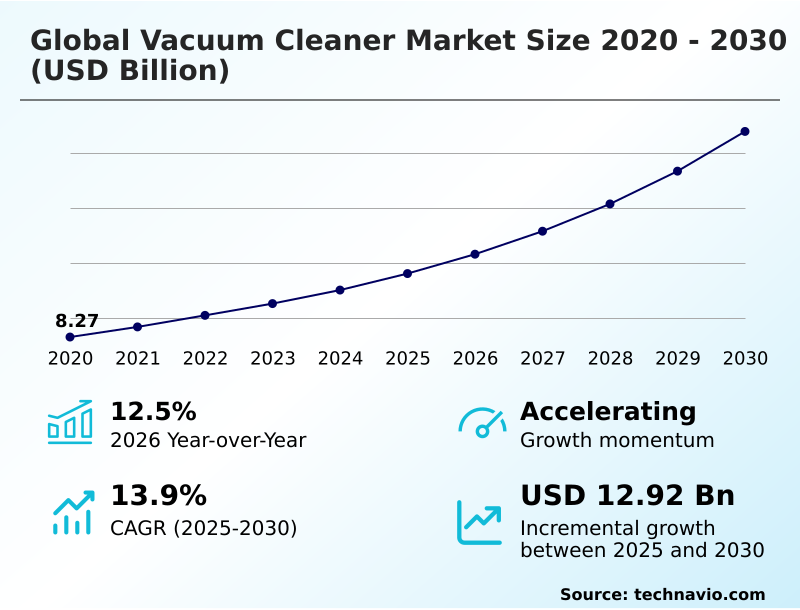
The vacuum cleaner market size is valued to increase by USD 12.92 billion, at a CAGR of 13.9% from 2025 to 2030. Growing number of smart cities will drive the vacuum cleaner market.

Major Market Trends & Insights

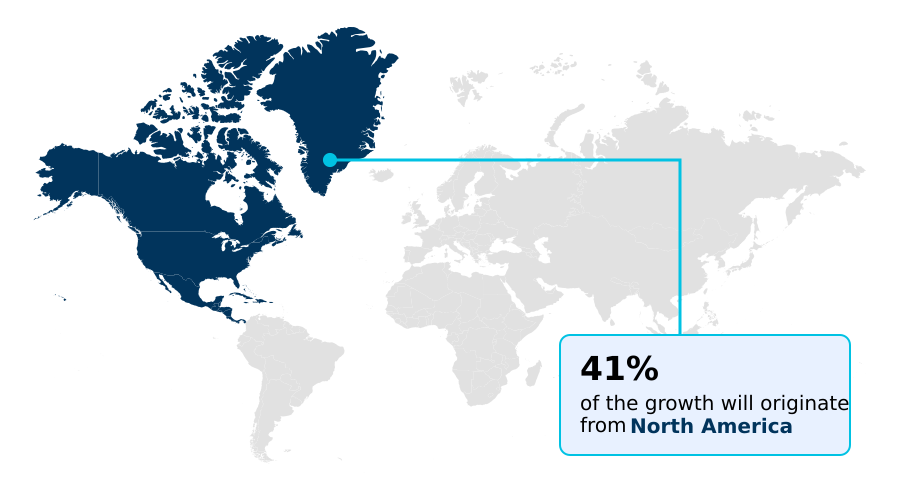
  • North America dominated the market and accounted for a 41.2% growth during the forecast period.
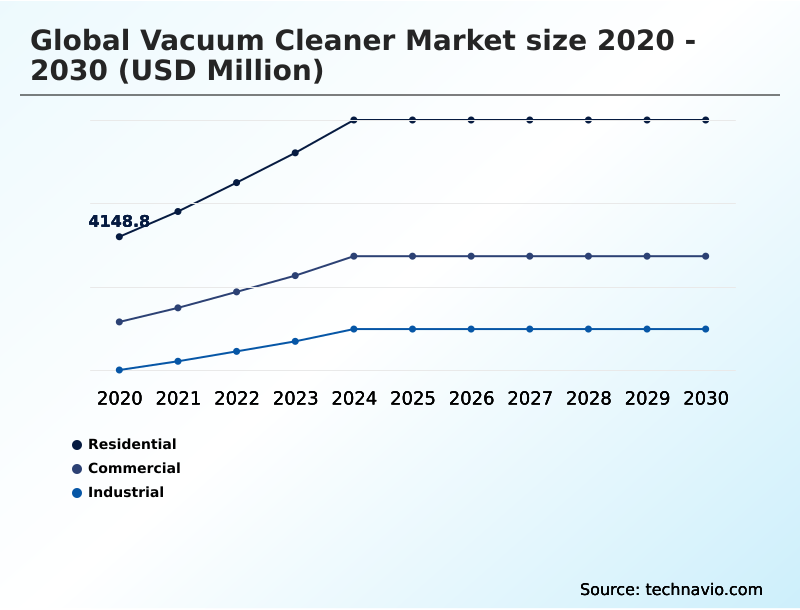
  • By Application - Residential segment was valued at USD 6.38 billion in 2024
  • By Distribution Channel - Offline segment accounted for the largest market revenue share in 2024

Market Size & Forecast

  • Market Opportunities: USD 18.69 billion
  • Market Future Opportunities: USD 12.92 billion
  • CAGR from 2025 to 2030 : 13.9%

Market Summary

  • The Vacuum Cleaner Market is undergoing a significant transformation, driven by consumer demand for convenience and heightened hygiene awareness. Innovations in cordless stick vacuum technology and the increasing sophistication of robotic vacuum cleaner models are reshaping household cleaning standards.
  • Core advancements include the integration of brushless digital motor systems for enhanced power and efficiency, alongside HEPA filtration to improve indoor air quality. The market is also seeing a shift towards intelligent automation, where devices with LiDAR navigation sensor and AI-powered object recognition capabilities offer a hands-free cleaning experience.
  • A key business scenario involves supply chain optimization for manufacturers of these complex devices. They must manage a global network of specialized suppliers for components like fast-charging battery systems and advanced sensor suites. The challenge lies in balancing the high cost of these technologies against intense price pressure from competitors, all while ensuring whole-machine filtration and robust performance.
  • This dynamic forces companies to innovate not only in product design, such as developing an effective anti-tangle brush roll for pet hair removal, but also in their operational models to maintain profitability in a competitive landscape defined by rapid technological evolution.

What will be the Size of the Vacuum Cleaner Market during the forecast period?

Get Key Insights on Market Forecast (PDF) Request Free Sample

How is the Vacuum Cleaner Market Segmented?

The vacuum cleaner industry research report provides comprehensive data (region-wise segment analysis), with forecasts and estimates in "USD million" for the period 2026-2030, as well as historical data from 2020-2024 for the following segments.

  • Application
    • Residential
    • Commercial
    • Industrial
  • Distribution channel
    • Offline
    • Online
  • Type
    • Corded
    • Cordless
  • Geography
    • North America
      • US
      • Canada
      • Mexico
    • Europe
      • Germany
      • UK
      • France
    • APAC
      • China
      • India
      • Japan
    • Middle East and Africa
      • Saudi Arabia
      • UAE
      • South Africa
    • South America
      • Brazil
      • Argentina
      • Colombia
    • Rest of World (ROW)

By Application Insights

The residential segment is estimated to witness significant growth during the forecast period.

The residential segment is a primary driver of market growth, fueled by the adoption of vacuums as a standard household appliance.

This expansion is increasingly shaped by demand for smart home convenience, where the integration of a robotic vacuum cleaner is a key component.

Health and hygiene awareness, particularly concerning indoor air quality improvement, is a significant motivator, prompting investment in models with advanced filtration.

The trend toward intelligent cleaning is evident, with robotic vacuums featuring AI-powered object recognition now achieving over 90% accuracy in obstacle avoidance.

This demand for a hands-free cleaning experience is driving innovation in multi-surface cleaning capabilities and systems like the PowerSpin Roller Mop, making these devices more effective and appealing to a broader consumer base.

Request Free Sample

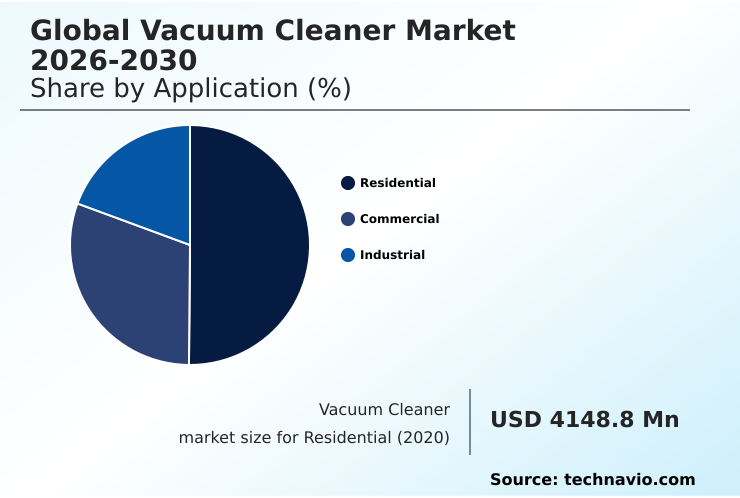
The Residential segment was valued at USD 6.38 billion in 2024 and showed a gradual increase during the forecast period.

Request Free Sample

Regional Analysis

North America is estimated to contribute 41.2% to the growth of the global market during the forecast period.Technavio’s analysts have elaborately explained the regional trends and drivers that shape the market during the forecast period.

See How Vacuum Cleaner Market Demand is Rising in North America Request Free Sample

The geographic landscape of the Vacuum Cleaner Market is characterized by varied regional dynamics and adoption rates.

North America currently represents the largest opportunity, accounting for over 41% of the incremental growth, driven by high consumer spending on advanced home technologies like smart home ecosystem integration.

Europe follows, contributing approximately 31% to market expansion, with strong demand for energy-efficient appliances and models featuring quiet operation technology. In APAC, rapid urbanization is fueling demand for compact solutions like the cordless stick vacuum.

A key operational dynamic for companies in these regions is managing distributed service networks; firms leveraging predictive maintenance alerts have reported a 25% improvement in first-time fix rates.

This focus on service efficiency is critical for brands offering sophisticated products with a robotic mopping function and ReactiveAI 2.0 obstacle avoidance, as it directly impacts customer satisfaction across diverse markets from the US to China.

Market Dynamics

Our researchers analyzed the data with 2025 as the base year, along with the key drivers, trends, and challenges. A holistic analysis of drivers will help companies refine their marketing strategies to gain a competitive advantage.

  • The Vacuum Cleaner Market is evolving beyond generic cleaning solutions to address highly specific consumer needs, creating distinct niches for specialized products. For instance, the demand for a robotic vacuum with mopping function is surging among consumers seeking all-in-one floor care automation.
  • Simultaneously, the best cordless stick vacuum cleaner continues to be a top search query, reflecting a preference for lightweight, powerful, and versatile devices. Households with pets are a significant segment, actively seeking a vacuum cleaner for pet hair equipped with an effective vacuum with anti-tangle brush.
  • Health-conscious consumers prioritize an upright vacuum with HEPA filter or a dedicated allergy-friendly vacuum cleaner to manage airborne particles and a vacuum cleaner for dust mites. The canister vacuum for hardwood floors remains a preferred choice for its gentle yet powerful cleaning. For specific demographics, a lightweight vacuum for elderly is essential for usability.
  • The market for fully automated systems is led by the self-emptying robot vacuum cleaner, which minimizes manual intervention. In the B2B space, the commercial wet and dry vacuum and the industrial vacuum for fine dust serve critical roles. Innovations like the bagless vacuum with cyclonic suction and the smart vacuum with voice control are becoming standard.
  • Niche applications are also growing, with consumers looking for a handheld vacuum for car cleaning or a robotic vacuum for multi-level homes. Manufacturers are addressing user experience by engineering models with a quiet operation vacuum for apartments, a vacuum cleaner with long runtime, and a cordless vacuum with automatic docking.
  • This specialization allows brands to command a premium, with specialized pet hair models showing a 15% higher average selling price compared to general-purpose vacuums.

What are the key market drivers leading to the rise in the adoption of Vacuum Cleaner Industry?

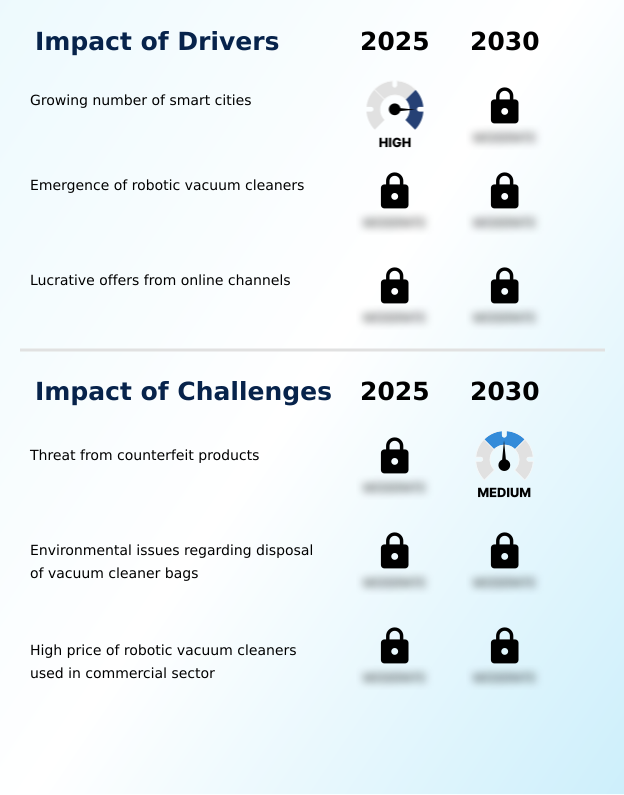
  • The increasing development of smart cities worldwide serves as a key driver for the market's expansion.

  • A primary driver for the market is the growing consumer focus on health and low-maintenance building materials. This has fueled demand for vacuums with advanced dust compression system, which can capture 99.97% of microscopic allergens.
  • This health-consciousness, combined with a rise in pet ownership, propels sales of devices specialized for allergen removal efficiency. The demand for convenience is another significant driver, pushing innovation in bagless vacuum technology and self-emptying station systems.
  • For instance, the latest stations reduce user interaction by up to 90% compared to traditional models.
  • Furthermore, the expansion of online retail channels provides consumers with easy access to a wide range of commercial-grade cleaning equipment, intensifying competition and encouraging manufacturers to innovate.

What are the market trends shaping the Vacuum Cleaner Industry?

  • Social factors, particularly within urban areas, are significantly driving the adoption of robot vacuum cleaners. This development is emerging as a prominent upcoming market trend.

  • The dominant trend reshaping the Vacuum Cleaner Market is the integration of intelligent, autonomous technologies. The adoption of robotic cleaner models with canister vacuum designs is accelerating, with some systems now identifying and avoiding household obstacles with over 95% accuracy. This move towards professional cleaning services is further enhanced by voice control compatibility, allowing for remote smartphone control.
  • Another key trend is the advancement in cordless technology, where new upright vacuum cleaner designs have improved energy efficiency by up to 20%, extending the runtime of devices. This enables high performance in a lightweight and portable design, meeting consumer demand for convenience without sacrificing power. Eco-friendly product design is also gaining traction.

What challenges does the Vacuum Cleaner Industry face during its growth?

  • The proliferation of counterfeit products poses a significant threat, challenging the industry's growth and brand integrity.

  • A significant challenge facing the market is intense price competition, which squeezes profit margins, particularly for feature-rich devices. The high cost of R&D for technologies such as advanced sensor suites and proprietary systems creates a difficult balance. Component sourcing presents another hurdle; reliance on specialized suppliers for extended battery runtime can lead to supply chain vulnerabilities.
  • For example, disruptions have been shown to delay production timelines by up to 15%. Furthermore, differentiating products in a crowded field is a constant struggle.
  • While features like a multi-surface cleaning and recyclable components attract consumers, the threat from low-cost manufacturers who can quickly replicate basic functionalities puts pressure on established brands to justify their premium pricing through demonstrable performance and reliability, especially against anti-static flooring solutions.

Exclusive Technavio Analysis on Customer Landscape

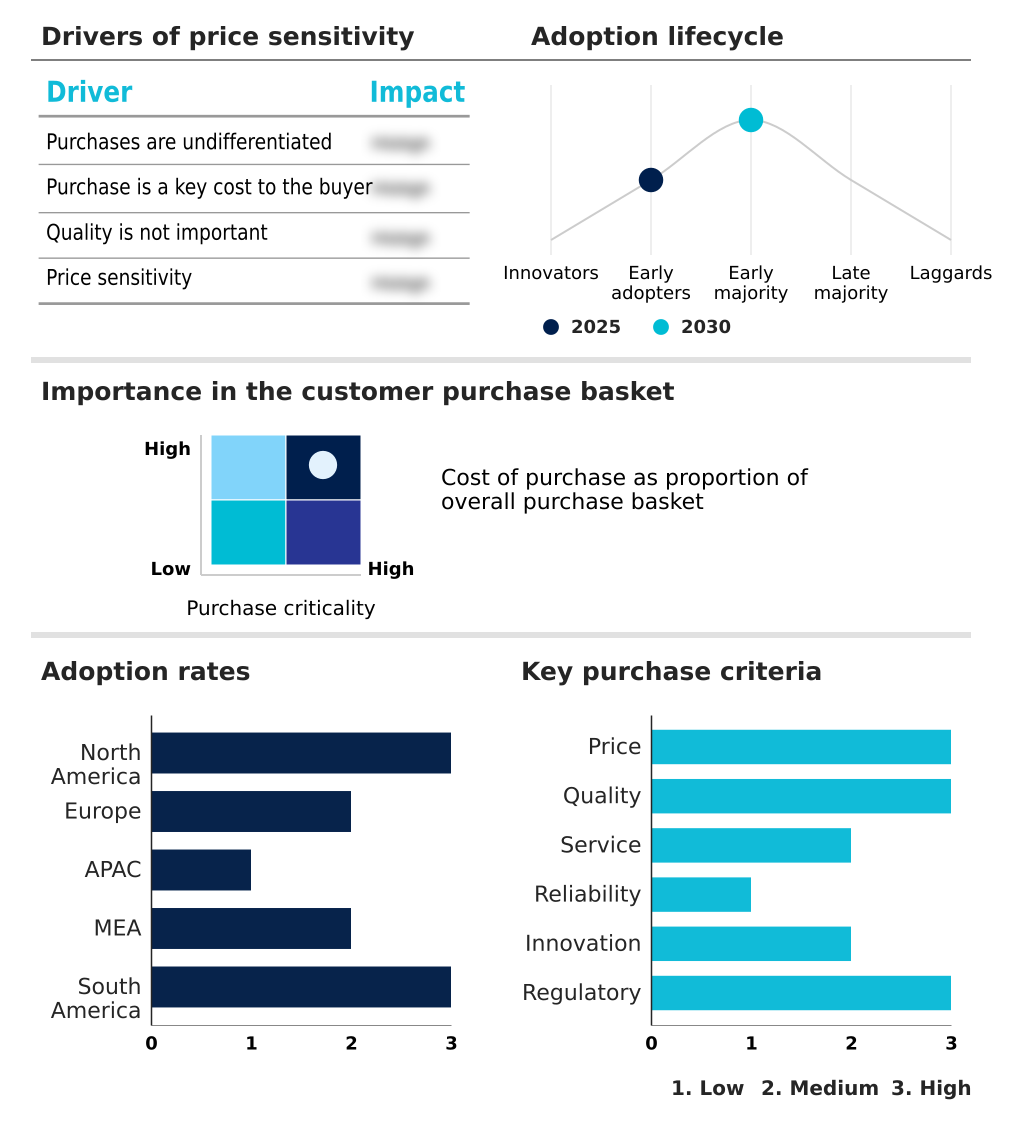
The vacuum cleaner market forecasting report includes the adoption lifecycle of the market, covering from the innovator’s stage to the laggard’s stage. It focuses on adoption rates in different regions based on penetration. Furthermore, the vacuum cleaner market report also includes key purchase criteria and drivers of price sensitivity to help companies evaluate and develop their market growth analysis strategies.

Customer Landscape of Vacuum Cleaner Industry

Competitive Landscape

Companies are implementing various strategies, such as strategic alliances, vacuum cleaner market forecast, partnerships, mergers and acquisitions, geographical expansion, and product/service launches, to enhance their presence in the industry.

AB Electrolux - Analysis reveals a core focus on engineering superior cleaning performance through advanced filtration systems and intelligent, data-driven sensor technology for household applications.

The industry research and growth report includes detailed analyses of the competitive landscape of the market and information about key companies, including:

  • AB Electrolux
  • Beijing Roborock Technology Co. Ltd.
  • BISSELL Inc.
  • Dyson Group Co.
  • Haier Smart Home Co. Ltd.
  • Irobot Corp.
  • KENT RO Systems Ltd.
  • Koninklijke Philips NV
  • LG Electronics Inc.
  • Midea Group Co. Ltd.
  • Miele and Cie. KG
  • Panasonic Holdings Corp.
  • Samsung Electronics Co. Ltd.
  • SharkNinja Operating LLC
  • Stanley Black and Decker Inc.

Qualitative and quantitative analysis of companies has been conducted to help clients understand the wider business environment as well as the strengths and weaknesses of key industry players. Data is qualitatively analyzed to categorize companies as pure play, category-focused, industry-focused, and diversified; it is quantitatively analyzed to categorize companies as dominant, leading, strong, tentative, and weak.

Recent Development and News in Vacuum cleaner market

  • In January 2025, Samsung Electronics Co. Ltd. announced the launch of its Bespoke Jet Bot Combo, a new robotic vacuum and mop featuring advanced AI-powered object recognition and a fully automated self-cleaning and emptying dock.
  • In January 2025, Beijing Roborock Technology Co. Ltd. showcased its new generation of smart home cleaning devices at the Consumer Electronics Show, highlighting advancements in robotic intelligence and seamless integration with smart home ecosystems.
  • In May 2025, Dyson Group Co. announced the global release of the PencilVac, its slimmest and lightest cordless vacuum cleaner, specifically engineered for efficient cleaning in compact urban living spaces.
  • In April 2025, iRobot Corp. announced a strategic partnership with a leading smart home platform to enhance the integration of its Roomba robot vacuums, enabling more sophisticated automation and cross-device routines for users.

Dive into Technavio’s robust research methodology, blending expert interviews, extensive data synthesis, and validated models for unparalleled Vacuum Cleaner Market insights. See full methodology.

Market Scope
Page number 282
Base year 2025
Historic period 2020-2024
Forecast period 2026-2030
Growth momentum & CAGR Accelerate at a CAGR of 13.9%
Market growth 2026-2030 USD 12920.6 million
Market structure Fragmented
YoY growth 2025-2026(%) 12.5%
Key countries US, Canada, Mexico, Germany, UK, France, Italy, Spain, The Netherlands, China, India, Japan, South Korea, Australia, Indonesia, Saudi Arabia, UAE, South Africa, Egypt, Israel, Brazil, Argentina and Colombia
Competitive landscape Leading Companies, Market Positioning of Companies, Competitive Strategies, and Industry Risks

Request Free Sample

Research Analyst Overview

  • The Vacuum Cleaner Market's evolution is defined by rapid technological convergence and a focus on specialized performance. Core product development centers on integrating HEPA filtration and cyclonic suction technology to achieve superior cleaning outcomes. The proliferation of the cordless stick vacuum and the robotic vacuum cleaner highlights a fundamental shift in consumer preferences toward convenience and automation.
  • This is made possible by component-level innovations, such as the brushless digital motor, LiDAR navigation sensor, and AI-powered object recognition. Boardroom decisions are increasingly influenced by the need to secure supply chains for these critical technologies. For instance, companies that established early partnerships for advanced battery cells have seen a 20% reduction in production lead times compared to competitors.
  • Product differentiation is achieved through features like automated dirt disposal, an anti-tangle brush roll, and dust compression system technology. Models are designed for multi-surface cleaning, with advanced versions offering wet and dry vacuum capabilities or a PowerSpin Roller Mop.
  • The competitive landscape is shaped by proprietary systems like DuoClean technology, ReactiveAI 2.0 obstacle avoidance, and the HexaJet motor, alongside user-centric features such as laser dust detection and a self-cleaning brush roll to ensure whole-machine filtration and reliability.

What are the Key Data Covered in this Vacuum Cleaner Market Research and Growth Report?

  • What is the expected growth of the Vacuum Cleaner Market between 2026 and 2030?

    • USD 12.92 billion, at a CAGR of 13.9%

  • What segmentation does the market report cover?

    • The report is segmented by Application (Residential, Commercial, and Industrial), Distribution Channel (Offline, and Online), Type (Corded, and Cordless) and Geography (North America, Europe, APAC, Middle East and Africa, South America)

  • Which regions are analyzed in the report?

    • North America, Europe, APAC, Middle East and Africa and South America

  • What are the key growth drivers and market challenges?

    • Growing number of smart cities, Threat from counterfeit products

  • Who are the major players in the Vacuum Cleaner Market?

    • AB Electrolux, Beijing Roborock Technology Co. Ltd., BISSELL Inc., Dyson Group Co., Haier Smart Home Co. Ltd., Irobot Corp., KENT RO Systems Ltd., Koninklijke Philips NV, LG Electronics Inc., Midea Group Co. Ltd., Miele and Cie. KG, Panasonic Holdings Corp., Samsung Electronics Co. Ltd., SharkNinja Operating LLC and Stanley Black and Decker Inc.

Market Research Insights

  • The market's dynamism is fueled by a shift towards intelligent and automated solutions, with a strong focus on enhancing the user experience. The drive for a hands-free cleaning experience has accelerated the adoption of devices with smart mapping capabilities, which now chart floor plans with 98% accuracy, a significant improvement over earlier generations.
  • Integration with voice assistant platforms has become a key differentiator, with leading models showing a 40% higher user engagement rate compared to non-connected devices. Consumers now expect remote smartphone control for scheduled cleaning sessions and proactive maintenance alerts.
  • This trend is not just about convenience but also efficiency; commercial adoption of robotic cleaners has been shown to reduce manual cleaning labor costs by up to 30%. The emphasis on deep cleaning performance and specialized functions like pet hair pickup and allergen removal efficiency continues to shape product development across all segments.

We can help! Our analysts can customize this vacuum cleaner market research report to meet your requirements.

Get in touch

1. Executive Summary

1.1 Market overview

Executive Summary - Chart on Market Overview
Executive Summary - Data Table on Market Overview
Executive Summary - Chart on Global Market Characteristics
Executive Summary - Chart on Market by Geography
Executive Summary - Chart on Market Segmentation by Application
Executive Summary - Chart on Market Segmentation by Distribution Channel
Executive Summary - Chart on Market Segmentation by Type
Executive Summary - Chart on Incremental Growth
Executive Summary - Data Table on Incremental Growth
Executive Summary - Chart on Company Market Positioning

2. Technavio Analysis

2.1 Analysis of price sensitivity, lifecycle, customer purchase basket, adoption rates, and purchase criteria

2.2 Criticality of inputs and Factors of differentiation

Chart on Overview on criticality of inputs and factors of differentiation

2.3 Factors of disruption

Chart on Overview on factors of disruption

2.4 Impact of drivers and challenges

Chart on Impact of drivers and challenges in 2025 and 2030

3. Market Landscape

3.1 Market ecosystem

Chart on Parent Market
Data Table on - Parent Market

3.2 Market characteristics

Chart on Market characteristics analysis

3.3 Value chain analysis

Chart on Value chain analysis

4. Market Sizing

4.1 Market definition

Data Table on Offerings of companies included in the market definition

4.2 Market segment analysis

Market segments

4.3 Market size 2025

4.4 Market outlook: Forecast for 2025-2030

Chart on Global - Market size and forecast 2025-2030 ($ million)
Data Table on Global - Market size and forecast 2025-2030 ($ million)
Chart on Global Market: Year-over-year growth 2025-2030 (%)
Data Table on Global Market: Year-over-year growth 2025-2030 (%)

5. Historic Market Size

5.1 Global Vacuum Cleaner Market 2020 - 2024

Historic Market Size - Data Table on Global Vacuum Cleaner Market 2020 - 2024 ($ million)

5.2 Application segment analysis 2020 - 2024

Historic Market Size - Application Segment 2020 - 2024 ($ million)

5.3 Distribution Channel segment analysis 2020 - 2024

Historic Market Size - Distribution Channel Segment 2020 - 2024 ($ million)

5.4 Type segment analysis 2020 - 2024

Historic Market Size - Type Segment 2020 - 2024 ($ million)

5.5 Geography segment analysis 2020 - 2024

Historic Market Size - Geography Segment 2020 - 2024 ($ million)

5.6 Country segment analysis 2020 - 2024

Historic Market Size - Country Segment 2020 - 2024 ($ million)

6. Qualitative Analysis

6.1 The AI impact on global vacuum cleaner market

7. Five Forces Analysis

7.1 Five forces summary

Five forces analysis - Comparison between 2025 and 2030

7.2 Bargaining power of buyers

Bargaining power of buyers - Impact of key factors 2025 and 2030

7.3 Bargaining power of suppliers

Bargaining power of suppliers - Impact of key factors in 2025 and 2030

7.4 Threat of new entrants

Threat of new entrants - Impact of key factors in 2025 and 2030

7.5 Threat of substitutes

Threat of substitutes - Impact of key factors in 2025 and 2030

7.6 Threat of rivalry

Threat of rivalry - Impact of key factors in 2025 and 2030

7.7 Market condition

Chart on Market condition - Five forces 2025 and 2030

8. Market Segmentation by Application

8.1 Market segments

Chart on Application - Market share 2025-2030 (%)
Data Table on Application - Market share 2025-2030 (%)

8.2 Comparison by Application

Chart on Comparison by Application
Data Table on Comparison by Application

8.3 Residential - Market size and forecast 2025-2030

Chart on Residential - Market size and forecast 2025-2030 ($ million)
Data Table on Residential - Market size and forecast 2025-2030 ($ million)
Chart on Residential - Year-over-year growth 2025-2030 (%)
Data Table on Residential - Year-over-year growth 2025-2030 (%)

8.4 Commercial - Market size and forecast 2025-2030

Chart on Commercial - Market size and forecast 2025-2030 ($ million)
Data Table on Commercial - Market size and forecast 2025-2030 ($ million)
Chart on Commercial - Year-over-year growth 2025-2030 (%)
Data Table on Commercial - Year-over-year growth 2025-2030 (%)

8.5 Industrial - Market size and forecast 2025-2030

Chart on Industrial - Market size and forecast 2025-2030 ($ million)
Data Table on Industrial - Market size and forecast 2025-2030 ($ million)
Chart on Industrial - Year-over-year growth 2025-2030 (%)
Data Table on Industrial - Year-over-year growth 2025-2030 (%)

8.6 Market opportunity by Application

Market opportunity by Application ($ million)
Data Table on Market opportunity by Application ($ million)

9. Market Segmentation by Distribution Channel

9.1 Market segments

Chart on Distribution Channel - Market share 2025-2030 (%)
Data Table on Distribution Channel - Market share 2025-2030 (%)

9.2 Comparison by Distribution Channel

Chart on Comparison by Distribution Channel
Data Table on Comparison by Distribution Channel

9.3 Offline - Market size and forecast 2025-2030

Chart on Offline - Market size and forecast 2025-2030 ($ million)
Data Table on Offline - Market size and forecast 2025-2030 ($ million)
Chart on Offline - Year-over-year growth 2025-2030 (%)
Data Table on Offline - Year-over-year growth 2025-2030 (%)

9.4 Online - Market size and forecast 2025-2030

Chart on Online - Market size and forecast 2025-2030 ($ million)
Data Table on Online - Market size and forecast 2025-2030 ($ million)
Chart on Online - Year-over-year growth 2025-2030 (%)
Data Table on Online - Year-over-year growth 2025-2030 (%)

9.5 Market opportunity by Distribution Channel

Market opportunity by Distribution Channel ($ million)
Data Table on Market opportunity by Distribution Channel ($ million)

10. Market Segmentation by Type

10.1 Market segments

Chart on Type - Market share 2025-2030 (%)
Data Table on Type - Market share 2025-2030 (%)

10.2 Comparison by Type

Chart on Comparison by Type
Data Table on Comparison by Type

10.3 Corded - Market size and forecast 2025-2030

Chart on Corded - Market size and forecast 2025-2030 ($ million)
Data Table on Corded - Market size and forecast 2025-2030 ($ million)
Chart on Corded - Year-over-year growth 2025-2030 (%)
Data Table on Corded - Year-over-year growth 2025-2030 (%)

10.4 Cordless - Market size and forecast 2025-2030

Chart on Cordless - Market size and forecast 2025-2030 ($ million)
Data Table on Cordless - Market size and forecast 2025-2030 ($ million)
Chart on Cordless - Year-over-year growth 2025-2030 (%)
Data Table on Cordless - Year-over-year growth 2025-2030 (%)

10.5 Market opportunity by Type

Market opportunity by Type ($ million)
Data Table on Market opportunity by Type ($ million)

11. Customer Landscape

11.1 Customer landscape overview

Analysis of price sensitivity, lifecycle, customer purchase basket, adoption rates, and purchase criteria

12. Geographic Landscape

12.1 Geographic segmentation

Chart on Market share by geography 2025-2030 (%)
Data Table on Market share by geography 2025-2030 (%)

12.2 Geographic comparison

Chart on Geographic comparison
Data Table on Geographic comparison

12.3 North America - Market size and forecast 2025-2030

Chart on North America - Market size and forecast 2025-2030 ($ million)
Data Table on North America - Market size and forecast 2025-2030 ($ million)
Chart on North America - Year-over-year growth 2025-2030 (%)
Data Table on North America - Year-over-year growth 2025-2030 (%)
Chart on Regional Comparison - North America
Data Table on Regional Comparison - North America

12.3.1 US - Market size and forecast 2025-2030

Chart on US - Market size and forecast 2025-2030 ($ million)
Data Table on US - Market size and forecast 2025-2030 ($ million)
Chart on US - Year-over-year growth 2025-2030 (%)
Data Table on US - Year-over-year growth 2025-2030 (%)

12.3.2 Canada - Market size and forecast 2025-2030

Chart on Canada - Market size and forecast 2025-2030 ($ million)
Data Table on Canada - Market size and forecast 2025-2030 ($ million)
Chart on Canada - Year-over-year growth 2025-2030 (%)
Data Table on Canada - Year-over-year growth 2025-2030 (%)

12.3.3 Mexico - Market size and forecast 2025-2030

Chart on Mexico - Market size and forecast 2025-2030 ($ million)
Data Table on Mexico - Market size and forecast 2025-2030 ($ million)
Chart on Mexico - Year-over-year growth 2025-2030 (%)
Data Table on Mexico - Year-over-year growth 2025-2030 (%)

12.4 Europe - Market size and forecast 2025-2030

Chart on Europe - Market size and forecast 2025-2030 ($ million)
Data Table on Europe - Market size and forecast 2025-2030 ($ million)
Chart on Europe - Year-over-year growth 2025-2030 (%)
Data Table on Europe - Year-over-year growth 2025-2030 (%)
Chart on Regional Comparison - Europe
Data Table on Regional Comparison - Europe

12.4.1 Germany - Market size and forecast 2025-2030

Chart on Germany - Market size and forecast 2025-2030 ($ million)
Data Table on Germany - Market size and forecast 2025-2030 ($ million)
Chart on Germany - Year-over-year growth 2025-2030 (%)
Data Table on Germany - Year-over-year growth 2025-2030 (%)

12.4.2 UK - Market size and forecast 2025-2030

Chart on UK - Market size and forecast 2025-2030 ($ million)
Data Table on UK - Market size and forecast 2025-2030 ($ million)
Chart on UK - Year-over-year growth 2025-2030 (%)
Data Table on UK - Year-over-year growth 2025-2030 (%)

12.4.3 France - Market size and forecast 2025-2030

Chart on France - Market size and forecast 2025-2030 ($ million)
Data Table on France - Market size and forecast 2025-2030 ($ million)
Chart on France - Year-over-year growth 2025-2030 (%)
Data Table on France - Year-over-year growth 2025-2030 (%)

12.4.4 Italy - Market size and forecast 2025-2030

Chart on Italy - Market size and forecast 2025-2030 ($ million)
Data Table on Italy - Market size and forecast 2025-2030 ($ million)
Chart on Italy - Year-over-year growth 2025-2030 (%)
Data Table on Italy - Year-over-year growth 2025-2030 (%)

12.4.5 Spain - Market size and forecast 2025-2030

Chart on Spain - Market size and forecast 2025-2030 ($ million)
Data Table on Spain - Market size and forecast 2025-2030 ($ million)
Chart on Spain - Year-over-year growth 2025-2030 (%)
Data Table on Spain - Year-over-year growth 2025-2030 (%)

12.4.6 The Netherlands - Market size and forecast 2025-2030

Chart on The Netherlands - Market size and forecast 2025-2030 ($ million)
Data Table on The Netherlands - Market size and forecast 2025-2030 ($ million)
Chart on The Netherlands - Year-over-year growth 2025-2030 (%)
Data Table on The Netherlands - Year-over-year growth 2025-2030 (%)

12.5 APAC - Market size and forecast 2025-2030

Chart on APAC - Market size and forecast 2025-2030 ($ million)
Data Table on APAC - Market size and forecast 2025-2030 ($ million)
Chart on APAC - Year-over-year growth 2025-2030 (%)
Data Table on APAC - Year-over-year growth 2025-2030 (%)
Chart on Regional Comparison - APAC
Data Table on Regional Comparison - APAC

12.5.1 China - Market size and forecast 2025-2030

Chart on China - Market size and forecast 2025-2030 ($ million)
Data Table on China - Market size and forecast 2025-2030 ($ million)
Chart on China - Year-over-year growth 2025-2030 (%)
Data Table on China - Year-over-year growth 2025-2030 (%)

12.5.2 India - Market size and forecast 2025-2030

Chart on India - Market size and forecast 2025-2030 ($ million)
Data Table on India - Market size and forecast 2025-2030 ($ million)
Chart on India - Year-over-year growth 2025-2030 (%)
Data Table on India - Year-over-year growth 2025-2030 (%)

12.5.3 Japan - Market size and forecast 2025-2030

Chart on Japan - Market size and forecast 2025-2030 ($ million)
Data Table on Japan - Market size and forecast 2025-2030 ($ million)
Chart on Japan - Year-over-year growth 2025-2030 (%)
Data Table on Japan - Year-over-year growth 2025-2030 (%)

12.5.4 South Korea - Market size and forecast 2025-2030

Chart on South Korea - Market size and forecast 2025-2030 ($ million)
Data Table on South Korea - Market size and forecast 2025-2030 ($ million)
Chart on South Korea - Year-over-year growth 2025-2030 (%)
Data Table on South Korea - Year-over-year growth 2025-2030 (%)

12.5.5 Australia - Market size and forecast 2025-2030

Chart on Australia - Market size and forecast 2025-2030 ($ million)
Data Table on Australia - Market size and forecast 2025-2030 ($ million)
Chart on Australia - Year-over-year growth 2025-2030 (%)
Data Table on Australia - Year-over-year growth 2025-2030 (%)

12.5.6 Indonesia - Market size and forecast 2025-2030

Chart on Indonesia - Market size and forecast 2025-2030 ($ million)
Data Table on Indonesia - Market size and forecast 2025-2030 ($ million)
Chart on Indonesia - Year-over-year growth 2025-2030 (%)
Data Table on Indonesia - Year-over-year growth 2025-2030 (%)

12.6 Middle East and Africa - Market size and forecast 2025-2030

Chart on Middle East and Africa - Market size and forecast 2025-2030 ($ million)
Data Table on Middle East and Africa - Market size and forecast 2025-2030 ($ million)
Chart on Middle East and Africa - Year-over-year growth 2025-2030 (%)
Data Table on Middle East and Africa - Year-over-year growth 2025-2030 (%)
Chart on Regional Comparison - Middle East and Africa
Data Table on Regional Comparison - Middle East and Africa

12.6.1 Saudi Arabia - Market size and forecast 2025-2030

Chart on Saudi Arabia - Market size and forecast 2025-2030 ($ million)
Data Table on Saudi Arabia - Market size and forecast 2025-2030 ($ million)
Chart on Saudi Arabia - Year-over-year growth 2025-2030 (%)
Data Table on Saudi Arabia - Year-over-year growth 2025-2030 (%)

12.6.2 UAE - Market size and forecast 2025-2030

Chart on UAE - Market size and forecast 2025-2030 ($ million)
Data Table on UAE - Market size and forecast 2025-2030 ($ million)
Chart on UAE - Year-over-year growth 2025-2030 (%)
Data Table on UAE - Year-over-year growth 2025-2030 (%)

12.6.3 South Africa - Market size and forecast 2025-2030

Chart on South Africa - Market size and forecast 2025-2030 ($ million)
Data Table on South Africa - Market size and forecast 2025-2030 ($ million)
Chart on South Africa - Year-over-year growth 2025-2030 (%)
Data Table on South Africa - Year-over-year growth 2025-2030 (%)

12.6.4 Egypt - Market size and forecast 2025-2030

Chart on Egypt - Market size and forecast 2025-2030 ($ million)
Data Table on Egypt - Market size and forecast 2025-2030 ($ million)
Chart on Egypt - Year-over-year growth 2025-2030 (%)
Data Table on Egypt - Year-over-year growth 2025-2030 (%)

12.6.5 Israel - Market size and forecast 2025-2030

Chart on Israel - Market size and forecast 2025-2030 ($ million)
Data Table on Israel - Market size and forecast 2025-2030 ($ million)
Chart on Israel - Year-over-year growth 2025-2030 (%)
Data Table on Israel - Year-over-year growth 2025-2030 (%)

12.7 South America - Market size and forecast 2025-2030

Chart on South America - Market size and forecast 2025-2030 ($ million)
Data Table on South America - Market size and forecast 2025-2030 ($ million)
Chart on South America - Year-over-year growth 2025-2030 (%)
Data Table on South America - Year-over-year growth 2025-2030 (%)
Chart on Regional Comparison - South America
Data Table on Regional Comparison - South America

12.7.1 Brazil - Market size and forecast 2025-2030

Chart on Brazil - Market size and forecast 2025-2030 ($ million)
Data Table on Brazil - Market size and forecast 2025-2030 ($ million)
Chart on Brazil - Year-over-year growth 2025-2030 (%)
Data Table on Brazil - Year-over-year growth 2025-2030 (%)

12.7.2 Argentina - Market size and forecast 2025-2030

Chart on Argentina - Market size and forecast 2025-2030 ($ million)
Data Table on Argentina - Market size and forecast 2025-2030 ($ million)
Chart on Argentina - Year-over-year growth 2025-2030 (%)
Data Table on Argentina - Year-over-year growth 2025-2030 (%)

12.7.3 Colombia - Market size and forecast 2025-2030

Chart on Colombia - Market size and forecast 2025-2030 ($ million)
Data Table on Colombia - Market size and forecast 2025-2030 ($ million)
Chart on Colombia - Year-over-year growth 2025-2030 (%)
Data Table on Colombia - Year-over-year growth 2025-2030 (%)

12.8 Market opportunity by geography

Market opportunity by geography ($ million)
Data Tables on Market opportunity by geography ($ million)

13. Drivers, Challenges, and Opportunity

13.1 Market drivers

Growing number of smart cities
Emergence of robotic vacuum cleaners
Lucrative offers from online channels

13.2 Market challenges

Threat from counterfeit products
Environmental issues regarding disposal of vacuum cleaner bags
High price of robotic vacuum cleaners used in commercial sector

13.3 Impact of drivers and challenges

Impact of drivers and challenges in 2025 and 2030

13.4 Market opportunities

Social factors driving adoption of robot vacuum cleaners in urban areas
Advancements in vacuum cleaners
Growing concern about efficient air filtration systems in homes and offices

14. Competitive Landscape

14.1 Overview

14.2

Overview on criticality of inputs and factors of differentiation

14.3 Landscape disruption

Overview on factors of disruption

14.4 Industry risks

Impact of key risks on business

15. Competitive Analysis

15.1 Companies profiled

Companies covered

15.2 Company ranking index

15.3 Market positioning of companies

Matrix on companies position and classification

15.4 AB Electrolux

AB Electrolux - Overview
AB Electrolux - Business segments
AB Electrolux - Key news
AB Electrolux - Key offerings
AB Electrolux - Segment focus
SWOT

15.5 Beijing Roborock Technology Co. Ltd.

Beijing Roborock Technology Co. Ltd. - Overview
Beijing Roborock Technology Co. Ltd. - Product / Service
Beijing Roborock Technology Co. Ltd. - Key offerings
SWOT

15.6 BISSELL Inc.

BISSELL Inc. - Overview
BISSELL Inc. - Product / Service
BISSELL Inc. - Key offerings
SWOT

15.7 Dyson Group Co.

Dyson Group Co. - Overview
Dyson Group Co. - Product / Service
Dyson Group Co. - Key offerings
SWOT

15.8 Haier Smart Home Co. Ltd.

Haier Smart Home Co. Ltd. - Overview
Haier Smart Home Co. Ltd. - Business segments
Haier Smart Home Co. Ltd. - Key offerings
Haier Smart Home Co. Ltd. - Segment focus
SWOT

15.9 Irobot Corp.

Irobot Corp. - Overview
Irobot Corp. - Product / Service
Irobot Corp. - Key news
Irobot Corp. - Key offerings
SWOT

15.10 KENT RO Systems Ltd.

KENT RO Systems Ltd. - Overview
KENT RO Systems Ltd. - Product / Service
KENT RO Systems Ltd. - Key offerings
SWOT

15.11 Koninklijke Philips NV

Koninklijke Philips NV - Overview
Koninklijke Philips NV - Business segments
Koninklijke Philips NV - Key news
Koninklijke Philips NV - Key offerings
Koninklijke Philips NV - Segment focus
SWOT

15.12 LG Electronics Inc.

LG Electronics Inc. - Overview
LG Electronics Inc. - Product / Service
LG Electronics Inc. - Key offerings
SWOT

15.13 Midea Group Co. Ltd.

Midea Group Co. Ltd. - Overview
Midea Group Co. Ltd. - Product / Service
Midea Group Co. Ltd. - Key offerings
SWOT

15.14 Miele and Cie. KG

Miele and Cie. KG - Overview
Miele and Cie. KG - Product / Service
Miele and Cie. KG - Key offerings
SWOT

15.15 Panasonic Holdings Corp.

Panasonic Holdings Corp. - Overview
Panasonic Holdings Corp. - Business segments
Panasonic Holdings Corp. - Key news
Panasonic Holdings Corp. - Key offerings
Panasonic Holdings Corp. - Segment focus
SWOT

15.16 Samsung Electronics Co. Ltd.

Samsung Electronics Co. Ltd. - Overview
Samsung Electronics Co. Ltd. - Business segments
Samsung Electronics Co. Ltd. - Key news
Samsung Electronics Co. Ltd. - Key offerings
Samsung Electronics Co. Ltd. - Segment focus
SWOT

15.17 SharkNinja Operating LLC

SharkNinja Operating LLC - Overview
SharkNinja Operating LLC - Product / Service
SharkNinja Operating LLC - Key offerings
SWOT

15.18 Stanley Black and Decker Inc.

Stanley Black and Decker Inc. - Overview
Stanley Black and Decker Inc. - Business segments
Stanley Black and Decker Inc. - Key offerings
Stanley Black and Decker Inc. - Segment focus
SWOT

16. Appendix

16.1 Scope of the report

Market definition
Objectives
Notes and caveats

16.2 Inclusions and exclusions checklist

Inclusions checklist
Exclusions checklist

16.3 Currency conversion rates for US$

16.4 Research methodology

16.5 Data procurement

Information sources

16.6 Data validation

16.7 Validation techniques employed for market sizing

16.8 Data synthesis

16.9 360 degree market analysis

16.10 List of abbreviations

Research Methodology

Technavio presents a detailed picture of the market by way of study, synthesis, and summation of data from multiple sources. The analysts have presented the various facets of the market with a particular focus on identifying the key industry influencers. The data thus presented is comprehensive, reliable, and the result of extensive research, both primary and secondary.

INFORMATION SOURCES

Primary sources

  • Manufacturers and suppliers
  • Channel partners
  • Industry experts
  • Strategic decision makers

Secondary sources

  • Industry journals and periodicals
  • Government data
  • Financial reports of key industry players
  • Historical data
  • Press releases

DATA ANALYSIS

Data Synthesis

  • Collation of data
  • Estimation of key figures
  • Analysis of derived insights

Data Validation

  • Triangulation with data models
  • Reference against proprietary databases
  • Corroboration with industry experts

REPORT WRITING

Qualitative

  • Market drivers
  • Market challenges
  • Market trends
  • Five forces analysis

Quantitative

  • Market size and forecast
  • Market segmentation
  • Geographical insights
  • Competitive landscape

Interested in this report?

Get your sample now to see our research methodology and insights!

Download Now

Frequently Asked Questions

Vacuum Cleaner market growth will increase by USD 12920.6 million during 2026-2030.

The Vacuum Cleaner market is expected to grow at a CAGR of 13.9% during 2026-2030.

Vacuum Cleaner market is segmented by Application (Residential, Commercial, Industrial) Distribution channel (Offline, Online) Type (Corded, Cordless)

AB Electrolux, Beijing Roborock Technology Co. Ltd., BISSELL Inc., Dyson Group Co., Haier Smart Home Co. Ltd., Irobot Corp., KENT RO Systems Ltd., Koninklijke Philips NV, LG Electronics Inc., Midea Group Co. Ltd., Miele and Cie. KG, Panasonic Holdings Corp., Samsung Electronics Co. Ltd., SharkNinja Operating LLC, Stanley Black and Decker Inc. are a few of the key vendors in the Vacuum Cleaner market.

North America will register the highest growth rate of 41.2% among the other regions. Therefore, the Vacuum Cleaner market in North America is expected to garner significant business opportunities for the vendors during the forecast period.

US, Canada, Mexico, Germany, UK, France, Italy, Spain, The Netherlands, China, India, Japan, South Korea, Australia, Indonesia, Saudi Arabia, UAE, South Africa, Egypt, Israel, Brazil, Argentina, Colombia

  • Growing number of smart cities is the driving factor this market.

The Vacuum Cleaner market vendors should focus on grabbing business opportunities from the Application segment as it accounted for the largest market share in the base year.