Utility Poles Market Analysis, Size, and Forecast 2025-2029: APAC (Australia, China, India, Japan, South Korea), North America (US and Canada), Europe (France, Germany, UK), South America , and Middle East and Africa

Utility Poles Market Analysis, Size, and Forecast 2025-2029:
APAC (Australia, China, India, Japan, South Korea), North America (US and Canada), Europe (France, Germany, UK), South America , and Middle East and Africa

Published: Apr 2025 194 Pages SKU: IRTNTR73688

Market Overview at a Glance

$9.01 B
Market Opportunity
3.4%
CAGR
3.2
YoY growth 2024-2025(%)

Utility Poles Market Size 2025-2029

The utility poles market size is forecast to increase by USD 9.01 billion, at a CAGR of 3.4% between 2024 and 2029.

  • The market is experiencing significant growth due to the increasing focus on energy efficiency and the rising demand for power generation. Governments worldwide are implementing regulations and industry standards to promote sustainable energy solutions, driving the market's expansion. The need for reliable and durable utility poles to support power lines and telecommunication infrastructure is a key factor fueling market growth. However, challenges persist in the form of high material costs, especially for eco-friendly alternatives, and the need for regular maintenance and replacement of aging infrastructure.
  • These obstacles necessitate strategic planning and innovation from market participants to maintain competitiveness and meet evolving customer demands. Companies seeking to capitalize on market opportunities should focus on developing cost-effective, sustainable, and durable utility pole solutions while addressing the challenges of maintenance and replacement. By staying abreast of regulatory requirements and industry trends, businesses can effectively navigate the market's dynamic landscape.

What will be the Size of the Utility Poles Market during the forecast period?

Utility Poles Market Size

 Request Free Sample

The market is a dynamic and evolving sector, encompassing various applications and entities that continuously unfold in response to technological advancements and industry demands. The electrical grid relies heavily on utility poles to support distribution lines, power lines, and transmission lines, with electrical companies managing vast pole inventories to ensure reliable energy delivery. Pole design and material properties, including fiberglass, steel, concrete, and composite poles, are subject to ongoing research and development to enhance pole durability, strength, and resistance. Pole deflection, pole weight, and pole corrosion are critical factors in pole engineering and construction, with pole inspections and maintenance playing essential roles in prolonging pole life cycle.

Pole manufacturing processes, from pole setting to pole installation, involve the use of specialized equipment and adherence to pole standards and regulations. Pole safety is paramount, with pole safety equipment and pole climbing gear essential for ensuring worker safety during pole inspections and maintenance activities. The integration of renewable energy sources, such as wind and solar power, into the electrical grid necessitates the development of smart grid technologies and pole preservation techniques to optimize pole efficiency and minimize pole degradation. Pole bending moment, pole wind load, and pole ice load are just a few of the factors that influence pole design and engineering in the context of renewable energy.

Pole management and pole maintenance are ongoing processes, with pole inspection equipment and pole testing technologies playing crucial roles in identifying and addressing potential issues before they become major problems. Pole replacement and pole recycling are essential aspects of the pole life cycle, ensuring that resources are utilized efficiently and sustainably. The market is a complex and dynamic ecosystem, with various entities and factors interconnected in the pursuit of reliable, efficient, and sustainable energy delivery. From pole manufacturing to pole maintenance, the sector is constantly evolving to meet the demands of the electrical grid and the ever-changing energy landscape.

How is this Utility Poles Industry segmented?

The utility poles industry research report provides comprehensive data (region-wise segment analysis), with forecasts and estimates in "USD million" for the period 2025-2029, as well as historical data from 2019-2023 for the following segments.

  • Type
    • Distribution poles
    • Transmission poles
  • Material
    • Steel
    • Concrete
    • Composite
    • Wood
  • Application
    • Transmission line
    • Distribution line
    • Telecommunication
    • Others
  • Geography
    • North America
      • US
      • Canada
    • Europe
      • France
      • Germany
      • UK
    • APAC
      • Australia
      • China
      • India
      • Japan
      • South Korea
    • Rest of World (ROW)

By Type Insights

The distribution poles segment is estimated to witness significant growth during the forecast period.

Distribution poles, essential components of the electrical grid infrastructure, transmit secondary, low-voltage power directly to homes and businesses. These poles, which do not include wooden or non-wooden street light poles, come in various designs such as guyed, tangent, and self-supporting. Guyed poles, featuring an integrated guy wire for added support, contrast tangent poles, which are arranged in a straight line for basic purposes. Self-supporting poles, devoid of any additional support, ensure the efficient delivery of power. The market encompasses a range of materials, including fiberglass, steel, concrete, and composite. Pole engineering and construction techniques have evolved significantly, with an emphasis on pole durability, load capacity, and resistance to environmental factors.

Pole maintenance, a critical aspect of utility operations, involves regular inspections, testing, and replacement. Pole rehabilitation and recycling efforts aim to extend the life cycle of existing poles, while new pole installations incorporate advanced materials and designs to enhance pole safety and efficiency. Regulations governing pole installation, maintenance, and replacement vary by region, with a growing focus on renewable energy integration and smart grid technologies. Transmission and distribution lines, supported by these poles, face challenges such as pole deflection, wind load, ice load, and corrosion. Innovations in pole design, materials, and testing equipment address these challenges, ensuring the reliability and sustainability of the electrical grid.

Pole management, a crucial aspect of utility operations, involves the efficient inventory, design, and maintenance of pole assets. Pole safety equipment, including climbing gear and inspection equipment, plays a vital role in ensuring the safety of utility workers. The integration of solar and wind power into the electrical grid necessitates the development of specialized poles and foundations to accommodate the unique requirements of these renewable energy sources. As the demand for clean energy grows, so too will the importance of utility poles in supporting the electrical grid's evolution.

Utility Poles Market Size

Request Free Sample

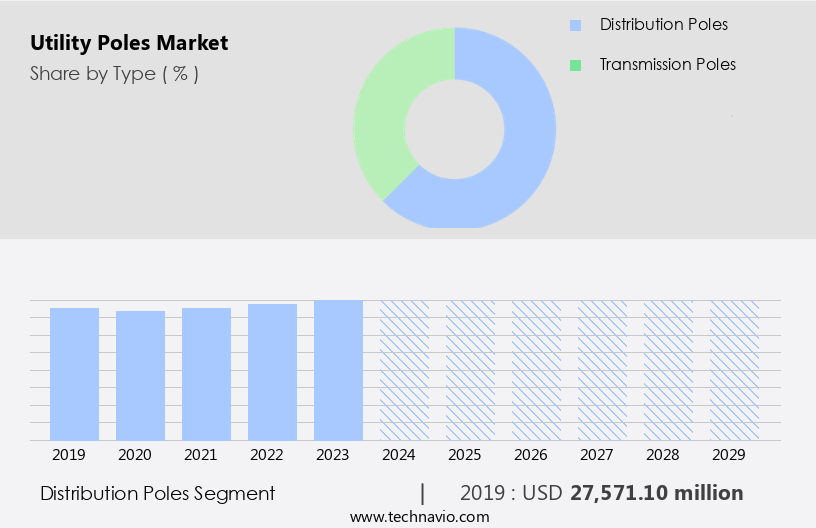
The Distribution poles segment was valued at USD 27.57 billion in 2019 and showed a gradual increase during the forecast period.

Regional Analysis

North America is estimated to contribute 42% to the growth of the global market during the forecast period.Technavio's analysts have elaborately explained the regional trends and drivers that shape the market during the forecast period.

Utility Poles Market Share by Geography

 Request Free Sample

The market is witnessing significant growth, particularly in the Asia Pacific (APAC) region, which holds the largest share and is expected to continue its dominance due to substantial investments in power infrastructure. This expansion is driven by the increasing demand for electricity in countries like China, India, Australia, and Southeast Asian economies, as well as the addition of renewable and fossil fuel-fired power plants. The region's economic growth and industrialization necessitate the development of robust power infrastructure. India, for instance, ranks 4th globally in Renewable Energy Installed Capacity and 4th in Wind Power capacity, and 5th in Solar Power capacity.

The market encompasses various aspects, including pole grounding, fiberglass poles, pole span, pole standards, wooden poles, pole rehabilitation, pole engineering, pole construction, transmission lines, underground lines, pole recycling, pole load capacity, pole strength, pole maintenance, pole vibration, pole material properties, overhead lines, pole diameter, pole durability, pole management, pole treatment, power lines, pole costs, guy wires, steel poles, pole access equipment, composite poles, pole regulations, solar power, pole resistance, pole efficiency, pole safety, pole replacement, pole life cycle, concrete poles, pole shear stress, pole ice load, pole inspection equipment, wind power, pole preservation, smart grid, and renewable energy.

The market's evolution is characterized by advancements in pole manufacturing, pole testing, pole installation, pole setting, street lighting, pole codes, pole degradation, pole height, pole safety equipment, pole wind load, electrical grid, distribution lines, electric companies, pole inventory, pole design, pole deflection, pole weight, pole corrosion, traffic signals, pole lightning protection, pole bending moment, and pole testing equipment.

Market Dynamics

Our researchers analyzed the data with 2024 as the base year, along with the key drivers, trends, and challenges. A holistic analysis of drivers will help companies refine their marketing strategies to gain a competitive advantage.

What are the key market drivers leading to the rise in the adoption of Utility Poles Industry?

  • The increasing prioritization of energy efficiency serves as the primary market catalyst. 
  • The global utility pole market is experiencing significant growth due to the increasing energy consumption worldwide. Utility poles serve a crucial role in electricity networks by supporting and carrying power lines, including distribution lines and sub-transmission lines. These poles facilitate the transfer of power from power stations to regional substations and ultimately to end consumers' homes or facilities. Additionally, they are utilized in the communication sector for carrying coaxial cables for television broadcasting and fiber optic cables for telecommunication lines. As a result, the growing demand for electricity and communication services is anticipated to boost market expansion during the forecast period.
  • Utility poles are engineered to withstand various environmental stressors, such as pole wind load, pole ice load, and pole shear stress, to ensure pole safety and pole preservation. Pole inspection equipment and pole testing equipment are essential for assessing pole condition and ensuring pole installation and pole setting are carried out correctly. Furthermore, the integration of smart grid technology and renewable energy sources, such as wind power, into utility networks, is further fueling market growth. Overall, the utility pole market is expected to continue its expansion, driven by the essential role utility poles play in delivering essential energy and communication services.

What are the market trends shaping the Utility Poles Industry?

  • The increasing need for power generation is a notable market trend. This demand is driven by various factors, including population growth, urbanization, and industrialization.
  • The electrical grid is a critical infrastructure that underpins economic growth and development. As urbanization and industrialization continue to escalate worldwide, the demand for electricity has significantly increased. This expansion necessitates the installation and maintenance of utility poles to support distribution lines for electric companies. The pole inventory requires periodic inspections to ensure their structural integrity against pole deflection, pole weight, pole corrosion, and other environmental factors. Pole design plays a crucial role in minimizing pole bending moment and maximizing pole life. Pole manufacturing involves the production of pole foundations, pole climbing gear, pole testing equipment, and pole maintenance equipment.
  • Traffic signals and pole lightning protection are essential add-ons to the pole infrastructure. Pole inspections are essential to identify and address any issues, such as pole damage or aging, to prevent power outages and ensure public safety. The reliable operation of the electrical grid is essential for industrial activities, which generate employment and contribute to economic progress. The expansion of industries and manufacturing plants necessitates a robust power distribution network. In conclusion, the market is a vital component of the electrical grid infrastructure, and its growth is driven by the increasing demand for electricity resulting from population growth, urbanization, and industrialization.

What challenges does the Utility Poles Industry face during its growth?

  • The convergence of government regulations and industry standards poses a significant challenge to the industry's growth trajectory. 
  • Utility poles play a crucial role in the power infrastructure of various economies, supporting transmission and distribution lines for electricity. Compliance with international regulations and industry standards is essential for pole construction and maintenance. For instance, the Public Utilities Regulatory Policy Act of 1978 in the US led to the shift in electricity generation from public utilities to independent power producers (IPPs), favoring equipment suitable for small-scale electricity generation. Pole engineering and construction considerations include pole span, load capacity, strength, material properties, and vibration. Traditional materials for utility poles include wooden poles and fiberglass poles.
  • Wooden poles have been widely used due to their availability and cost-effectiveness, but they require frequent maintenance and pole rehabilitation. Fiberglass poles offer advantages such as lighter weight, longer lifespan, and resistance to weather conditions. Pole grounding is essential for safety and electrical efficiency. Underground power lines are an alternative to overhead lines, reducing the need for pole construction and maintenance. Pole recycling is an environmentally friendly solution for disposing of used poles. Proper pole maintenance is essential to ensure safety, reliability, and efficiency of the power infrastructure.

Exclusive Customer Landscape

The utility poles market forecasting report includes the adoption lifecycle of the market, covering from the innovator's stage to the laggard's stage. It focuses on adoption rates in different regions based on penetration. Furthermore, the utility poles market report also includes key purchase criteria and drivers of price sensitivity to help companies evaluate and develop their market growth analysis strategies.

Utility Poles Market Share by Geography

 Customer Landscape

Key Companies & Market Insights

Companies are implementing various strategies, such as strategic alliances, utility poles market forecast, partnerships, mergers and acquisitions, geographical expansion, and product/service launches, to enhance their presence in the industry.

Arcosa Inc. - The company provides a range of lightweight and effortless-to-install utility poles in diverse arm types and colors. These poles boast maintenance-free functionality, enhancing efficiency and reducing operational costs. Engineered with advanced materials, they ensure durability and resistance to weather conditions. By prioritizing original design and innovation, the company sets itself apart in the industry, offering a sustainable and reliable solution for power transmission infrastructure.

The industry research and growth report includes detailed analyses of the competitive landscape of the market and information about key companies, including:

  • Arcosa Inc.
  • Bell Lumber and Pole Co.
  • Bridgewell Resources LLC
  • EL Sewedy Electric Co.
  • FUCHS Europoles GmbH
  • Hill and Smith Holdings Plc
  • Koppers Holdings Inc.
  • NIPPON CONCRETE INDUSTRIES CO. LTD.
  • Pelco Products Inc.
  • RS Technologies Inc.
  • Saleh and Abdulaziz Abahsain Co. Ltd.
  • Skipper Ltd.
  • STELLA JONES INC.
  • Valmont Industries Inc.

Qualitative and quantitative analysis of companies has been conducted to help clients understand the wider business environment as well as the strengths and weaknesses of key industry players. Data is qualitatively analyzed to categorize companies as pure play, category-focused, industry-focused, and diversified; it is quantitatively analyzed to categorize companies as dominant, leading, strong, tentative, and weak.

Recent Development and News in Utility Poles Market

  • In February 2023, TPG Growth, the middle market private equity platform of alternative asset firm TPG, announced a strategic investment in Hampton Roads Electric Cooperative (HRECo), a utility pole and transmission line provider serving Virginia and North Carolina. This investment will support HRECo's growth initiatives and infrastructure upgrades, positioning the company to meet the increasing demand for reliable electricity infrastructure (TPG Growth Press Release, 2023).
  • In May 2024, Siemens Energy and Vestas Wind Systems, two leading energy technology companies, joined forces to develop and commercialize integrated wind turbine and utility pole solutions. Their collaboration aims to reduce the environmental impact and cost of wind energy by optimizing the design and installation of wind turbines and utility poles, as well as improving the overall grid stability (Siemens Energy Press Release, 2024).
  • In August 2024, the European Commission approved the merger between Swiss utility companies Alpiq and Axpo, creating a leading European energy provider. The combined entity will manage approximately 100,000 utility poles and over 30,000 kilometers of power lines, strengthening their position in the European utility pole market (European Commission Press Release, 2024).

Research Analyst Overview

  • The market encompasses a range of technologies and solutions to ensure the reliable operation and longevity of power infrastructure. Key components include pole encapsulation, reinforcement, connectors, splices, monitoring systems, coatings, surge protection, lubricants, sustainability solutions, fiberglass poles, linings, grouting, copper azole treatment, pole accessories, pole lifecycle management, pentachlorophenol treatment, CAD software, varnish, terminations, paint, concrete, recycling programs, sensors, lightning arresters, CCA treatment, creosote treatment, switches, risk management systems, GIS, fuses, steel poles, wraps, anchoring, grounding systems, environmental impact assessments, composites, transformers, sealants, breakers, and BIM tools. Market trends reflect a growing emphasis on pole sustainability and durability, with an increasing adoption of composite materials and advanced coatings.
  • Pole reinforcement and monitoring systems are also gaining traction to enhance grid resilience and reduce maintenance costs. Meanwhile, pole recycling programs and environmental impact assessments are becoming essential for utility companies seeking to minimize their carbon footprint and comply with regulations. Pole surge protection, pole lubricants, and pole grouting are other crucial areas of focus, as they help prevent pole failures and extend their lifespan. Pole terminations, pole paint, and pole sealants ensure proper insulation and protection against weather conditions. Pole linings, pole linings, and pole fiberglass offer improved strength and resistance to corrosion, while pole sensors and pole switches enable real-time monitoring and control of power distribution.
  • In summary, the market is characterized by a diverse range of technologies and solutions that address various challenges related to pole durability, sustainability, and grid reliability. Market trends indicate a growing emphasis on advanced materials, monitoring systems, and environmental considerations to optimize pole performance and reduce maintenance costs.

Dive into Technavio's robust research methodology, blending expert interviews, extensive data synthesis, and validated models for unparalleled Utility Poles Market insights. See full methodology.

Market Scope

Report Coverage

Details

Page number

194

Base year

2024

Historic period

2019-2023

Forecast period

2025-2029

Growth momentum & CAGR

Accelerate at a CAGR of 3.4%

Market growth 2025-2029

USD 9012 million

Market structure

Concentrated

YoY growth 2024-2025(%)

3.2

Key countries

US, China, Japan, Canada, India, UK, South Korea, Germany, Australia, and France

Competitive landscape

Leading Companies, Market Positioning of Companies, Competitive Strategies, and Industry Risks

Request Free Sample

What are the Key Data Covered in this Utility Poles Market Research and Growth Report?

  • CAGR of the Utility Poles industry during the forecast period
  • Detailed information on factors that will drive the growth and forecasting between 2025 and 2029
  • Precise estimation of the size of the market and its contribution of the industry in focus to the parent market
  • Accurate predictions about upcoming growth and trends and changes in consumer behaviour
  • Growth of the market across APAC, North America, Europe, South America, and Middle East and Africa
  • Thorough analysis of the market's competitive landscape and detailed information about companies
  • Comprehensive analysis of factors that will challenge the utility poles market growth of industry companies

We can help! Our analysts can customize this utility poles market research report to meet your requirements.

Get in touch

1 Executive Summary

  • 1.1 Market overview
    • Executive Summary - Chart on Market Overview
    • Executive Summary - Data Table on Market Overview
    • Executive Summary - Chart on Global Market Characteristics
    • Executive Summary - Chart on Market by Geography
    • Executive Summary - Chart on Market Segmentation by Type
    • Executive Summary - Chart on Market Segmentation by Material
    • Executive Summary - Chart on Market Segmentation by Application
    • Executive Summary - Chart on Incremental Growth
    • Executive Summary - Data Table on Incremental Growth
    • Executive Summary - Chart on Company Market Positioning

2 Technavio Analysis

  • 2.1 Analysis of price sensitivity, lifecycle, customer purchase basket, adoption rates, and purchase criteria
    • Analysis of price sensitivity, lifecycle, customer purchase basket, adoption rates, and purchase criteria
  • 2.2 Criticality of inputs and Factors of differentiation
    • Overview on criticality of inputs and factors of differentiation
  • 2.3 Factors of disruption
    • Overview on factors of disruption
  • 2.4 Impact of drivers and challenges
    • Impact of drivers and challenges in 2024 and 2029

3 Market Landscape

  • 3.1 Market ecosystem
    • Parent Market
    • Data Table on - Parent Market
  • 3.2 Market characteristics
    • Market characteristics analysis
  • 3.3 Value chain analysis
    • Value chain analysis

4 Market Sizing

  • 4.1 Market definition
    • Offerings of companies included in the market definition
  • 4.2 Market segment analysis
    • Market segments
  • 4.3 Market size 2024
    • 4.4 Market outlook: Forecast for 2024-2029
      • Chart on Global - Market size and forecast 2024-2029 ($ million)
      • Data Table on Global - Market size and forecast 2024-2029 ($ million)
      • Chart on Global Market: Year-over-year growth 2024-2029 (%)
      • Data Table on Global Market: Year-over-year growth 2024-2029 (%)

    5 Historic Market Size

    • 5.1 Global Utility Poles Market 2019 - 2023
      • Historic Market Size - Data Table on Global Utility Poles Market 2019 - 2023 ($ million)
    • 5.2 Type segment analysis 2019 - 2023
      • Historic Market Size - Type Segment 2019 - 2023 ($ million)
    • 5.3 Material segment analysis 2019 - 2023
      • Historic Market Size - Material Segment 2019 - 2023 ($ million)
    • 5.4 Application segment analysis 2019 - 2023
      • Historic Market Size - Application Segment 2019 - 2023 ($ million)
    • 5.5 Geography segment analysis 2019 - 2023
      • Historic Market Size - Geography Segment 2019 - 2023 ($ million)
    • 5.6 Country segment analysis 2019 - 2023
      • Historic Market Size - Country Segment 2019 - 2023 ($ million)

    6 Qualitative Analysis

    • 6.1 The AI impact on global utility poles market

      7 Five Forces Analysis

      • 7.1 Five forces summary
        • Five forces analysis - Comparison between 2024 and 2029
      • 7.2 Bargaining power of buyers
        • Bargaining power of buyers - Impact of key factors 2024 and 2029
      • 7.3 Bargaining power of suppliers
        • Bargaining power of suppliers - Impact of key factors in 2024 and 2029
      • 7.4 Threat of new entrants
        • Threat of new entrants - Impact of key factors in 2024 and 2029
      • 7.5 Threat of substitutes
        • Threat of substitutes - Impact of key factors in 2024 and 2029
      • 7.6 Threat of rivalry
        • Threat of rivalry - Impact of key factors in 2024 and 2029
      • 7.7 Market condition
        • Chart on Market condition - Five forces 2024 and 2029

      8 Market Segmentation by Type

      • 8.1 Market segments
        • Chart on Type - Market share 2024-2029 (%)
        • Data Table on Type - Market share 2024-2029 (%)
      • 8.2 Comparison by Type
        • Chart on Comparison by Type
        • Data Table on Comparison by Type
      • 8.3 Distribution poles - Market size and forecast 2024-2029
        • Chart on Distribution poles - Market size and forecast 2024-2029 ($ million)
        • Data Table on Distribution poles - Market size and forecast 2024-2029 ($ million)
        • Chart on Distribution poles - Year-over-year growth 2024-2029 (%)
        • Data Table on Distribution poles - Year-over-year growth 2024-2029 (%)
      • 8.4 Transmission poles - Market size and forecast 2024-2029
        • Chart on Transmission poles - Market size and forecast 2024-2029 ($ million)
        • Data Table on Transmission poles - Market size and forecast 2024-2029 ($ million)
        • Chart on Transmission poles - Year-over-year growth 2024-2029 (%)
        • Data Table on Transmission poles - Year-over-year growth 2024-2029 (%)
      • 8.5 Market opportunity by Type
        • Market opportunity by Type ($ million)
        • Data Table on Market opportunity by Type ($ million)

      9 Market Segmentation by Material

      • 9.1 Market segments
        • Chart on Material - Market share 2024-2029 (%)
        • Data Table on Material - Market share 2024-2029 (%)
      • 9.2 Comparison by Material
        • Chart on Comparison by Material
        • Data Table on Comparison by Material
      • 9.3 Steel - Market size and forecast 2024-2029
        • Chart on Steel - Market size and forecast 2024-2029 ($ million)
        • Data Table on Steel - Market size and forecast 2024-2029 ($ million)
        • Chart on Steel - Year-over-year growth 2024-2029 (%)
        • Data Table on Steel - Year-over-year growth 2024-2029 (%)
      • 9.4 Concrete - Market size and forecast 2024-2029
        • Chart on Concrete - Market size and forecast 2024-2029 ($ million)
        • Data Table on Concrete - Market size and forecast 2024-2029 ($ million)
        • Chart on Concrete - Year-over-year growth 2024-2029 (%)
        • Data Table on Concrete - Year-over-year growth 2024-2029 (%)
      • 9.5 Composite - Market size and forecast 2024-2029
        • Chart on Composite - Market size and forecast 2024-2029 ($ million)
        • Data Table on Composite - Market size and forecast 2024-2029 ($ million)
        • Chart on Composite - Year-over-year growth 2024-2029 (%)
        • Data Table on Composite - Year-over-year growth 2024-2029 (%)
      • 9.6 Wood - Market size and forecast 2024-2029
        • Chart on Wood - Market size and forecast 2024-2029 ($ million)
        • Data Table on Wood - Market size and forecast 2024-2029 ($ million)
        • Chart on Wood - Year-over-year growth 2024-2029 (%)
        • Data Table on Wood - Year-over-year growth 2024-2029 (%)
      • 9.7 Market opportunity by Material
        • Market opportunity by Material ($ million)
        • Data Table on Market opportunity by Material ($ million)

      10 Market Segmentation by Application

      • 10.1 Market segments
        • Chart on Application - Market share 2024-2029 (%)
        • Data Table on Application - Market share 2024-2029 (%)
      • 10.2 Comparison by Application
        • Chart on Comparison by Application
        • Data Table on Comparison by Application
      • 10.3 Transmission line - Market size and forecast 2024-2029
        • Chart on Transmission line - Market size and forecast 2024-2029 ($ million)
        • Data Table on Transmission line - Market size and forecast 2024-2029 ($ million)
        • Chart on Transmission line - Year-over-year growth 2024-2029 (%)
        • Data Table on Transmission line - Year-over-year growth 2024-2029 (%)
      • 10.4 Distribution line - Market size and forecast 2024-2029
        • Chart on Distribution line - Market size and forecast 2024-2029 ($ million)
        • Data Table on Distribution line - Market size and forecast 2024-2029 ($ million)
        • Chart on Distribution line - Year-over-year growth 2024-2029 (%)
        • Data Table on Distribution line - Year-over-year growth 2024-2029 (%)
      • 10.5 Telecommunication - Market size and forecast 2024-2029
        • Chart on Telecommunication - Market size and forecast 2024-2029 ($ million)
        • Data Table on Telecommunication - Market size and forecast 2024-2029 ($ million)
        • Chart on Telecommunication - Year-over-year growth 2024-2029 (%)
        • Data Table on Telecommunication - Year-over-year growth 2024-2029 (%)
      • 10.6 Others - Market size and forecast 2024-2029
        • Chart on Others - Market size and forecast 2024-2029 ($ million)
        • Data Table on Others - Market size and forecast 2024-2029 ($ million)
        • Chart on Others - Year-over-year growth 2024-2029 (%)
        • Data Table on Others - Year-over-year growth 2024-2029 (%)
      • 10.7 Market opportunity by Application
        • Market opportunity by Application ($ million)
        • Data Table on Market opportunity by Application ($ million)

      11 Customer Landscape

      • 11.1 Customer landscape overview
        • Analysis of price sensitivity, lifecycle, customer purchase basket, adoption rates, and purchase criteria

      12 Geographic Landscape

      • 12.1 Geographic segmentation
        • Chart on Market share by geography 2024-2029 (%)
        • Data Table on Market share by geography 2024-2029 (%)
      • 12.2 Geographic comparison
        • Chart on Geographic comparison
        • Data Table on Geographic comparison
      • 12.3 APAC - Market size and forecast 2024-2029
        • Chart on APAC - Market size and forecast 2024-2029 ($ million)
        • Data Table on APAC - Market size and forecast 2024-2029 ($ million)
        • Chart on APAC - Year-over-year growth 2024-2029 (%)
        • Data Table on APAC - Year-over-year growth 2024-2029 (%)
      • 12.4 North America - Market size and forecast 2024-2029
        • Chart on North America - Market size and forecast 2024-2029 ($ million)
        • Data Table on North America - Market size and forecast 2024-2029 ($ million)
        • Chart on North America - Year-over-year growth 2024-2029 (%)
        • Data Table on North America - Year-over-year growth 2024-2029 (%)
      • 12.5 Europe - Market size and forecast 2024-2029
        • Chart on Europe - Market size and forecast 2024-2029 ($ million)
        • Data Table on Europe - Market size and forecast 2024-2029 ($ million)
        • Chart on Europe - Year-over-year growth 2024-2029 (%)
        • Data Table on Europe - Year-over-year growth 2024-2029 (%)
      • 12.6 South America - Market size and forecast 2024-2029
        • Chart on South America - Market size and forecast 2024-2029 ($ million)
        • Data Table on South America - Market size and forecast 2024-2029 ($ million)
        • Chart on South America - Year-over-year growth 2024-2029 (%)
        • Data Table on South America - Year-over-year growth 2024-2029 (%)
      • 12.7 Middle East and Africa - Market size and forecast 2024-2029
        • Chart on Middle East and Africa - Market size and forecast 2024-2029 ($ million)
        • Data Table on Middle East and Africa - Market size and forecast 2024-2029 ($ million)
        • Chart on Middle East and Africa - Year-over-year growth 2024-2029 (%)
        • Data Table on Middle East and Africa - Year-over-year growth 2024-2029 (%)
      • 12.8 US - Market size and forecast 2024-2029
        • Chart on US - Market size and forecast 2024-2029 ($ million)
        • Data Table on US - Market size and forecast 2024-2029 ($ million)
        • Chart on US - Year-over-year growth 2024-2029 (%)
        • Data Table on US - Year-over-year growth 2024-2029 (%)
      • 12.9 China - Market size and forecast 2024-2029
        • Chart on China - Market size and forecast 2024-2029 ($ million)
        • Data Table on China - Market size and forecast 2024-2029 ($ million)
        • Chart on China - Year-over-year growth 2024-2029 (%)
        • Data Table on China - Year-over-year growth 2024-2029 (%)
      • 12.10 Japan - Market size and forecast 2024-2029
        • Chart on Japan - Market size and forecast 2024-2029 ($ million)
        • Data Table on Japan - Market size and forecast 2024-2029 ($ million)
        • Chart on Japan - Year-over-year growth 2024-2029 (%)
        • Data Table on Japan - Year-over-year growth 2024-2029 (%)
      • 12.11 India - Market size and forecast 2024-2029
        • Chart on India - Market size and forecast 2024-2029 ($ million)
        • Data Table on India - Market size and forecast 2024-2029 ($ million)
        • Chart on India - Year-over-year growth 2024-2029 (%)
        • Data Table on India - Year-over-year growth 2024-2029 (%)
      • 12.12 Canada - Market size and forecast 2024-2029
        • Chart on Canada - Market size and forecast 2024-2029 ($ million)
        • Data Table on Canada - Market size and forecast 2024-2029 ($ million)
        • Chart on Canada - Year-over-year growth 2024-2029 (%)
        • Data Table on Canada - Year-over-year growth 2024-2029 (%)
      • 12.13 South Korea - Market size and forecast 2024-2029
        • Chart on South Korea - Market size and forecast 2024-2029 ($ million)
        • Data Table on South Korea - Market size and forecast 2024-2029 ($ million)
        • Chart on South Korea - Year-over-year growth 2024-2029 (%)
        • Data Table on South Korea - Year-over-year growth 2024-2029 (%)
      • 12.14 UK - Market size and forecast 2024-2029
        • Chart on UK - Market size and forecast 2024-2029 ($ million)
        • Data Table on UK - Market size and forecast 2024-2029 ($ million)
        • Chart on UK - Year-over-year growth 2024-2029 (%)
        • Data Table on UK - Year-over-year growth 2024-2029 (%)
      • 12.15 Germany - Market size and forecast 2024-2029
        • Chart on Germany - Market size and forecast 2024-2029 ($ million)
        • Data Table on Germany - Market size and forecast 2024-2029 ($ million)
        • Chart on Germany - Year-over-year growth 2024-2029 (%)
        • Data Table on Germany - Year-over-year growth 2024-2029 (%)
      • 12.16 Australia - Market size and forecast 2024-2029
        • Chart on Australia - Market size and forecast 2024-2029 ($ million)
        • Data Table on Australia - Market size and forecast 2024-2029 ($ million)
        • Chart on Australia - Year-over-year growth 2024-2029 (%)
        • Data Table on Australia - Year-over-year growth 2024-2029 (%)
      • 12.17 France - Market size and forecast 2024-2029
        • Chart on France - Market size and forecast 2024-2029 ($ million)
        • Data Table on France - Market size and forecast 2024-2029 ($ million)
        • Chart on France - Year-over-year growth 2024-2029 (%)
        • Data Table on France - Year-over-year growth 2024-2029 (%)
      • 12.18 Market opportunity by geography
        • Market opportunity by geography ($ million)
        • Data Tables on Market opportunity by geography ($ million)

      13 Drivers, Challenges, and Opportunity/Restraints

      • 13.1 Market drivers
        • 13.2 Market challenges
          • 13.3 Impact of drivers and challenges
            • Impact of drivers and challenges in 2024 and 2029
          • 13.4 Market opportunities/restraints

            14 Competitive Landscape

            • 14.1 Overview
              • 14.2 Competitive Landscape
                • Overview on criticality of inputs and factors of differentiation
              • 14.3 Landscape disruption
                • Overview on factors of disruption
              • 14.4 Industry risks
                • Impact of key risks on business

              15 Competitive Analysis

              • 15.1 Companies profiled
                • Companies covered
              • 15.2 Company ranking index
                • Company ranking index
              • 15.3 Market positioning of companies
                • Matrix on companies position and classification
              • 15.4 EL Sewedy Electric Co.
                • EL Sewedy Electric Co. - Overview
                • EL Sewedy Electric Co. - Product / Service
                • EL Sewedy Electric Co. - Key offerings
                • SWOT
              • 15.5 FUCHS Europoles GmbH
                • FUCHS Europoles GmbH - Overview
                • FUCHS Europoles GmbH - Product / Service
                • FUCHS Europoles GmbH - Key offerings
                • SWOT
              • 15.6 Hill and Smith Holdings Plc
                • Hill and Smith Holdings Plc - Overview
                • Hill and Smith Holdings Plc - Product / Service
                • Hill and Smith Holdings Plc - Key offerings
                • SWOT
              • 15.7 NIPPON CONCRETE INDUSTRIES CO. LTD.
                • NIPPON CONCRETE INDUSTRIES CO. LTD. - Overview
                • NIPPON CONCRETE INDUSTRIES CO. LTD. - Business segments
                • NIPPON CONCRETE INDUSTRIES CO. LTD. - Key offerings
                • NIPPON CONCRETE INDUSTRIES CO. LTD. - Segment focus
                • SWOT
              • 15.8 Pelco Products Inc.
                • Pelco Products Inc. - Overview
                • Pelco Products Inc. - Product / Service
                • Pelco Products Inc. - Key offerings
                • SWOT
              • 15.9 RS Technologies Inc.
                • RS Technologies Inc. - Overview
                • RS Technologies Inc. - Product / Service
                • RS Technologies Inc. - Key offerings
                • SWOT
              • 15.10 Saleh and Abdulaziz Abahsain Co. Ltd.
                • Saleh and Abdulaziz Abahsain Co. Ltd. - Overview
                • Saleh and Abdulaziz Abahsain Co. Ltd. - Product / Service
                • Saleh and Abdulaziz Abahsain Co. Ltd. - Key offerings
                • SWOT
              • 15.11 Skipper Ltd.
                • Skipper Ltd. - Overview
                • Skipper Ltd. - Business segments
                • Skipper Ltd. - Key news
                • Skipper Ltd. - Key offerings
                • Skipper Ltd. - Segment focus
                • SWOT
              • 15.12 STELLA JONES INC.
                • STELLA JONES INC. - Overview
                • STELLA JONES INC. - Business segments
                • STELLA JONES INC. - Key offerings
                • STELLA JONES INC. - Segment focus
                • SWOT
              • 15.13 Valmont Industries Inc.
                • Valmont Industries Inc. - Overview
                • Valmont Industries Inc. - Business segments
                • Valmont Industries Inc. - Key offerings
                • Valmont Industries Inc. - Segment focus
                • SWOT

              16 Appendix

              • 16.1 Scope of the report
                • 16.2 Inclusions and exclusions checklist
                  • Inclusions checklist
                  • Exclusions checklist
                • 16.3 Currency conversion rates for US$
                  • Currency conversion rates for US$
                • 16.4 Research methodology
                  • Research methodology
                • 16.5 Data procurement
                  • Information sources
                • 16.6 Data validation
                  • Data validation
                • 16.7 Validation techniques employed for market sizing
                  • Validation techniques employed for market sizing
                • 16.8 Data synthesis
                  • Data synthesis
                • 16.9 360 degree market analysis
                  • 360 degree market analysis
                • 16.10 List of abbreviations
                  • List of abbreviations

                Research Methodology

                Technavio presents a detailed picture of the market by way of study, synthesis, and summation of data from multiple sources. The analysts have presented the various facets of the market with a particular focus on identifying the key industry influencers. The data thus presented is comprehensive, reliable, and the result of extensive research, both primary and secondary.

                INFORMATION SOURCES

                Primary sources

                • Manufacturers and suppliers
                • Channel partners
                • Industry experts
                • Strategic decision makers

                Secondary sources

                • Industry journals and periodicals
                • Government data
                • Financial reports of key industry players
                • Historical data
                • Press releases

                DATA ANALYSIS

                Data Synthesis

                • Collation of data
                • Estimation of key figures
                • Analysis of derived insights

                Data Validation

                • Triangulation with data models
                • Reference against proprietary databases
                • Corroboration with industry experts

                REPORT WRITING

                Qualitative

                • Market drivers
                • Market challenges
                • Market trends
                • Five forces analysis

                Quantitative

                • Market size and forecast
                • Market segmentation
                • Geographical insights
                • Competitive landscape

                Interested in this report?

                Get your sample now to see our research methodology and insights!

                Download Now

                Frequently Asked Questions

                Utility Poles market growth will increase by $ 9012 mn during 2025-2029.

                The Utility Poles market is expected to grow at a CAGR of 3.4% during 2025-2029.

                Utility Poles market is segmented by Type( Distribution poles, Transmission poles) Material( Steel, Concrete, Composite, Wood, Middle East and Africa) Application( Transmission line, Distribution line, Telecommunication, Others)

                Arcosa Inc., Bell Lumber and Pole Co., Bridgewell Resources LLC, EL Sewedy Electric Co., FUCHS Europoles GmbH, Hill and Smith Holdings Plc, Koppers Holdings Inc., NIPPON CONCRETE INDUSTRIES CO. LTD., Pelco Products Inc., RS Technologies Inc., Saleh and Abdulaziz Abahsain Co. Ltd., Skipper Ltd., STELLA JONES INC., Valmont Industries Inc. are a few of the key vendors in the Utility Poles market.

                North America will register the highest growth rate of 42% among the other regions. Therefore, the Utility Poles market in North America is expected to garner significant business opportunities for the vendors during the forecast period.

                US, China, Japan, Canada, India, UK, South Korea, Germany, Australia, France

                • Growing focus on energy efficiencyThe increase in the consumption of energy across the globe is driving the global utility pole market. Utility poles are primarily used to support and carry electricity lines is the driving factor this market.
                • distribution lines is the driving factor this market.
                • and sub-transmission lines. Power transmission and distribution in utility poles are key applications and play an important role in maintaining electricity networks; in this process is the driving factor this market.
                • power is transferred from power stations to regional substations and further to homes or facilities of end consumers. Moreover is the driving factor this market.
                • utility poles are used in the communication sector to carry coaxial cables for television broadcasting and fiber optic cables for telecommunication lines. Therefore is the driving factor this market.
                • these factors are expected to enhance the growth of the market during the forecast period. Energy efficiency requires energy to be used efficiently throughout the energy chain from production to consumption. In a power grid is the driving factor this market.
                • the power is the driving factor this market.
                • in terms of the quantity received is the driving factor this market.
                • is always lower than the power produced at the source is the driving factor this market.
                • this is due to thermal losses owing to electrical resistivity and conductivity of the transmitting material is the driving factor this market.
                • and these losses are generally referred to as transmission and distribution losses in utility poles. In countries with old and less optimized electrical infrastructure is the driving factor this market.
                • the average transmission and distribution losses in utility poles were higher. Power voltage is usually stepped up for long-distance transmission is the driving factor this market.
                • which is then stepped down to usable voltage and distributed to commercial and residential end-users. During this process is the driving factor this market.
                • a small percentage of power is lost in the form of heat is the driving factor this market.
                • dissipated into a magnetic field is the driving factor this market.
                • and absorbed in insulating materials. Reducing these losses will result in delivering more power to the users. For instance is the driving factor this market.
                • reducing losses by a percent for a power generation of 1GW will save 10 MW of power in transmission and distribution losses in utility poles. This is a significant saving and can power 1 is the driving factor this market.
                • 000 - 2 is the driving factor this market.
                • 000 residential users. Power saving and energy efficiency thus have become valuable positive externalities. Replacing older equipment on the grid with newer technologies will result in significant savings across the transmission and distribution structure in utility poles. For instance is the driving factor this market.
                • upgrading to HVDC cables in the transmission lines will improve load-carrying capacity is the driving factor this market.
                • which is 2-3 times the load-carrying capacity of conventional cables at low losses. This enables effective peak hour load management and reduces stress on the grid is the driving factor this market.
                • thus reducing heat generation due to heavy loads. The need for enhanced energy efficiency and reduced transmission and distribution losses will drive infrastructural upgrades and the demand for utility poles over the forecast period. is the driving factor this market.

                The Utility Poles market vendors should focus on grabbing business opportunities from the Distribution poles segment as it accounted for the largest market share in the base year.