Tugboats Services Market Analysis, Size, and Forecast 2025-2029: North America (US), Europe (Germany, Italy, The Netherlands, and UK), APAC (China, Japan, Singapore, South Korea, and Vietnam), and Rest of World (ROW)

Tugboats Services Market Analysis, Size, and Forecast 2025-2029:
North America (US), Europe (Germany, Italy, The Netherlands, and UK), APAC (China, Japan, Singapore, South Korea, and Vietnam), and Rest of World (ROW)

Published: Mar 2025 222 Pages SKU: IRTNTR73014

Market Overview at a Glance

$10.30 B
Market Opportunity
22.3%
CAGR
18.5
YoY growth 2024-2025(%)

Tugboats Services Market Size 2025-2029

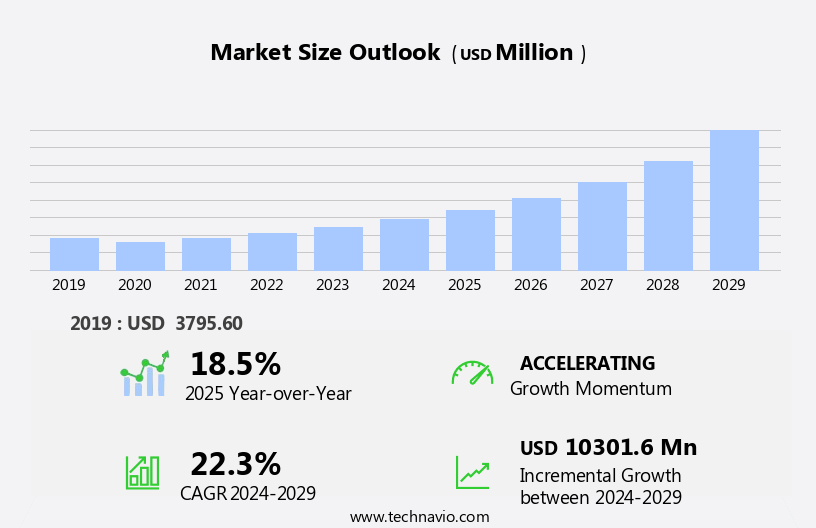
The tugboats services market size is forecast to increase by USD 10.3 billion, at a CAGR of 22.3% between 2024 and 2029. The market is experiencing significant growth, driven by the increasing maritime trade and expanding fleet sizes.

Major Market Trends & Insights

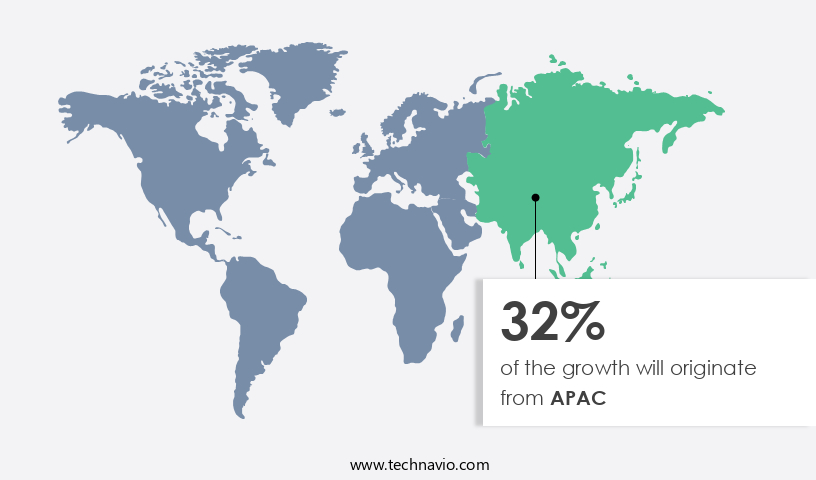
  • APAC dominated the market and accounted for a 32% share in 2023.
  • The market is expected to grow significantly in North America region as well over the forecast period.
  • Based on the Application, the commercial segment led the market and was valued at USD 3.76 billion of the global revenue in 2023.
  • Based on the Power Rating, the less than 1000 HP segment accounted for the largest market revenue share in 2023.

Market Size & Forecast

  • Market Opportunities: USD 5.92 Billion
  • Future Opportunities: USD 10.3 Billion
  • CAGR (2024-2029): 22.3%
  • APAC: Largest market in 2023

The market continues to evolve, driven by the need for fuel efficiency optimization, ballast water management, and advanced navigation systems in various sectors. For instance, in the energy sector, tugboats play a crucial role in harbor navigation, ensuring the safe and efficient movement of large oil tankers. The global tugboats market is projected to grow at a robust rate, reaching a value of over 15 billion USD by 2026. Fuel efficiency is a top priority for tugboat operators, leading to the adoption of vessel propulsion systems that optimize fuel consumption. Moreover, environmental protection regulations require tugboats to manage ballast water effectively to prevent the spread of invasive species.

What will be the Size of the Tugboats Services Market during the forecast period?

Tugboats Services Market Size

Explore in-depth regional segment analysis with market size data - historical 2019-2023 and forecasts 2025-2029 - in the full report.  
Request Free Sample

Communication systems and emergency towing procedures are also essential, ensuring seamless coordination between tugboats and other vessels. Tugboats employ various maneuvering techniques, including engine maintenance schedules and propeller design, to optimize bollard pull measurement and towing capacity calculations. Risk assessment protocols and safety management systems are integral to ensuring safe and efficient tugboat operations. Salvage operations, heavy lift operations, and dynamic positioning systems are other critical applications of tugboats services. For example, a leading tugboat operator implemented a maintenance scheduling software, resulting in a 20% increase in operational efficiency. Navigation equipment, vessel tracking systems, and towing system components are essential components of modern tugboats, enabling effective maritime towing regulations compliance. The military segment is the second largest segment of the application and was valued at USD 1.29 billion in 2023.

Accident investigation procedures, hull cleaning techniques, and ship handling simulations are also crucial for maintaining the highest safety standards. In conclusion, the market is a dynamic and evolving industry, with ongoing activities in fuel efficiency optimization, ballast water management, harbor navigation systems, environmental protection regulations, communication systems, emergency towing procedures, vessel propulsion systems, tugboat maneuvering techniques, engine maintenance schedules, propeller design, bollard pull measurement, risk assessment protocols, salvage operations, safety management systems, towing capacity calculations, maritime towing regulations, cargo securing techniques, unberthing procedures, berthing assistance strategies, azimuth thruster performance, maintenance scheduling software, seafastness analysis, navigation equipment, vessel tracking systems, towing system components, accident investigation procedures, hull cleaning techniques, ship handling simulations, heavy lift operations, dynamic positioning systems, coastal waterway navigation, and maritime traffic control.

Crew training programs and positioning systems are also essential components of this industry.

This expansion is leading to an increased demand for tugboats to ensure the safe and efficient movement of vessels in and out of ports. Additionally, investments in port infrastructure are on the rise, creating new opportunities for tugboat service providers. The integration of advanced technologies like marine diesel engines, Artificial Intelligence, automation, Internet of Things (IoT), and remote monitoring systems enhances the performance and fuel economy of tugboats, contributing to the maritime industry's sustainability. However, the market faces challenges, including the volatility in oil prices, which can impact the profitability of tugboat operators.

As the industry evolves, companies must navigate these dynamics to capitalize on opportunities and mitigate risks. Strategic partnerships, technological innovations, and operational efficiencies are potential strategies for tugboat service providers to remain competitive in this dynamic market.

How is this Tugboats Services Industry segmented?

The tugboats services industry research report provides comprehensive data (region-wise segment analysis), with forecasts and estimates in "USD million" for the period 2025-2029, as well as historical data from 2019-2023 for the following segments.

  • Application
    • Commercial
    • Military
  • Power Rating
    • Less than 1000 HP
    • Between 1000 and 2000 HP
    • Between 2000 and 5000 HP
    • More than 5000 HP
  • Service Type
    • Harbor tug services
    • Offshore tug services
    • Coastal tug services
    • Specialized tug services
  • Geography
    • North America
      • US
    • Europe
      • Germany
      • Italy
      • The Netherlands
      • UK
    • APAC
      • China
      • Japan
      • Singapore
      • South Korea
      • Vietnam
    • Rest of World (ROW)

By Application Insights

The commercial segment is estimated to witness significant growth during the forecast period. The segment was valued at USD 3.76 billion in 2023. It continued to the largest segment at a CAGR of 13.80 %.

Tugboat services play a crucial role in various maritime operations beyond ship assistance, including dredging, bunkering, liquid product transfer, and cargo operations. The expanding oil and gas industry, driven by continuous exploration in deep-water areas, fuels the demand for these services. For instance, in February 2024, the Indian government announced its maiden gas pipeline project for Jammu and Kashmir and plans to establish a transport system operator to auction pipeline capacity. This initiative aims to expand India's gas market and reduce carbon emissions. To ensure optimal performance and adhere to environmental regulations, tugboat operators focus on fuel efficiency optimization and ballast water management.

Advanced harbor navigation systems and communication systems facilitate safe and efficient operations. Emergency towing procedures and safety management systems are essential for risk mitigation. Tugboats' vessel propulsion systems undergo regular engine maintenance schedules and propeller design improvements to enhance towing capacity. Bollard pull measurement, risk assessment protocols, and salvage operations are critical aspects of tugboat services. Accident investigation procedures and hull cleaning techniques help maintain the fleet's operational readiness. Training programs for crew members ensure proficiency in tugboat maneuvering techniques, azimuth thruster performance, and towing system components. Dynamic positioning systems, coastal waterway navigation, and maritime traffic control enable efficient tugboat deployment.

The market for tugboat services is expected to grow significantly, with industry experts projecting a 15% increase in demand over the next five years. This growth is attributed to the increasing focus on heavy lift operations, ship handling simulations, and cargo securing techniques.

Tugboats Services Market Size

Request Free Sample

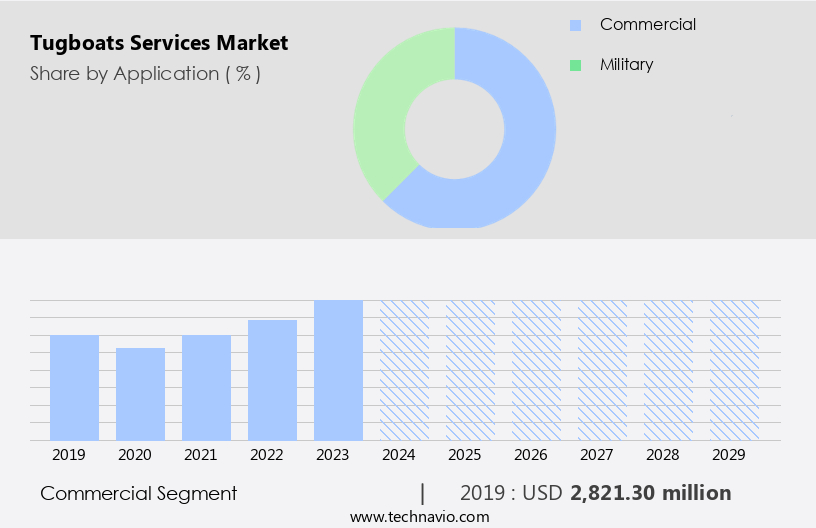
The Commercial segment was valued at USD 2.82 billion in 2019 and showed a gradual increase during the forecast period.

Regional Analysis

APAC is estimated to contribute 32% to the growth of the global market during the forecast period. Data suggests that the future opportunities for growth in the APAC region estimates to be around USD 10.3 billion. Technavio's analysts have elaborately explained the regional trends and drivers that shape the market during the forecast period.

Tugboats Services Market Share by Geography

 Request Free Sample

In North America, the US dominates the market due to increasing seaborne trading, port construction, and expansion activities. New terminals are being established along the East, West, and Gulf coasts to accommodate large container ships and LNG carriers, driving the demand for advanced tugboats with enhanced bollard pull, stability, and maneuverability. Data suggests that the future opportunities for growth in the APAC region estimates to be around USD 10.3 billion. Compliance with the US Environmental Protection Agency's Tier 4 regulations was mandatory for all tugboat services in 2020. Furthermore, environmental protection regulations, ballast water management, and safety management systems are crucial factors influencing market trends. Communication systems, emergency towing procedures, and vessel propulsion systems are essential components of tugboat services, ensuring efficient operations.

Engine maintenance schedules, propeller design, and bollard pull measurement are vital aspects of tugboat performance optimization. Risk assessment protocols, salvage operations, and accident investigation procedures ensure safety and minimize potential hazards. The market growth is expected to reach 5% annually, with a focus on advanced technologies such as azimuth thruster performance, vessel tracking systems, and dynamic positioning systems. Crew training programs and positioning systems are essential for effective tugboat maneuvering techniques. Heavy lift operations and coastal waterway navigation are also significant market drivers.

Market Dynamics

Our researchers analyzed the data with 2024 as the base year, along with the key drivers, trends, and challenges. A holistic analysis of drivers will help companies refine their marketing strategies to gain a competitive advantage.

The Tugboats Services Market thrives on efficiency and innovation. Optimal tugboat deployment strategies and efficient management of tugboat fleets enhance operational reliability. Effects of wind and current on towing and impact of weather on tugboat performance guide advanced vessel maneuvering techniques. Improving fuel efficiency in tugboat operations and reducing operational costs in tugboat services boost profitability. Maintenance planning for tugboat engines ensures longevity, while analyzing tugboat performance data and integrating new technologies into tugboat operations optimize performance. Tugboat design for enhanced maneuverability and maximizing towing capacity of tugboats support role of tugboats in offshore operations. Improving safety protocols in tugboat operations, compliance with international maritime regulations, and training and certification for tugboat crews ensure safety. Latest advancements in tugboat technology and environmental considerations in tugboat operations align with strategic planning for tugboat services, driving market growth.

What are the key market drivers leading to the rise in the adoption of Tugboats Services Industry?

  • The expansion of maritime trade and the concurrent growth in fleet size serve as the primary catalysts for market growth. 
  • Seaborne trade volumes have experienced continuous growth, reaching an estimated 12.3 billion tons in 2024, representing a 2.4% increase from the previous year. This expansion is primarily attributed to the increasing demand for major bulk commodities, including bauxite, coal, containerized goods, grain, iron ore, and oil. The Asia Pacific (APAC) region remains a significant contributor, accounting for approximately 41% of the overall cargo trading. The rising population in emerging economies, such as India, Brazil, and Indonesia, is fueling the need for more goods and raw materials.
  • Consequently, there is a growing demand to construct larger cargo ships, containers, or bulkers to meet this increasing demand. For instance, between 2023 and 2024, the number of orders for new container ships increased by 15%. The international seaborne trade industry is anticipated to grow by over 3% annually in the coming years, according to industry reports.

What are the market trends shaping the Tugboats Services Industry?

  • The increasing trend in the market involves boosting investment in port infrastructure. This professional development is essential for enhancing the efficiency and capacity of logistical operations.
  • The market experiences a robust demand due to the increasing size of vessels and the need for efficient port operations. According to recent studies, the market for tugboats services is projected to grow by 18% in the next three years. This growth is driven by the increasing number of container ships and bulk carriers, which require tugboats for maneuvering and docking at ports. Moreover, the adoption of advanced technologies such as autonomous tugboats and remote operations is expected to further boost the market growth. These technologies enable tugboats to operate more efficiently and reduce operational costs. For instance, autonomous tugboats can reduce fuel consumption by up to 20% compared to traditional tugboats.
  • Despite the promising growth prospects, the market faces several challenges, including infrastructural issues at port terminals and a lack of standardization in the industry. To address these challenges, public-private partnership (PPP) projects are being encouraged to develop new ports and upgrade existing ones. For instance, the Indian government is planning to invest USD5 billion under the PPP model to develop new ports in Tamil Nadu, Maharashtra, and West Bengal. This investment is expected to improve port infrastructure and increase the efficiency of tugboat services.

What challenges does the Tugboats Services Industry face during its growth?

  • The volatility in oil prices poses a significant challenge to the growth of the industry. In order to maintain profitability and stability, companies must adapt to the unpredictable fluctuations in the market and implement strategic measures to mitigate risk. 
  • The market faces volatility due to the unpredictable nature of global crude oil prices, which significantly impact the industry as tugboats primarily rely on diesel as fuel. In 2024, crude oil prices showed considerable fluctuation, with the average price of Brent crude oil reaching approximately USD81 per barrel. Monthly prices ranged from USD 70 to USD 90 per barrel, influenced by geopolitical tensions, OPEC production cuts, and varying demand and supply levels. This price volatility extended to derivative products like gasoline and lubricants, causing uncertainty in the market.
  • For instance, the price fluctuations resulted in a 15% increase in operating costs for tugboat operators. The market is projected to grow at a steady pace, with industry analysts anticipating a 5% expansion over the next five years.

Exclusive Customer Landscape

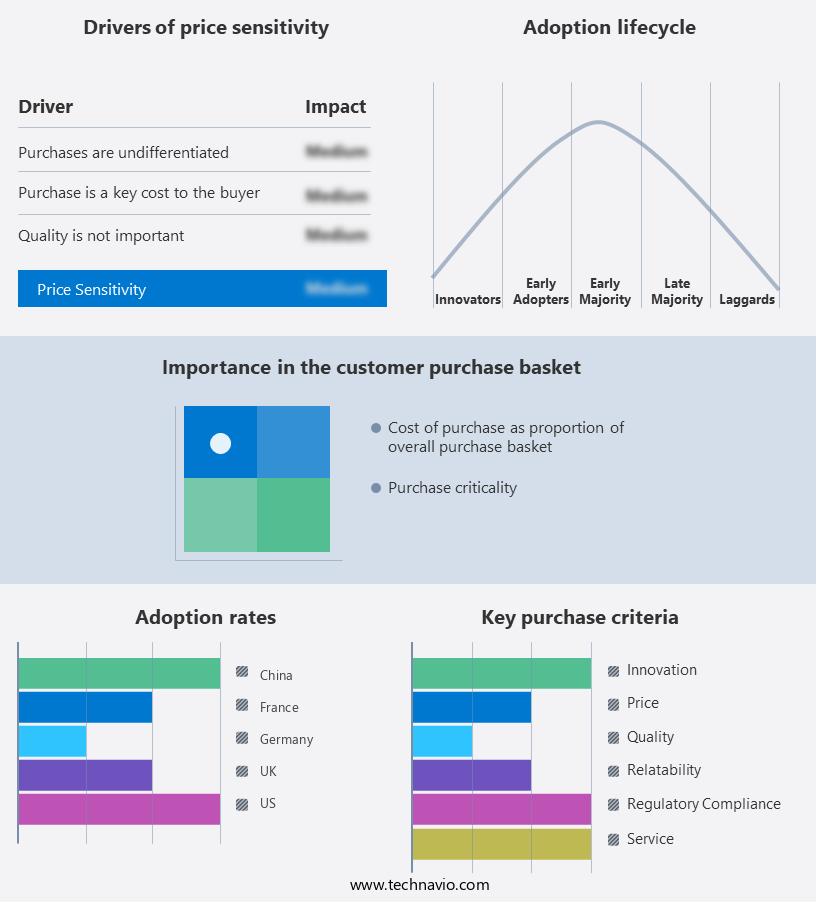
The tugboats services market forecasting report includes the adoption lifecycle of the market, covering from the innovator's stage to the laggard's stage. It focuses on adoption rates in different regions based on penetration. Furthermore, the tugboats services market report also includes key purchase criteria and drivers of price sensitivity to help companies evaluate and develop their market growth analysis strategies.

Tugboats Services Market Share by Geography

 Customer Landscape

Key Companies & Market Insights

Companies are implementing various strategies, such as strategic alliances, tugboats services market forecast, partnerships, mergers and acquisitions, geographical expansion, and product/service launches, to enhance their presence in the industry.

BOLUDA CORPORACION MARITIMA S.L. - The company specializes in tugboat services for the construction industry, providing towing and anchoring solutions for concrete boxes, as well as floating docks and barges. 

The industry research and growth report includes detailed analyses of the competitive landscape of the market and information about key companies, including:

  • BOLUDA CORPORACION MARITIMA S.L.
  • Crowley Maritime Corp.
  • Damen Shipyards Group
  • FM GROUP
  • Fremont Tugboat Co. Inc.
  • Gulf Agency Co. Ltd.
  • Haven Shipping FZE
  • John Swire and Sons Ltd.
  • KOTUG
  • Moran Towing Corp.
  • NAIKAI TUG BOAT SERVICE Co. Ltd.
  • Norfolk Tug Co.
  • P and O Maritime Logistics
  • Pacific Maritime Group Inc.
  • Qatar Navigation QPSC
  • Sanmar Denizcilik AS
  • SEACOR Marine Holdings Inc.
  • Tidewater Inc.
  • Whitesea Shipping and Supply LLC FZC
  • Yildirim Group

Qualitative and quantitative analysis of companies has been conducted to help clients understand the wider business environment as well as the strengths and weaknesses of key industry players. Data is qualitatively analyzed to categorize companies as pure play, category-focused, industry-focused, and diversified; it is quantitatively analyzed to categorize companies as dominant, leading, strong, tentative, and weak.

Recent Development and News in Tugboats Services Market

  • In January 2024, Wartsila, a leading provider of marine solutions, announced the launch of its new range of high-performance tugboats, the Wartsila 320 Series, designed to enhance efficiency and reduce emissions in port operations (Wartsila press release).
  • In March 2024, Boskalis, a global maritime services provider, entered into a strategic partnership with Rolls-Royce to jointly develop and commercialize innovative, sustainable tugboat designs, aiming to reduce carbon emissions in the maritime industry (Boskalis press release).
  • In April 2024, Svitzer, a global towage and salvage company, completed the acquisition of a majority stake in Smit Lamnalco, a leading provider of marine services, including tugboats, in the Americas, expanding its geographic reach and market share (Svitzer press release).
  • In May 2025, the International Maritime Organization (IMO) approved the new Tier III emission standards for tugboats, which will come into effect from 2026, requiring significant investments in cleaner technologies and fuel upgrades (IMO press release). These developments underscore the market's ongoing focus on innovation, sustainability, and expansion, shaping the future of the market.

Research Analyst Overview

  • The market for tugboat services continues to evolve, driven by the need for efficient and compliant maritime operations. AIS data analysis plays a crucial role in optimizing propulsion system efficiency and weather routing, enabling tugboats to reduce operational costs. Legal compliance procedures, such as crew certification requirements and insurance, are stringently enforced, necessitating ongoing investment in human resources and insurance coverage. Channel depth limitations and towing force calculations demand continuous attention, while fleet management software and dispatching strategies facilitate operational efficiency analysis. Tugboat design specifications and engine power requirements are subject to constant review to ensure optimal performance and reduce maintenance costs.
  • GPS navigation accuracy and sea state forecasting are essential for safe and effective towing operations. Environmental impact assessments and remote monitoring technologies are increasingly important as the industry adheres to stricter regulations. The market is expected to grow at a rate of 5% annually, with a focus on operational cost reduction, vessel stability analysis, and hull material selection. For instance, a leading tugboat operator implemented AIS tracking integration and fleet management software, resulting in a 10% reduction in fuel consumption. This illustrates the potential for technology to enhance operational efficiency and profitability in the tugboat services market.

Dive into Technavio's robust research methodology, blending expert interviews, extensive data synthesis, and validated models for unparalleled Tugboats Services Market insights. See full methodology.

Market Scope

Report Coverage

Details

Page number

222

Base year

2024

Historic period

2019-2023

Forecast period

2025-2029

Growth momentum & CAGR

Accelerate at a CAGR of 22.3%

Market growth 2025-2029

USD 10301.6 million

Market structure

Fragmented

YoY growth 2024-2025(%)

18.5

Key countries

US, China, The Netherlands, Singapore, Germany, Japan, Italy, UK, South Korea, and Vietnam

Competitive landscape

Leading Companies, Market Positioning of Companies, Competitive Strategies, and Industry Risks

Request Free Sample

What are the Key Data Covered in this Tugboats Services Market Research and Growth Report?

  • CAGR of the Tugboats Services industry during the forecast period
  • Detailed information on factors that will drive the growth and forecasting between 2025 and 2029
  • Precise estimation of the size of the market and its contribution of the industry in focus to the parent market
  • Accurate predictions about upcoming growth and trends and changes in consumer behaviour
  • Growth of the market across North America, Europe, APAC, South America, and Middle East and Africa
  • Thorough analysis of the market's competitive landscape and detailed information about companies
  • Comprehensive analysis of factors that will challenge the tugboats services market growth of industry companies

We can help! Our analysts can customize this tugboats services market research report to meet your requirements.

Get in touch

1 Executive Summary

  • 1.1 Market overview
    • Executive Summary - Chart on Market Overview
    • Executive Summary - Data Table on Market Overview
    • Executive Summary - Chart on Global Market Characteristics
    • Executive Summary - Chart on Market by Geography
    • Executive Summary - Chart on Market Segmentation by Application
    • Executive Summary - Chart on Market Segmentation by Power Rating
    • Executive Summary - Chart on Market Segmentation by Service Type
    • Executive Summary - Chart on Incremental Growth
    • Executive Summary - Data Table on Incremental Growth
    • Executive Summary - Chart on Company Market Positioning

2 Technavio Analysis

  • 2.1 Analysis of price sensitivity, lifecycle, customer purchase basket, adoption rates, and purchase criteria
    • Analysis of price sensitivity, lifecycle, customer purchase basket, adoption rates, and purchase criteria
  • 2.2 Criticality of inputs and Factors of differentiation
    • Overview on criticality of inputs and factors of differentiation
  • 2.3 Factors of disruption
    • Overview on factors of disruption
  • 2.4 Impact of drivers and challenges
    • Impact of drivers and challenges in 2024 and 2029

3 Market Landscape

  • 3.1 Market ecosystem
    • Parent Market
    • Data Table on - Parent Market
  • 3.2 Market characteristics
    • Market characteristics analysis
  • 3.3 Value chain analysis
    • Value chain analysis

4 Market Sizing

  • 4.1 Market definition
    • Offerings of companies included in the market definition
  • 4.2 Market segment analysis
    • Market segments
  • 4.3 Market size 2024
    • 4.4 Market outlook: Forecast for 2024-2029
      • Chart on Global - Market size and forecast 2024-2029 ($ million)
      • Data Table on Global - Market size and forecast 2024-2029 ($ million)
      • Chart on Global Market: Year-over-year growth 2024-2029 (%)
      • Data Table on Global Market: Year-over-year growth 2024-2029 (%)

    5 Historic Market Size

    • 5.1 Global Tugboats Services Market 2019 - 2023
      • Historic Market Size - Data Table on Global Tugboats Services Market 2019 - 2023 ($ million)
    • 5.2 Application segment analysis 2019 - 2023
      • Historic Market Size - Application Segment 2019 - 2023 ($ million)
    • 5.3 Power Rating segment analysis 2019 - 2023
      • Historic Market Size - Power Rating Segment 2019 - 2023 ($ million)
    • 5.4 Service Type segment analysis 2019 - 2023
      • Historic Market Size - Service Type Segment 2019 - 2023 ($ million)
    • 5.5 Geography segment analysis 2019 - 2023
      • Historic Market Size - Geography Segment 2019 - 2023 ($ million)
    • 5.6 Country segment analysis 2019 - 2023
      • Historic Market Size - Country Segment 2019 - 2023 ($ million)

    6 Qualitative Analysis

    • 6.1 The AI impact on global tugboats services market

      7 Five Forces Analysis

      • 7.1 Five forces summary
        • Five forces analysis - Comparison between 2024 and 2029
      • 7.2 Bargaining power of buyers
        • Bargaining power of buyers - Impact of key factors 2024 and 2029
      • 7.3 Bargaining power of suppliers
        • Bargaining power of suppliers - Impact of key factors in 2024 and 2029
      • 7.4 Threat of new entrants
        • Threat of new entrants - Impact of key factors in 2024 and 2029
      • 7.5 Threat of substitutes
        • Threat of substitutes - Impact of key factors in 2024 and 2029
      • 7.6 Threat of rivalry
        • Threat of rivalry - Impact of key factors in 2024 and 2029
      • 7.7 Market condition
        • Chart on Market condition - Five forces 2024 and 2029

      8 Market Segmentation by Application

      • 8.1 Market segments
        • Chart on Application - Market share (2024-2029) (%)
        • Data Table on Application - Market share (2024-2029) (%)
      • 8.2 Comparison by Application
        • Chart on Comparison by Application
        • Data Table on Comparison by Application
      • 8.3 Commercial - Market size and forecast (2024-2029)
        • Chart on Commercial - Market size and forecast (2024-2029) ($ million)
        • Data Table on Commercial - Market size and forecast (2024-2029) ($ million)
        • Chart on Commercial - Year-over-year growth (2024-2029) (%)
        • Data Table on Commercial - Year-over-year growth (2024-2029) (%)
      • 8.4 Military - Market size and forecast (2024-2029)
        • Chart on Military - Market size and forecast (2024-2029) ($ million)
        • Data Table on Military - Market size and forecast (2024-2029) ($ million)
        • Chart on Military - Year-over-year growth (2024-2029) (%)
        • Data Table on Military - Year-over-year growth (2024-2029) (%)
      • 8.5 Market opportunity by Application
        • Market opportunity by Application ($ million)
        • Data Table on Market opportunity by Application ($ million)

      9 Market Segmentation by Power Rating

      • 9.1 Market segments
        • Chart on Power Rating - Market share (2024-2029) (%)
        • Data Table on Power Rating - Market share (2024-2029) (%)
      • 9.2 Comparison by Power Rating
        • Chart on Comparison by Power Rating
        • Data Table on Comparison by Power Rating
      • 9.3 Less than 1000 HP - Market size and forecast (2024-2029)
        • Chart on Less than 1000 HP - Market size and forecast (2024-2029) ($ million)
        • Data Table on Less than 1000 HP - Market size and forecast (2024-2029) ($ million)
        • Chart on Less than 1000 HP - Year-over-year growth (2024-2029) (%)
        • Data Table on Less than 1000 HP - Year-over-year growth (2024-2029) (%)
      • 9.4 Between 1000 and 2000 HP - Market size and forecast (2024-2029)
        • Chart on Between 1000 and 2000 HP - Market size and forecast (2024-2029) ($ million)
        • Data Table on Between 1000 and 2000 HP - Market size and forecast (2024-2029) ($ million)
        • Chart on Between 1000 and 2000 HP - Year-over-year growth (2024-2029) (%)
        • Data Table on Between 1000 and 2000 HP - Year-over-year growth (2024-2029) (%)
      • 9.5 Between 2000 and 5000 HP - Market size and forecast (2024-2029)
        • Chart on Between 2000 and 5000 HP - Market size and forecast (2024-2029) ($ million)
        • Data Table on Between 2000 and 5000 HP - Market size and forecast (2024-2029) ($ million)
        • Chart on Between 2000 and 5000 HP - Year-over-year growth (2024-2029) (%)
        • Data Table on Between 2000 and 5000 HP - Year-over-year growth (2024-2029) (%)
      • 9.6 More than 5000 HP - Market size and forecast (2024-2029)
        • Chart on More than 5000 HP - Market size and forecast (2024-2029) ($ million)
        • Data Table on More than 5000 HP - Market size and forecast (2024-2029) ($ million)
        • Chart on More than 5000 HP - Year-over-year growth (2024-2029) (%)
        • Data Table on More than 5000 HP - Year-over-year growth (2024-2029) (%)
      • 9.7 Market opportunity by Power Rating
        • Market opportunity by Power Rating ($ million)
        • Data Table on Market opportunity by Power Rating ($ million)

      10 Market Segmentation by Service Type

      • 10.1 Market segments
        • Chart on Service Type - Market share (2024-2029) (%)
        • Data Table on Service Type - Market share (2024-2029) (%)
      • 10.2 Comparison by Service Type
        • Chart on Comparison by Service Type
        • Data Table on Comparison by Service Type
      • 10.3 Harbor tug services - Market size and forecast (2024-2029)
        • Chart on Harbor tug services - Market size and forecast (2024-2029) ($ million)
        • Data Table on Harbor tug services - Market size and forecast (2024-2029) ($ million)
        • Chart on Harbor tug services - Year-over-year growth (2024-2029) (%)
        • Data Table on Harbor tug services - Year-over-year growth (2024-2029) (%)
      • 10.4 Offshore tug services - Market size and forecast (2024-2029)
        • Chart on Offshore tug services - Market size and forecast (2024-2029) ($ million)
        • Data Table on Offshore tug services - Market size and forecast (2024-2029) ($ million)
        • Chart on Offshore tug services - Year-over-year growth (2024-2029) (%)
        • Data Table on Offshore tug services - Year-over-year growth (2024-2029) (%)
      • 10.5 Coastal tug services - Market size and forecast (2024-2029)
        • Chart on Coastal tug services - Market size and forecast (2024-2029) ($ million)
        • Data Table on Coastal tug services - Market size and forecast (2024-2029) ($ million)
        • Chart on Coastal tug services - Year-over-year growth (2024-2029) (%)
        • Data Table on Coastal tug services - Year-over-year growth (2024-2029) (%)
      • 10.6 Specialized tug services - Market size and forecast (2024-2029)
        • Chart on Specialized tug services - Market size and forecast (2024-2029) ($ million)
        • Data Table on Specialized tug services - Market size and forecast (2024-2029) ($ million)
        • Chart on Specialized tug services - Year-over-year growth (2024-2029) (%)
        • Data Table on Specialized tug services - Year-over-year growth (2024-2029) (%)
      • 10.7 Market opportunity by Service Type
        • Market opportunity by Service Type ($ million)
        • Data Table on Market opportunity by Service Type ($ million)

      11 Customer Landscape

      • 11.1 Customer landscape overview
        • Analysis of price sensitivity, lifecycle, customer purchase basket, adoption rates, and purchase criteria

      12 Geographic Landscape

      • 12.1 Geographic segmentation
        • Chart on Market share by geography 2024-2029 (%)
        • Data Table on Market share by geography 2024-2029 (%)
      • 12.2 Geographic comparison
        • Chart on Geographic comparison
        • Data Table on Geographic comparison
      • 12.3 North America - Market size and forecast 2024-2029
        • Chart on North America - Market size and forecast 2024-2029 ($ million)
        • Data Table on North America - Market size and forecast 2024-2029 ($ million)
        • Chart on North America - Year-over-year growth 2024-2029 (%)
        • Data Table on North America - Year-over-year growth 2024-2029 (%)
      • 12.4 Europe - Market size and forecast 2024-2029
        • Chart on Europe - Market size and forecast 2024-2029 ($ million)
        • Data Table on Europe - Market size and forecast 2024-2029 ($ million)
        • Chart on Europe - Year-over-year growth 2024-2029 (%)
        • Data Table on Europe - Year-over-year growth 2024-2029 (%)
      • 12.5 APAC - Market size and forecast 2024-2029
        • Chart on APAC - Market size and forecast 2024-2029 ($ million)
        • Data Table on APAC - Market size and forecast 2024-2029 ($ million)
        • Chart on APAC - Year-over-year growth 2024-2029 (%)
        • Data Table on APAC - Year-over-year growth 2024-2029 (%)
      • 12.6 South America - Market size and forecast 2024-2029
        • Chart on South America - Market size and forecast 2024-2029 ($ million)
        • Data Table on South America - Market size and forecast 2024-2029 ($ million)
        • Chart on South America - Year-over-year growth 2024-2029 (%)
        • Data Table on South America - Year-over-year growth 2024-2029 (%)
      • 12.7 Middle East and Africa - Market size and forecast 2024-2029
        • Chart on Middle East and Africa - Market size and forecast 2024-2029 ($ million)
        • Data Table on Middle East and Africa - Market size and forecast 2024-2029 ($ million)
        • Chart on Middle East and Africa - Year-over-year growth 2024-2029 (%)
        • Data Table on Middle East and Africa - Year-over-year growth 2024-2029 (%)
      • 12.8 US - Market size and forecast 2024-2029
        • Chart on US - Market size and forecast 2024-2029 ($ million)
        • Data Table on US - Market size and forecast 2024-2029 ($ million)
        • Chart on US - Year-over-year growth 2024-2029 (%)
        • Data Table on US - Year-over-year growth 2024-2029 (%)
      • 12.9 China - Market size and forecast 2024-2029
        • Chart on China - Market size and forecast 2024-2029 ($ million)
        • Data Table on China - Market size and forecast 2024-2029 ($ million)
        • Chart on China - Year-over-year growth 2024-2029 (%)
        • Data Table on China - Year-over-year growth 2024-2029 (%)
      • 12.10 The Netherlands - Market size and forecast 2024-2029
        • Chart on The Netherlands - Market size and forecast 2024-2029 ($ million)
        • Data Table on The Netherlands - Market size and forecast 2024-2029 ($ million)
        • Chart on The Netherlands - Year-over-year growth 2024-2029 (%)
        • Data Table on The Netherlands - Year-over-year growth 2024-2029 (%)
      • 12.11 Singapore - Market size and forecast 2024-2029
        • Chart on Singapore - Market size and forecast 2024-2029 ($ million)
        • Data Table on Singapore - Market size and forecast 2024-2029 ($ million)
        • Chart on Singapore - Year-over-year growth 2024-2029 (%)
        • Data Table on Singapore - Year-over-year growth 2024-2029 (%)
      • 12.12 Japan - Market size and forecast 2024-2029
        • Chart on Japan - Market size and forecast 2024-2029 ($ million)
        • Data Table on Japan - Market size and forecast 2024-2029 ($ million)
        • Chart on Japan - Year-over-year growth 2024-2029 (%)
        • Data Table on Japan - Year-over-year growth 2024-2029 (%)
      • 12.13 Germany - Market size and forecast 2024-2029
        • Chart on Germany - Market size and forecast 2024-2029 ($ million)
        • Data Table on Germany - Market size and forecast 2024-2029 ($ million)
        • Chart on Germany - Year-over-year growth 2024-2029 (%)
        • Data Table on Germany - Year-over-year growth 2024-2029 (%)
      • 12.14 UK - Market size and forecast 2024-2029
        • Chart on UK - Market size and forecast 2024-2029 ($ million)
        • Data Table on UK - Market size and forecast 2024-2029 ($ million)
        • Chart on UK - Year-over-year growth 2024-2029 (%)
        • Data Table on UK - Year-over-year growth 2024-2029 (%)
      • 12.15 Italy - Market size and forecast 2024-2029
        • Chart on Italy - Market size and forecast 2024-2029 ($ million)
        • Data Table on Italy - Market size and forecast 2024-2029 ($ million)
        • Chart on Italy - Year-over-year growth 2024-2029 (%)
        • Data Table on Italy - Year-over-year growth 2024-2029 (%)
      • 12.16 South Korea - Market size and forecast 2024-2029
        • Chart on South Korea - Market size and forecast 2024-2029 ($ million)
        • Data Table on South Korea - Market size and forecast 2024-2029 ($ million)
        • Chart on South Korea - Year-over-year growth 2024-2029 (%)
        • Data Table on South Korea - Year-over-year growth 2024-2029 (%)
      • 12.17 Vietnam - Market size and forecast 2024-2029
        • Chart on Vietnam - Market size and forecast 2024-2029 ($ million)
        • Data Table on Vietnam - Market size and forecast 2024-2029 ($ million)
        • Chart on Vietnam - Year-over-year growth 2024-2029 (%)
        • Data Table on Vietnam - Year-over-year growth 2024-2029 (%)
      • 12.18 Market opportunity by geography
        • Market opportunity by geography ($ million)
        • Data Tables on Market opportunity by geography ($ million)
      • 12.19 Brazil - Market size and forecast (2024-2029)
        • Chart on Brazil - Market size and forecast (2024-2029) ($ million)
        • Data Table on Brazil - Market size and forecast (2024-2029) ($ million)
        • Chart on Brazil - Year-over-year growth (2024-2029) (%)
        • Data Table on Brazil - Year-over-year growth (2024-2029) (%)
      • 12.20 Egypt - Market size and forecast (2024-2029)
        • Chart on Egypt - Market size and forecast (2024-2029) ($ million)
        • Data Table on Egypt - Market size and forecast (2024-2029) ($ million)
        • Chart on Egypt - Year-over-year growth (2024-2029) (%)
        • Data Table on Egypt - Year-over-year growth (2024-2029) (%)
      • 12.21 UAE - Market size and forecast (2024-2029)
        • Chart on UAE - Market size and forecast (2024-2029) ($ million)
        • Data Table on UAE - Market size and forecast (2024-2029) ($ million)
        • Chart on UAE - Year-over-year growth (2024-2029) (%)
        • Data Table on UAE - Year-over-year growth (2024-2029) (%)
      • 12.22 Oman - Market size and forecast (2024-2029)
        • Chart on Oman - Market size and forecast (2024-2029) ($ million)
        • Data Table on Oman - Market size and forecast (2024-2029) ($ million)
        • Chart on Oman - Year-over-year growth (2024-2029) (%)
        • Data Table on Oman - Year-over-year growth (2024-2029) (%)
      • 12.23 Argentina - Market size and forecast (2024-2029)
        • Chart on Argentina - Market size and forecast (2024-2029) ($ million)
        • Data Table on Argentina - Market size and forecast (2024-2029) ($ million)
        • Chart on Argentina - Year-over-year growth (2024-2029) (%)
        • Data Table on Argentina - Year-over-year growth (2024-2029) (%)
      • 12.24 KSA - Market size and forecast (2024-2029)
        • Chart on KSA - Market size and forecast (2024-2029) ($ million)
        • Data Table on KSA - Market size and forecast (2024-2029) ($ million)
        • Chart on KSA - Year-over-year growth (2024-2029) (%)
        • Data Table on KSA - Year-over-year growth (2024-2029) (%)
      • 12.25 Rest of World (ROW) - Market size and forecast (2024-2029)
        • Chart on Rest of World (ROW) - Market size and forecast (2024-2029) ($ million)
        • Data Table on Rest of World (ROW) - Market size and forecast (2024-2029) ($ million)
        • Chart on Rest of World (ROW) - Year-over-year growth (2024-2029) (%)
        • Data Table on Rest of World (ROW) - Year-over-year growth (2024-2029) (%)

      13 Drivers, Challenges, and Opportunity/Restraints

      • 13.1 Market drivers
        • 13.2 Market challenges
          • 13.3 Impact of drivers and challenges
            • Impact of drivers and challenges in 2024 and 2029
          • 13.4 Market opportunities/restraints

            14 Competitive Landscape

            • 14.1 Overview
              • 14.2 Competitive Landscape
                • Overview on criticality of inputs and factors of differentiation
              • 14.3 Landscape disruption
                • Overview on factors of disruption
              • 14.4 Industry risks
                • Impact of key risks on business

              15 Competitive Analysis

              • 15.1 Companies profiled
                • Companies covered
              • 15.2 Company ranking index
                • Company ranking index
              • 15.3 Market positioning of companies
                • Matrix on companies position and classification
              • 15.4 BOLUDA CORPORACION MARITIMA S.L.
                • BOLUDA CORPORACION MARITIMA S.L. - Overview
                • BOLUDA CORPORACION MARITIMA S.L. - Product / Service
                • BOLUDA CORPORACION MARITIMA S.L. - Key offerings
                • SWOT
              • 15.5 Crowley Maritime Corp.
                • Crowley Maritime Corp. - Overview
                • Crowley Maritime Corp. - Product / Service
                • Crowley Maritime Corp. - Key offerings
                • SWOT
              • 15.6 Damen Shipyards Group
                • Damen Shipyards Group - Overview
                • Damen Shipyards Group - Product / Service
                • Damen Shipyards Group - Key offerings
                • SWOT
              • 15.7 FM GROUP
                • FM GROUP - Overview
                • FM GROUP - Product / Service
                • FM GROUP - Key offerings
                • SWOT
              • 15.8 Fremont Tugboat Co. Inc.
                • Fremont Tugboat Co. Inc. - Overview
                • Fremont Tugboat Co. Inc. - Product / Service
                • Fremont Tugboat Co. Inc. - Key offerings
                • SWOT
              • 15.9 Haven Shipping FZE
                • Haven Shipping FZE - Overview
                • Haven Shipping FZE - Product / Service
                • Haven Shipping FZE - Key offerings
                • SWOT
              • 15.10 KOTUG
                • KOTUG - Overview
                • KOTUG - Product / Service
                • KOTUG - Key offerings
                • SWOT
              • 15.11 Moran Towing Corp.
                • Moran Towing Corp. - Overview
                • Moran Towing Corp. - Product / Service
                • Moran Towing Corp. - Key offerings
                • SWOT
              • 15.12 NAIKAI TUG BOAT SERVICE Co. Ltd.
                • NAIKAI TUG BOAT SERVICE Co. Ltd. - Overview
                • NAIKAI TUG BOAT SERVICE Co. Ltd. - Product / Service
                • NAIKAI TUG BOAT SERVICE Co. Ltd. - Key offerings
                • SWOT
              • 15.13 Norfolk Tug Co.
                • Norfolk Tug Co. - Overview
                • Norfolk Tug Co. - Product / Service
                • Norfolk Tug Co. - Key offerings
                • SWOT
              • 15.14 P and O Maritime Logistics
                • P and O Maritime Logistics - Overview
                • P and O Maritime Logistics - Product / Service
                • P and O Maritime Logistics - Key offerings
                • SWOT
              • 15.15 Pacific Maritime Group Inc.
                • Pacific Maritime Group Inc. - Overview
                • Pacific Maritime Group Inc. - Product / Service
                • Pacific Maritime Group Inc. - Key offerings
                • SWOT
              • 15.16 Qatar Navigation QPSC
                • Qatar Navigation QPSC - Overview
                • Qatar Navigation QPSC - Product / Service
                • Qatar Navigation QPSC - Key offerings
                • SWOT
              • 15.17 Sanmar Denizcilik AS
                • Sanmar Denizcilik AS - Overview
                • Sanmar Denizcilik AS - Product / Service
                • Sanmar Denizcilik AS - Key offerings
                • SWOT
              • 15.18 SEACOR Marine Holdings Inc.
                • SEACOR Marine Holdings Inc. - Overview
                • SEACOR Marine Holdings Inc. - Business segments
                • SEACOR Marine Holdings Inc. - Key offerings
                • SEACOR Marine Holdings Inc. - Segment focus
                • SWOT

              16 Appendix

              • 16.1 Scope of the report
                • 16.2 Inclusions and exclusions checklist
                  • Inclusions checklist
                  • Exclusions checklist
                • 16.3 Currency conversion rates for US$
                  • Currency conversion rates for US$
                • 16.4 Research methodology
                  • Research methodology
                • 16.5 Data procurement
                  • Information sources
                • 16.6 Data validation
                  • Data validation
                • 16.7 Validation techniques employed for market sizing
                  • Validation techniques employed for market sizing
                • 16.8 Data synthesis
                  • Data synthesis
                • 16.9 360 degree market analysis
                  • 360 degree market analysis
                • 16.10 List of abbreviations
                  • List of abbreviations

                Research Methodology

                Technavio presents a detailed picture of the market by way of study, synthesis, and summation of data from multiple sources. The analysts have presented the various facets of the market with a particular focus on identifying the key industry influencers. The data thus presented is comprehensive, reliable, and the result of extensive research, both primary and secondary.

                INFORMATION SOURCES

                Primary sources

                • Manufacturers and suppliers
                • Channel partners
                • Industry experts
                • Strategic decision makers

                Secondary sources

                • Industry journals and periodicals
                • Government data
                • Financial reports of key industry players
                • Historical data
                • Press releases

                DATA ANALYSIS

                Data Synthesis

                • Collation of data
                • Estimation of key figures
                • Analysis of derived insights

                Data Validation

                • Triangulation with data models
                • Reference against proprietary databases
                • Corroboration with industry experts

                REPORT WRITING

                Qualitative

                • Market drivers
                • Market challenges
                • Market trends
                • Five forces analysis

                Quantitative

                • Market size and forecast
                • Market segmentation
                • Geographical insights
                • Competitive landscape

                Interested in this report?

                Get your sample now to see our research methodology and insights!

                Download Now

                Frequently Asked Questions

                Tugboats Services market growth will increase by $ 10301.6 mn during 2025-2029.

                The Tugboats Services market is expected to grow at a CAGR of 22.3% during 2025-2029.

                Tugboats Services market is segmented by Application( Commercial, Military) Power Rating( Less than 1000 HP, Between 1000 and 2000 HP, Between 2000 and 5000 HP, More than 5000 HP, Middle East and Africa) Service Type( Harbor tug services, Offshore tug services, Coastal tug services, Specialized tug services, Middle East and Africa)

                BOLUDA CORPORACION MARITIMA S.L., Crowley Maritime Corp., Damen Shipyards Group, FM GROUP, Fremont Tugboat Co. Inc., Gulf Agency Co. Ltd., Haven Shipping FZE, John Swire and Sons Ltd., KOTUG, Moran Towing Corp., NAIKAI TUG BOAT SERVICE Co. Ltd., Norfolk Tug Co., P and O Maritime Logistics, Pacific Maritime Group Inc., Qatar Navigation QPSC, Sanmar Denizcilik AS, SEACOR Marine Holdings Inc., Tidewater Inc., Whitesea Shipping and Supply LLC FZC, Yildirim Group are a few of the key vendors in the Tugboats Services market.

                APAC will register the highest growth rate of 32% among the other regions. Therefore, the Tugboats Services market in APAC is expected to garner significant business opportunities for the vendors during the forecast period.

                US, China, The Netherlands, Singapore, Germany, Japan, Italy, UK, South Korea, Vietnam, Brazil, Egypt, UAE, Oman, Argentina, KSA, UAE, Brazil, Rest of World (ROW)

                • Increase in maritime trade and fleet sizeInternational seaborne trade is witnessing growth on a year-over-year basis. In 2024 is the driving factor this market.
                • global maritime trade volumes reached approximately 12.3 billion tons is the driving factor this market.
                • marking a 2.4% increase from 2023. The growth was driven by increased demand for major bulk commodities such as bauxite is the driving factor this market.
                • coal is the driving factor this market.
                • containerized goods is the driving factor this market.
                • grain is the driving factor this market.
                • iron ore is the driving factor this market.
                • and oil1. The Asia Pacific (APAC) region continued to exhibit strong demand is the driving factor this market.
                • contributing around 41% of the overall cargo trading. The demand for goods and raw materials is rising from emerging economies such as India is the driving factor this market.
                • Brazil is the driving factor this market.
                • and Indonesia is the driving factor this market.
                • owing to the increasing population in these countries. This is increasing the demand to build cargo ships or containers or bulkers is the driving factor this market.
                • which are large in size. The larger size of the shipping vessels is critical in achieving better trade efficiency. The large size of vessels has a direct impact on the growth of the volume of goods that are ferried in one trip. A rise in the number of large vessels increases the need for tugboats to navigate and maneuver. This will drive growth of the global tugboats services market during the forecast period. is the driving factor this market.

                The Tugboats Services market vendors should focus on grabbing business opportunities from the Commercial segment as it accounted for the largest market share in the base year.