Trimethylamine Market Analysis, Size, and Forecast 2026-2030: APAC (China, India, and Japan), North America (US, Canada, and Mexico), Europe (Germany, France, and UK), Middle East and Africa (Saudi Arabia, South Africa, and UAE), South America (Brazil, Argentina, and Colombia), and Rest of World (ROW)

Trimethylamine Market Analysis, Size, and Forecast 2026-2030:
APAC (China, India, and Japan), North America (US, Canada, and Mexico), Europe (Germany, France, and UK), Middle East and Africa (Saudi Arabia, South Africa, and UAE), South America (Brazil, Argentina, and Colombia), and Rest of World (ROW)

Published: Jan 2026 294 Pages SKU: IRTNTR72601

Market Overview at a Glance

$64.4 Mn
Market Opportunity
3.4%
CAGR 2025 - 2030
48.9%
APAC Growth
$164.1 Mn
Choline chloride segment 2024

Trimethylamine Market Size 2026-2030

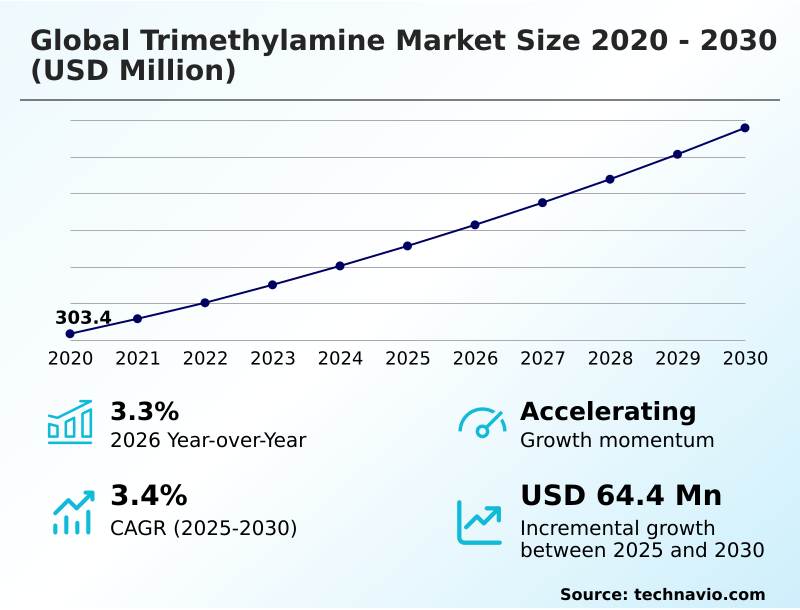
The trimethylamine market size is valued to increase by USD 64.4 million, at a CAGR of 3.4% from 2025 to 2030. Growth in application of trimethylamine in ion exchange resin will drive the trimethylamine market.

Major Market Trends & Insights

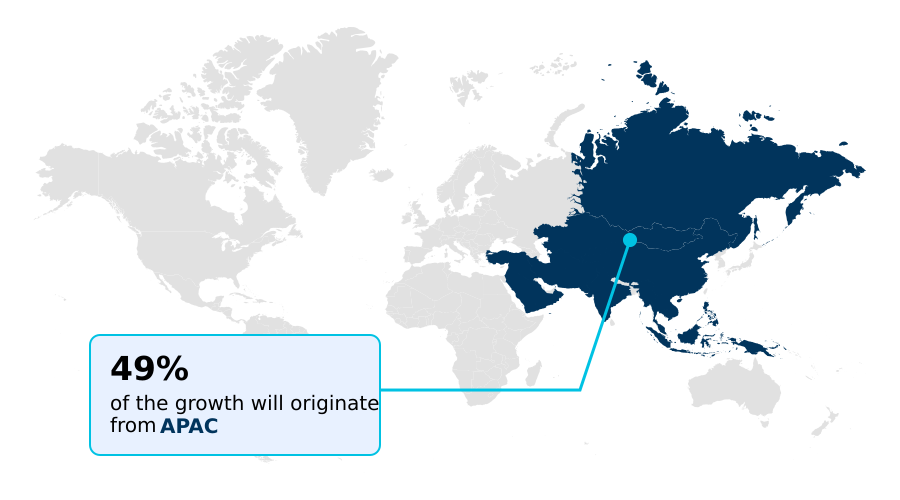
  • APAC dominated the market and accounted for a 48.9% growth during the forecast period.
  • By Application - Choline chloride segment was valued at USD 164.1 million in 2024
  • By Type - Aqueous solution segment accounted for the largest market revenue share in 2024

Market Size & Forecast

  • Market Opportunities: USD 112.3 million
  • Market Future Opportunities: USD 64.4 million
  • CAGR from 2025 to 2030 : 3.4%

Market Summary

  • The trimethylamine market operates as a pivotal segment within the broader specialty chemicals industry, primarily functioning as a key chemical intermediate. Its fundamental role is in the production of choline chloride, an indispensable nutrient in animal feed, which links the market's trajectory directly to global agricultural and food production demands.
  • Beyond this core application, trimethylamine is integral to manufacturing ion-exchange resins for water treatment and serves as a precursor in synthesizing various agrochemicals and pharmaceuticals. A significant market dynamic involves managing the volatile costs of essential raw materials like methanol and ammonia, prompting manufacturers to adopt advanced production technologies and integrated supply chain models.
  • For instance, a chemical producer might leverage predictive analytics to optimize feedstock procurement, aligning purchasing cycles with market price troughs to reduce input costs by over 12%. This strategic approach is crucial for maintaining competitive pricing and profitability in a market characterized by both commodity and specialty characteristics.
  • Furthermore, stringent environmental regulations governing emissions and waste disposal are driving innovation toward more sustainable manufacturing processes.

What will be the Size of the Trimethylamine Market during the forecast period?

Get Key Insights on Market Forecast (PDF) Request Free Sample

How is the Trimethylamine Market Segmented?

The trimethylamine industry research report provides comprehensive data (region-wise segment analysis), with forecasts and estimates in "USD million" for the period 2026-2030, as well as historical data from 2020-2024 for the following segments.
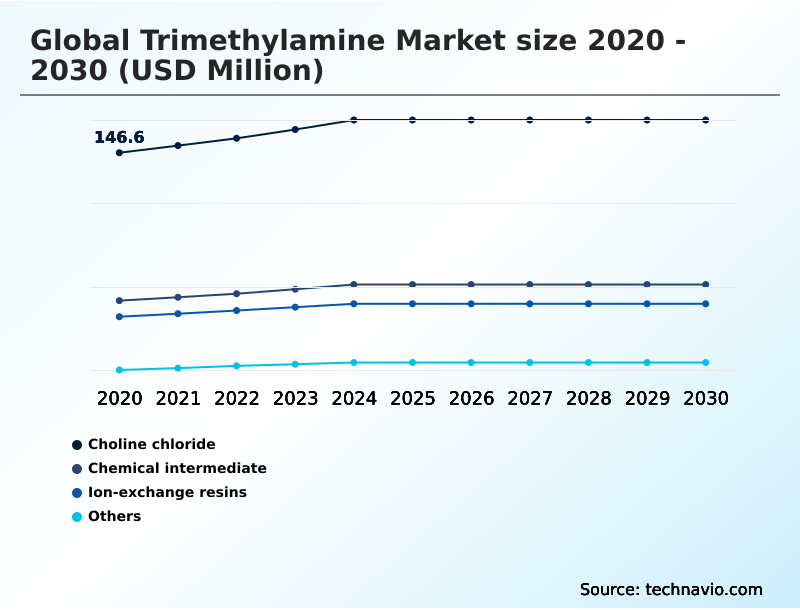
  • Application
    • Choline chloride
    • Chemical intermediate
    • Ion-exchange resins
    • Others
  • Type
    • Aqueous solution
    • Anhydrous liquefied gas
  • End-user
    • Animal feed
    • Agrochemicals
    • Oil and gas
    • Others
  • Geography
    • APAC
      • China
      • India
      • Japan
    • North America
      • US
      • Canada
      • Mexico
    • Europe
      • Germany
      • France
      • UK
    • Middle East and Africa
      • Saudi Arabia
      • South Africa
      • UAE
    • South America
      • Brazil
      • Argentina
      • Colombia
    • Rest of World (ROW)

By Application Insights

The choline chloride segment is estimated to witness significant growth during the forecast period.

The market is segmented by application, type, and geography. The choline chloride segment is driven by its essential role as an animal feed additive, particularly for poultry. This demand is sustained by the continuous need for protein-rich food sources globally.

Utilizing trimethylamine as a crucial chemical building block, choline chloride production benefits from established synthesis processes. However, a key consideration is maintaining aqueous solution concentration below toxicity thresholds, as levels exceeding 200ppm can cause malabsorption in animals.

Managing the supply of methanol and ammonia precursors is vital for operational stability. The use of salt-based water softener systems also indirectly supports the segment through its connection to ion-exchange resin formulation.

Request Free Sample

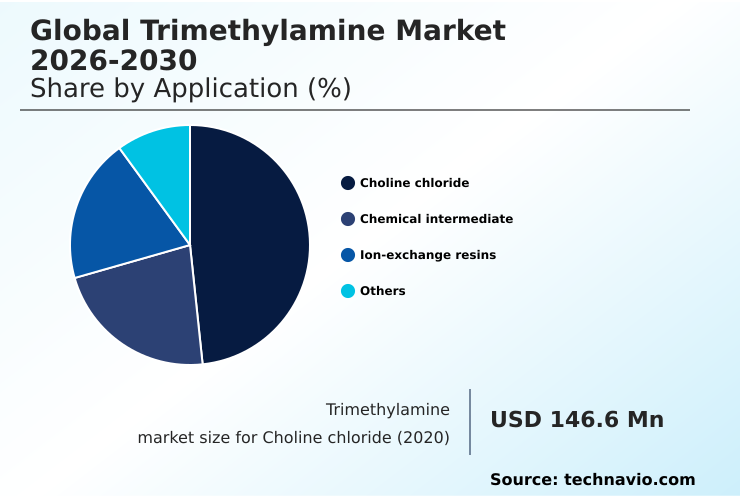
The Choline chloride segment was valued at USD 164.1 million in 2024 and showed a gradual increase during the forecast period.

Request Free Sample

Regional Analysis

APAC is estimated to contribute 48.9% to the growth of the global market during the forecast period.Technavio’s analysts have elaborately explained the regional trends and drivers that shape the market during the forecast period.

See How Trimethylamine Market Demand is Rising in APAC Request Free Sample

The geographic landscape of the market is heavily influenced by regional industrial strengths. APAC leads in consumption, driven by its large-scale chemical and animal feed production sectors.

The availability of cost-effective labor and raw materials in countries like China and India underpins the region's dominance in choline chloride production. This region accounts for nearly 49% of the market's incremental growth.

North America's market is characterized by a strong focus on specialty chemical manufacturing and advanced applications, including oil and gas. Europe's market is shaped by stringent environmental regulations, which drive innovation in sustainable chemical production and advanced wastewater management solutions.

Market Dynamics

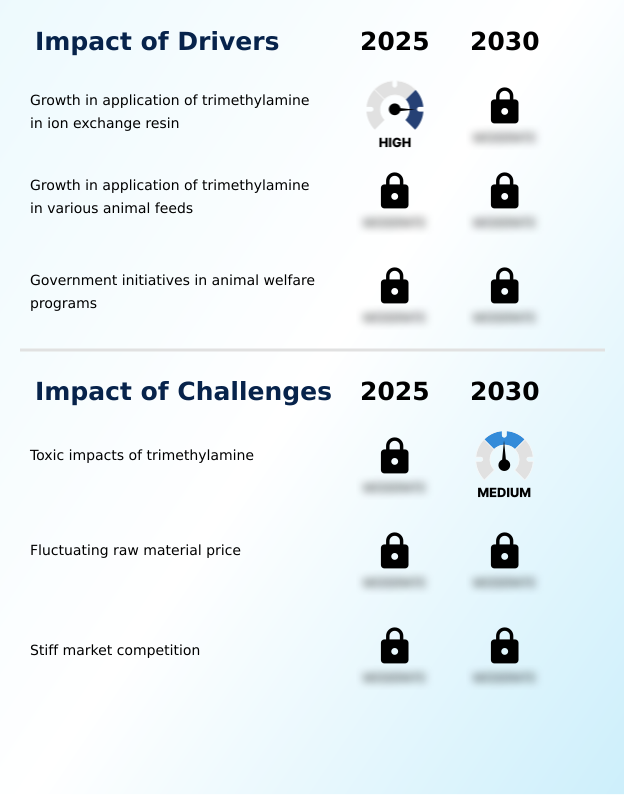
Our researchers analyzed the data with 2025 as the base year, along with the key drivers, trends, and challenges. A holistic analysis of drivers will help companies refine their marketing strategies to gain a competitive advantage.

  • The global trimethylamine market 2026-2030 is fundamentally shaped by its core applications and the technical specifications of its different forms. The role of trimethylamine in choline chloride synthesis remains the primary demand driver, underpinning its importance in the agricultural sector. The use of trimethylamine in ion exchange resins is a close second, critical for industrial and municipal water treatment processes.
  • As a versatile chemical intermediate, its applications are expanding. For instance, the applications of anhydrous liquefied gas trimethylamine are preferred in processes requiring high purity and no water content, such as in certain pharmaceutical syntheses. In contrast, the benefits of aqueous solution trimethylamine include safer handling and easier integration into water-based reactions, making it ideal for large-scale production.
  • The impact of trimethylamine on agrochemicals is seen in the development of more effective plant growth regulators. In parallel, trimethylamine in the oil and gas industry is used in formulating drilling fluids and other specialty chemicals. However, navigating the challenges of trimethylamine toxicity requires significant investment in safety and environmental compliance.
  • Companies are also exploring trimethylamine for water treatment processes beyond resins, such as in flocculants. The demand for high-purity trimethylamine for electronics is a high-growth niche, while trimethylamine derivatives in pharmaceuticals are expanding into new therapeutic areas. To stay competitive, firms must perform a rigorous cost-benefit of trimethylamine in production.
  • Key to this is managing feedstock price for trimethylamine and navigating the complex regulatory landscape for trimethylamine use. This has spurred a move toward sustainability in trimethylamine manufacturing, with some producers achieving a 5% reduction in energy consumption through process optimization. Success also hinges on optimizing trimethylamine in feed additives for maximum efficacy and understanding supply chain logistics for trimethylamine.
  • Emerging areas like trimethylamine's role in gas scrubbing and developing new trimethylamine applications represent future growth frontiers.

What are the key market drivers leading to the rise in the adoption of Trimethylamine Industry?

  • The expanding application of trimethylamine in the formulation of ion-exchange resins serves as a key market driver.

  • The market's primary driver remains the indispensable role of trimethylamine in choline chloride production for the animal feed industry. This is reinforced by the growing demand for poultry and swine feed nutrients to support global protein consumption.
  • The use of trimethylamine as a tertiary amine property makes it a highly effective chemical precursor. Additionally, the expansion of industrial water treatment chemicals, specifically ion-exchange resin formulation, drives demand, with systems demonstrating a 40% increase in mineral removal efficiency.
  • Demand from agrochemical formulation ingredients for new plant growth regulators and from fuel additive performance enhancers also contributes significantly to market momentum, showcasing the compound's versatility.

What are the market trends shaping the Trimethylamine Industry?

  • The emergence of new applications for trimethylamine represents a significant upcoming market trend.

  • Evolving applications are reshaping the trimethylamine market. Beyond traditional uses, trimethylamine synthesis processes are being adapted for innovative sectors. There is a notable rise in its use for manufacturing high-purity trimethylamine for advanced semiconductor cleaning, where precision is paramount.
  • Another key trend involves its role in formulating flocculants and corrosion inhibitors, which supports wastewater management solutions and aligns with stricter environmental standards, improving water clarification efficiency by 25%. Furthermore, its utility as a precursor for active pharmaceutical ingredients (apis) is expanding, particularly in the production of hygiene and disinfectant chemicals, where demand has remained elevated.
  • These new avenues are creating diversified revenue streams.

What challenges does the Trimethylamine Industry face during its growth?

  • The toxicological impacts associated with trimethylamine present a key challenge to the industry's growth trajectory.

  • Key challenges center on the compound's inherent toxicity and the stringent regulatory landscape. Environmental toxicity concerns related to trimethylamine's high solubility in water necessitate advanced byproduct treatment and disposal protocols, increasing operational costs by up to 15%. Strict worker safety protocols for trimethylamine handling safety are mandatory due to its hazardous nature, requiring investment in advanced containment technologies.
  • Furthermore, raw material price volatility, particularly for methanol and ammonia, creates significant financial risk. Navigating regulatory compliance for amines while managing production cost optimization presents a persistent challenge for manufacturers across the board.

Exclusive Technavio Analysis on Customer Landscape

The trimethylamine market forecasting report includes the adoption lifecycle of the market, covering from the innovator’s stage to the laggard’s stage. It focuses on adoption rates in different regions based on penetration. Furthermore, the trimethylamine market report also includes key purchase criteria and drivers of price sensitivity to help companies evaluate and develop their market growth analysis strategies.

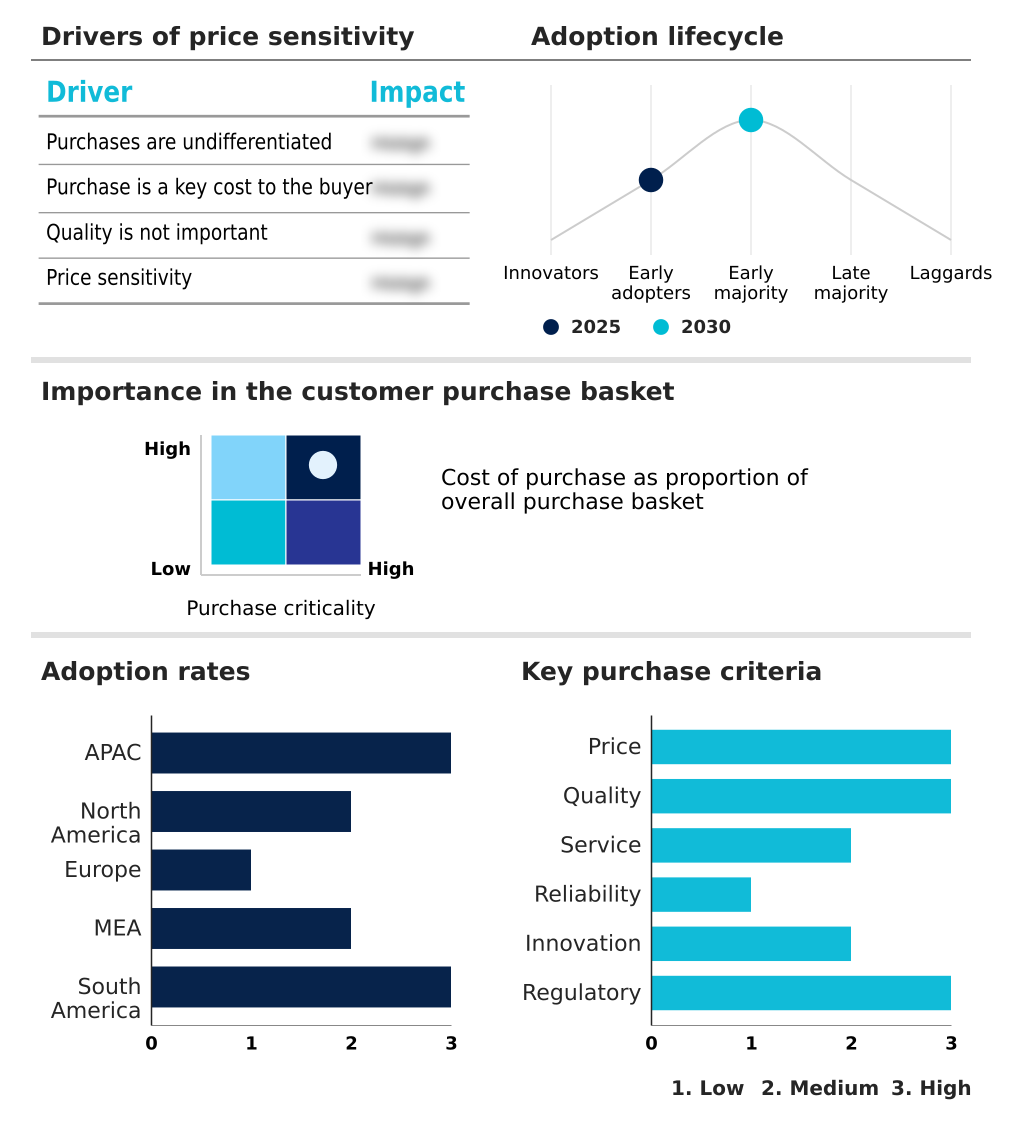
Customer Landscape of Trimethylamine Industry

Competitive Landscape

Companies are implementing various strategies, such as strategic alliances, trimethylamine market forecast, partnerships, mergers and acquisitions, geographical expansion, and product/service launches, to enhance their presence in the industry.

Alkyl Amines Chemicals Ltd. - Key offerings include trimethylamine as anhydrous liquefied gas and aqueous solutions, vital for producing choline chloride, ion-exchange resins, and various chemical intermediates.

The industry research and growth report includes detailed analyses of the competitive landscape of the market and information about key companies, including:

  • Alkyl Amines Chemicals Ltd.
  • Balaji Amines Ltd.
  • BASF SE
  • Belle Chemical
  • Celanese Corp.
  • Eastman Chemical Co.
  • Jaysons Chemical Industries.
  • Linde Plc
  • LOTTE Fine Chemical Co.
  • Luxi Chemical Group Co. Ltd.
  • Merck KGaA
  • Mitsubishi Gas Chemical Co. Inc.
  • SOCIETA ITALIANA ACETILENE Spa
  • Suqian Xinya Technology Co.
  • Thermo Fisher Scientific Inc.
  • Tokyo Chemical Co. Ltd.
  • Triveni Interchem Pvt. Ltd.

Qualitative and quantitative analysis of companies has been conducted to help clients understand the wider business environment as well as the strengths and weaknesses of key industry players. Data is qualitatively analyzed to categorize companies as pure play, category-focused, industry-focused, and diversified; it is quantitatively analyzed to categorize companies as dominant, leading, strong, tentative, and weak.

Recent Development and News in Trimethylamine market

  • In August, 2024, Chemanol announced the development of a new grade of trimethylamine optimized for fuel additive and water gel explosive applications, targeting a 15% improvement in stability.
  • In November, 2024, Balaji Amines Ltd. completed the expansion of its methylamine production facility, increasing its capacity for trimethylamine anhydrous liquefied gas to meet growing demand from the pharmaceutical sector.
  • In February, 2025, Eastman Chemical Co. entered a strategic partnership with a leading agricultural firm to co-develop next-generation plant growth regulators utilizing trimethylamine as a key precursor.
  • In May, 2025, BASF SE launched a sustainable trimethylamine product line produced using certified renewable methanol, reducing the carbon footprint by up to 50% compared to conventional methods.

Dive into Technavio’s robust research methodology, blending expert interviews, extensive data synthesis, and validated models for unparalleled Trimethylamine Market insights. See full methodology.

Market Scope
Page number 294
Base year 2025
Historic period 2020-2024
Forecast period 2026-2030
Growth momentum & CAGR Accelerate at a CAGR of 3.4%
Market growth 2026-2030 USD 64.4 million
Market structure Fragmented
YoY growth 2025-2026(%) 3.3%
Key countries China, India, Japan, South Korea, Thailand, Indonesia, US, Canada, Mexico, Germany, France, UK, Italy, The Netherlands, Spain, Saudi Arabia, South Africa, UAE, Egypt, Nigeria, Brazil, Argentina and Colombia
Competitive landscape Leading Companies, Market Positioning of Companies, Competitive Strategies, and Industry Risks

Request Free Sample

Research Analyst Overview

  • The trimethylamine market is defined by its critical function as a chemical building block across diverse industries. The core of its demand stems from choline chloride production, an essential animal feed additive. The market's structure is influenced by the technical requirements of producing both aqueous solution concentration and anhydrous liquefied gas forms, each serving distinct downstream applications.
  • A key dynamic is the management of feedstock supply chains, particularly methanol and ammonia precursors, where raw material price volatility poses a consistent risk. Boardroom decisions are increasingly focused on vertical integration and technology investments in areas like carbon capture technologies and gas treatment absorbents.
  • Strategic focus is also on expanding the use of methylamine derivatives in high-value areas such as active pharmaceutical ingredients (apis) and semiconductor cleaning agents. The use of trimethylamine in water gel explosive applications and as an antiknock compound for aviation is also gaining traction, diversifying revenue.
  • Firms that successfully navigate the complex supply chain and invest in high-purity trimethylamine production for specialty applications, such as cationic surfactants manufacturing, are best positioned for sustained performance.

What are the Key Data Covered in this Trimethylamine Market Research and Growth Report?

  • What is the expected growth of the Trimethylamine Market between 2026 and 2030?

    • USD 64.4 million, at a CAGR of 3.4%

  • What segmentation does the market report cover?

    • The report is segmented by Application (Choline chloride, Chemical intermediate, Ion-exchange resins, and Others), Type (Aqueous solution, and Anhydrous liquefied gas), End-user (Animal feed, Agrochemicals, Oil and gas, and Others) and Geography (APAC, North America, Europe, Middle East and Africa, South America)

  • Which regions are analyzed in the report?

    • APAC, North America, Europe, Middle East and Africa and South America

  • What are the key growth drivers and market challenges?

    • Growth in application of trimethylamine in ion exchange resin, Toxic impacts of trimethylamine

  • Who are the major players in the Trimethylamine Market?

    • Alkyl Amines Chemicals Ltd., Balaji Amines Ltd., BASF SE, Belle Chemical, Celanese Corp., Eastman Chemical Co., Jaysons Chemical Industries., Linde Plc, LOTTE Fine Chemical Co., Luxi Chemical Group Co. Ltd., Merck KGaA, Mitsubishi Gas Chemical Co. Inc., SOCIETA ITALIANA ACETILENE Spa, Suqian Xinya Technology Co., Thermo Fisher Scientific Inc., Tokyo Chemical Co. Ltd. and Triveni Interchem Pvt. Ltd.

Market Research Insights

  • The trimethylamine market is characterized by dynamic shifts influenced by both mature and emerging applications. As a foundational chemical intermediate, its demand is closely tied to the animal feed sector for choline chloride synthesis. However, diversification into high-value areas like pharmaceutical intermediates synthesis and electronic grade chemicals is accelerating.
  • Firms are implementing supply chain integration strategies to mitigate feedstock price fluctuations, with vertically integrated players reporting a 10% reduction in cost volatility. The adoption of advanced gas treatment absorbents using trimethylamine has demonstrated a 20% improvement in acidic gas capture efficiency, aligning with industrial sustainability goals. This strategic pivot highlights the market's adaptation to new economic and regulatory pressures.

We can help! Our analysts can customize this trimethylamine market research report to meet your requirements.

Get in touch

1. Executive Summary

1.1 Market overview

Executive Summary - Chart on Market Overview
Executive Summary - Data Table on Market Overview
Executive Summary - Chart on Global Market Characteristics
Executive Summary - Chart on Market by Geography
Executive Summary - Chart on Market Segmentation by Application
Executive Summary - Chart on Market Segmentation by Type
Executive Summary - Chart on Market Segmentation by End-user
Executive Summary - Chart on Incremental Growth
Executive Summary - Data Table on Incremental Growth
Executive Summary - Chart on Company Market Positioning

2. Technavio Analysis

2.1 Analysis of price sensitivity, lifecycle, customer purchase basket, adoption rates, and purchase criteria

2.2 Criticality of inputs and Factors of differentiation

Chart on Overview on criticality of inputs and factors of differentiation

2.3 Factors of disruption

Chart on Overview on factors of disruption

2.4 Impact of drivers and challenges

Chart on Impact of drivers and challenges in 2025 and 2030

3. Market Landscape

3.1 Market ecosystem

Chart on Parent Market
Data Table on - Parent Market

3.2 Market characteristics

Chart on Market characteristics analysis

3.3 Value chain analysis

Chart on Value chain analysis

4. Market Sizing

4.1 Market definition

Data Table on Offerings of companies included in the market definition

4.2 Market segment analysis

Market segments

4.3 Market size 2025

4.4 Market outlook: Forecast for 2025-2030

Chart on Global - Market size and forecast 2025-2030 ($ million)
Data Table on Global - Market size and forecast 2025-2030 ($ million)
Chart on Global Market: Year-over-year growth 2025-2030 (%)
Data Table on Global Market: Year-over-year growth 2025-2030 (%)

5. Historic Market Size

5.1 Global Trimethylamine Market 2020 - 2024

Historic Market Size - Data Table on Global Trimethylamine Market 2020 - 2024 ($ million)

5.2 Application segment analysis 2020 - 2024

Historic Market Size - Application Segment 2020 - 2024 ($ million)

5.3 Type segment analysis 2020 - 2024

Historic Market Size - Type Segment 2020 - 2024 ($ million)

5.4 End-user segment analysis 2020 - 2024

Historic Market Size - End-user Segment 2020 - 2024 ($ million)

5.5 Geography segment analysis 2020 - 2024

Historic Market Size - Geography Segment 2020 - 2024 ($ million)

5.6 Country segment analysis 2020 - 2024

Historic Market Size - Country Segment 2020 - 2024 ($ million)

6. Qualitative Analysis

6.1 The AI impact on Global Trimethylamine Market

7. Five Forces Analysis

7.1 Five forces summary

Five forces analysis - Comparison between 2025 and 2030

7.2 Bargaining power of buyers

Bargaining power of buyers - Impact of key factors 2025 and 2030

7.3 Bargaining power of suppliers

Bargaining power of suppliers - Impact of key factors in 2025 and 2030

7.4 Threat of new entrants

Threat of new entrants - Impact of key factors in 2025 and 2030

7.5 Threat of substitutes

Threat of substitutes - Impact of key factors in 2025 and 2030

7.6 Threat of rivalry

Threat of rivalry - Impact of key factors in 2025 and 2030

7.7 Market condition

Chart on Market condition - Five forces 2025 and 2030

8. Market Segmentation by Application

8.1 Market segments

Chart on Application - Market share 2025-2030 (%)
Data Table on Application - Market share 2025-2030 (%)

8.2 Comparison by Application

Chart on Comparison by Application
Data Table on Comparison by Application

8.3 Choline chloride - Market size and forecast 2025-2030

Chart on Choline chloride - Market size and forecast 2025-2030 ($ million)
Data Table on Choline chloride - Market size and forecast 2025-2030 ($ million)
Chart on Choline chloride - Year-over-year growth 2025-2030 (%)
Data Table on Choline chloride - Year-over-year growth 2025-2030 (%)

8.4 Chemical intermediate - Market size and forecast 2025-2030

Chart on Chemical intermediate - Market size and forecast 2025-2030 ($ million)
Data Table on Chemical intermediate - Market size and forecast 2025-2030 ($ million)
Chart on Chemical intermediate - Year-over-year growth 2025-2030 (%)
Data Table on Chemical intermediate - Year-over-year growth 2025-2030 (%)

8.5 Ion-exchange resins - Market size and forecast 2025-2030

Chart on Ion-exchange resins - Market size and forecast 2025-2030 ($ million)
Data Table on Ion-exchange resins - Market size and forecast 2025-2030 ($ million)
Chart on Ion-exchange resins - Year-over-year growth 2025-2030 (%)
Data Table on Ion-exchange resins - Year-over-year growth 2025-2030 (%)

8.6 Others - Market size and forecast 2025-2030

Chart on Others - Market size and forecast 2025-2030 ($ million)
Data Table on Others - Market size and forecast 2025-2030 ($ million)
Chart on Others - Year-over-year growth 2025-2030 (%)
Data Table on Others - Year-over-year growth 2025-2030 (%)

8.7 Market opportunity by Application

Market opportunity by Application ($ million)
Data Table on Market opportunity by Application ($ million)

9. Market Segmentation by Type

9.1 Market segments

Chart on Type - Market share 2025-2030 (%)
Data Table on Type - Market share 2025-2030 (%)

9.2 Comparison by Type

Chart on Comparison by Type
Data Table on Comparison by Type

9.3 Aqueous solution - Market size and forecast 2025-2030

Chart on Aqueous solution - Market size and forecast 2025-2030 ($ million)
Data Table on Aqueous solution - Market size and forecast 2025-2030 ($ million)
Chart on Aqueous solution - Year-over-year growth 2025-2030 (%)
Data Table on Aqueous solution - Year-over-year growth 2025-2030 (%)

9.4 Anhydrous liquefied gas - Market size and forecast 2025-2030

Chart on Anhydrous liquefied gas - Market size and forecast 2025-2030 ($ million)
Data Table on Anhydrous liquefied gas - Market size and forecast 2025-2030 ($ million)
Chart on Anhydrous liquefied gas - Year-over-year growth 2025-2030 (%)
Data Table on Anhydrous liquefied gas - Year-over-year growth 2025-2030 (%)

9.5 Market opportunity by Type

Market opportunity by Type ($ million)
Data Table on Market opportunity by Type ($ million)

10. Market Segmentation by End-user

10.1 Market segments

Chart on End-user - Market share 2025-2030 (%)
Data Table on End-user - Market share 2025-2030 (%)

10.2 Comparison by End-user

Chart on Comparison by End-user
Data Table on Comparison by End-user

10.3 Animal feed - Market size and forecast 2025-2030

Chart on Animal feed - Market size and forecast 2025-2030 ($ million)
Data Table on Animal feed - Market size and forecast 2025-2030 ($ million)
Chart on Animal feed - Year-over-year growth 2025-2030 (%)
Data Table on Animal feed - Year-over-year growth 2025-2030 (%)

10.4 Agrochemicals - Market size and forecast 2025-2030

Chart on Agrochemicals - Market size and forecast 2025-2030 ($ million)
Data Table on Agrochemicals - Market size and forecast 2025-2030 ($ million)
Chart on Agrochemicals - Year-over-year growth 2025-2030 (%)
Data Table on Agrochemicals - Year-over-year growth 2025-2030 (%)

10.5 Oil and gas - Market size and forecast 2025-2030

Chart on Oil and gas - Market size and forecast 2025-2030 ($ million)
Data Table on Oil and gas - Market size and forecast 2025-2030 ($ million)
Chart on Oil and gas - Year-over-year growth 2025-2030 (%)
Data Table on Oil and gas - Year-over-year growth 2025-2030 (%)

10.6 Others - Market size and forecast 2025-2030

Chart on Others - Market size and forecast 2025-2030 ($ million)
Data Table on Others - Market size and forecast 2025-2030 ($ million)
Chart on Others - Year-over-year growth 2025-2030 (%)
Data Table on Others - Year-over-year growth 2025-2030 (%)

10.7 Market opportunity by End-user

Market opportunity by End-user ($ million)
Data Table on Market opportunity by End-user ($ million)

11. Customer Landscape

11.1 Customer landscape overview

Analysis of price sensitivity, lifecycle, customer purchase basket, adoption rates, and purchase criteria

12. Geographic Landscape

12.1 Geographic segmentation

Chart on Market share by geography 2025-2030 (%)
Data Table on Market share by geography 2025-2030 (%)

12.2 Geographic comparison

Chart on Geographic comparison
Data Table on Geographic comparison

12.3 APAC - Market size and forecast 2025-2030

Chart on APAC - Market size and forecast 2025-2030 ($ million)
Data Table on APAC - Market size and forecast 2025-2030 ($ million)
Chart on APAC - Year-over-year growth 2025-2030 (%)
Data Table on APAC - Year-over-year growth 2025-2030 (%)
Chart on Regional Comparison - APAC
Data Table on Regional Comparison - APAC

12.3.1 China - Market size and forecast 2025-2030

Chart on China - Market size and forecast 2025-2030 ($ million)
Data Table on China - Market size and forecast 2025-2030 ($ million)
Chart on China - Year-over-year growth 2025-2030 (%)
Data Table on China - Year-over-year growth 2025-2030 (%)

12.3.2 India - Market size and forecast 2025-2030

Chart on India - Market size and forecast 2025-2030 ($ million)
Data Table on India - Market size and forecast 2025-2030 ($ million)
Chart on India - Year-over-year growth 2025-2030 (%)
Data Table on India - Year-over-year growth 2025-2030 (%)

12.3.3 Japan - Market size and forecast 2025-2030

Chart on Japan - Market size and forecast 2025-2030 ($ million)
Data Table on Japan - Market size and forecast 2025-2030 ($ million)
Chart on Japan - Year-over-year growth 2025-2030 (%)
Data Table on Japan - Year-over-year growth 2025-2030 (%)

12.3.4 South Korea - Market size and forecast 2025-2030

Chart on South Korea - Market size and forecast 2025-2030 ($ million)
Data Table on South Korea - Market size and forecast 2025-2030 ($ million)
Chart on South Korea - Year-over-year growth 2025-2030 (%)
Data Table on South Korea - Year-over-year growth 2025-2030 (%)

12.3.5 Thailand - Market size and forecast 2025-2030

Chart on Thailand - Market size and forecast 2025-2030 ($ million)
Data Table on Thailand - Market size and forecast 2025-2030 ($ million)
Chart on Thailand - Year-over-year growth 2025-2030 (%)
Data Table on Thailand - Year-over-year growth 2025-2030 (%)

12.3.6 Indonesia - Market size and forecast 2025-2030

Chart on Indonesia - Market size and forecast 2025-2030 ($ million)
Data Table on Indonesia - Market size and forecast 2025-2030 ($ million)
Chart on Indonesia - Year-over-year growth 2025-2030 (%)
Data Table on Indonesia - Year-over-year growth 2025-2030 (%)

12.4 North America - Market size and forecast 2025-2030

Chart on North America - Market size and forecast 2025-2030 ($ million)
Data Table on North America - Market size and forecast 2025-2030 ($ million)
Chart on North America - Year-over-year growth 2025-2030 (%)
Data Table on North America - Year-over-year growth 2025-2030 (%)
Chart on Regional Comparison - North America
Data Table on Regional Comparison - North America

12.4.1 US - Market size and forecast 2025-2030

Chart on US - Market size and forecast 2025-2030 ($ million)
Data Table on US - Market size and forecast 2025-2030 ($ million)
Chart on US - Year-over-year growth 2025-2030 (%)
Data Table on US - Year-over-year growth 2025-2030 (%)

12.4.2 Canada - Market size and forecast 2025-2030

Chart on Canada - Market size and forecast 2025-2030 ($ million)
Data Table on Canada - Market size and forecast 2025-2030 ($ million)
Chart on Canada - Year-over-year growth 2025-2030 (%)
Data Table on Canada - Year-over-year growth 2025-2030 (%)

12.4.3 Mexico - Market size and forecast 2025-2030

Chart on Mexico - Market size and forecast 2025-2030 ($ million)
Data Table on Mexico - Market size and forecast 2025-2030 ($ million)
Chart on Mexico - Year-over-year growth 2025-2030 (%)
Data Table on Mexico - Year-over-year growth 2025-2030 (%)

12.5 Europe - Market size and forecast 2025-2030

Chart on Europe - Market size and forecast 2025-2030 ($ million)
Data Table on Europe - Market size and forecast 2025-2030 ($ million)
Chart on Europe - Year-over-year growth 2025-2030 (%)
Data Table on Europe - Year-over-year growth 2025-2030 (%)
Chart on Regional Comparison - Europe
Data Table on Regional Comparison - Europe

12.5.1 Germany - Market size and forecast 2025-2030

Chart on Germany - Market size and forecast 2025-2030 ($ million)
Data Table on Germany - Market size and forecast 2025-2030 ($ million)
Chart on Germany - Year-over-year growth 2025-2030 (%)
Data Table on Germany - Year-over-year growth 2025-2030 (%)

12.5.2 France - Market size and forecast 2025-2030

Chart on France - Market size and forecast 2025-2030 ($ million)
Data Table on France - Market size and forecast 2025-2030 ($ million)
Chart on France - Year-over-year growth 2025-2030 (%)
Data Table on France - Year-over-year growth 2025-2030 (%)

12.5.3 UK - Market size and forecast 2025-2030

Chart on UK - Market size and forecast 2025-2030 ($ million)
Data Table on UK - Market size and forecast 2025-2030 ($ million)
Chart on UK - Year-over-year growth 2025-2030 (%)
Data Table on UK - Year-over-year growth 2025-2030 (%)

12.5.4 Italy - Market size and forecast 2025-2030

Chart on Italy - Market size and forecast 2025-2030 ($ million)
Data Table on Italy - Market size and forecast 2025-2030 ($ million)
Chart on Italy - Year-over-year growth 2025-2030 (%)
Data Table on Italy - Year-over-year growth 2025-2030 (%)

12.5.5 The Netherlands - Market size and forecast 2025-2030

Chart on The Netherlands - Market size and forecast 2025-2030 ($ million)
Data Table on The Netherlands - Market size and forecast 2025-2030 ($ million)
Chart on The Netherlands - Year-over-year growth 2025-2030 (%)
Data Table on The Netherlands - Year-over-year growth 2025-2030 (%)

12.5.6 Spain - Market size and forecast 2025-2030

Chart on Spain - Market size and forecast 2025-2030 ($ million)
Data Table on Spain - Market size and forecast 2025-2030 ($ million)
Chart on Spain - Year-over-year growth 2025-2030 (%)
Data Table on Spain - Year-over-year growth 2025-2030 (%)

12.6 Middle East and Africa - Market size and forecast 2025-2030

Chart on Middle East and Africa - Market size and forecast 2025-2030 ($ million)
Data Table on Middle East and Africa - Market size and forecast 2025-2030 ($ million)
Chart on Middle East and Africa - Year-over-year growth 2025-2030 (%)
Data Table on Middle East and Africa - Year-over-year growth 2025-2030 (%)
Chart on Regional Comparison - Middle East and Africa
Data Table on Regional Comparison - Middle East and Africa

12.6.1 Saudi Arabia - Market size and forecast 2025-2030

Chart on Saudi Arabia - Market size and forecast 2025-2030 ($ million)
Data Table on Saudi Arabia - Market size and forecast 2025-2030 ($ million)
Chart on Saudi Arabia - Year-over-year growth 2025-2030 (%)
Data Table on Saudi Arabia - Year-over-year growth 2025-2030 (%)

12.6.2 South Africa - Market size and forecast 2025-2030

Chart on South Africa - Market size and forecast 2025-2030 ($ million)
Data Table on South Africa - Market size and forecast 2025-2030 ($ million)
Chart on South Africa - Year-over-year growth 2025-2030 (%)
Data Table on South Africa - Year-over-year growth 2025-2030 (%)

12.6.3 UAE - Market size and forecast 2025-2030

Chart on UAE - Market size and forecast 2025-2030 ($ million)
Data Table on UAE - Market size and forecast 2025-2030 ($ million)
Chart on UAE - Year-over-year growth 2025-2030 (%)
Data Table on UAE - Year-over-year growth 2025-2030 (%)

12.6.4 Egypt - Market size and forecast 2025-2030

Chart on Egypt - Market size and forecast 2025-2030 ($ million)
Data Table on Egypt - Market size and forecast 2025-2030 ($ million)
Chart on Egypt - Year-over-year growth 2025-2030 (%)
Data Table on Egypt - Year-over-year growth 2025-2030 (%)

12.6.5 Nigeria - Market size and forecast 2025-2030

Chart on Nigeria - Market size and forecast 2025-2030 ($ million)
Data Table on Nigeria - Market size and forecast 2025-2030 ($ million)
Chart on Nigeria - Year-over-year growth 2025-2030 (%)
Data Table on Nigeria - Year-over-year growth 2025-2030 (%)

12.7 South America - Market size and forecast 2025-2030

Chart on South America - Market size and forecast 2025-2030 ($ million)
Data Table on South America - Market size and forecast 2025-2030 ($ million)
Chart on South America - Year-over-year growth 2025-2030 (%)
Data Table on South America - Year-over-year growth 2025-2030 (%)
Chart on Regional Comparison - South America
Data Table on Regional Comparison - South America

12.7.1 Brazil - Market size and forecast 2025-2030

Chart on Brazil - Market size and forecast 2025-2030 ($ million)
Data Table on Brazil - Market size and forecast 2025-2030 ($ million)
Chart on Brazil - Year-over-year growth 2025-2030 (%)
Data Table on Brazil - Year-over-year growth 2025-2030 (%)

12.7.2 Argentina - Market size and forecast 2025-2030

Chart on Argentina - Market size and forecast 2025-2030 ($ million)
Data Table on Argentina - Market size and forecast 2025-2030 ($ million)
Chart on Argentina - Year-over-year growth 2025-2030 (%)
Data Table on Argentina - Year-over-year growth 2025-2030 (%)

12.7.3 Colombia - Market size and forecast 2025-2030

Chart on Colombia - Market size and forecast 2025-2030 ($ million)
Data Table on Colombia - Market size and forecast 2025-2030 ($ million)
Chart on Colombia - Year-over-year growth 2025-2030 (%)
Data Table on Colombia - Year-over-year growth 2025-2030 (%)

12.8 Market opportunity by geography

Market opportunity by geography ($ million)
Data Tables on Market opportunity by geography ($ million)

13. Drivers, Challenges, and Opportunity

13.1 Market drivers

Growth in application of trimethylamine in ion exchange resin
Growth in application of trimethylamine in various animal feeds
Government initiatives in animal welfare programs

13.2 Market challenges

Toxic impacts of trimethylamine
Fluctuating raw material price
Stiff market competition

13.3 Impact of drivers and challenges

Impact of drivers and challenges in 2025 and 2030

13.4 Market opportunities

New applications of trimethylamine
Rise in demand for triethylamine-based catalysts
Growing number of new companies in global trimethylamine market

14. Competitive Landscape

14.1 Overview

14.2

Overview on criticality of inputs and factors of differentiation

14.3 Landscape disruption

Overview on factors of disruption

14.4 Industry risks

Impact of key risks on business

15. Competitive Analysis

15.1 Companies profiled

Companies covered

15.2 Company ranking index

15.3 Market positioning of companies

Matrix on companies position and classification

15.4 Alkyl Amines Chemicals Ltd.

Alkyl Amines Chemicals Ltd. - Overview
Alkyl Amines Chemicals Ltd. - Product / Service
Alkyl Amines Chemicals Ltd. - Key offerings
SWOT

15.5 Balaji Amines Ltd.

Balaji Amines Ltd. - Overview
Balaji Amines Ltd. - Product / Service
Balaji Amines Ltd. - Key offerings
SWOT

15.6 BASF SE

BASF SE - Overview
BASF SE - Business segments
BASF SE - Key news
BASF SE - Key offerings
BASF SE - Segment focus
SWOT

15.7 Belle Chemical

Belle Chemical - Overview
Belle Chemical - Product / Service
Belle Chemical - Key offerings
SWOT

15.8 Celanese Corp.

Celanese Corp. - Overview
Celanese Corp. - Business segments
Celanese Corp. - Key news
Celanese Corp. - Key offerings
Celanese Corp. - Segment focus
SWOT

15.9 Eastman Chemical Co.

Eastman Chemical Co. - Overview
Eastman Chemical Co. - Business segments
Eastman Chemical Co. - Key news
Eastman Chemical Co. - Key offerings
Eastman Chemical Co. - Segment focus
SWOT

15.10 Jaysons Chemical Industries.

Jaysons Chemical Industries. - Overview
Jaysons Chemical Industries. - Product / Service
Jaysons Chemical Industries. - Key offerings
SWOT

15.11 Linde Plc

Linde Plc - Overview
Linde Plc - Business segments
Linde Plc - Key news
Linde Plc - Key offerings
Linde Plc - Segment focus
SWOT

15.12 Luxi Chemical Group Co. Ltd.

Luxi Chemical Group Co. Ltd. - Overview
Luxi Chemical Group Co. Ltd. - Product / Service
Luxi Chemical Group Co. Ltd. - Key offerings
SWOT

15.13 Merck KGaA

Merck KGaA - Overview
Merck KGaA - Business segments
Merck KGaA - Key news
Merck KGaA - Key offerings
Merck KGaA - Segment focus
SWOT

15.14 Mitsubishi Gas Chemical Co. Inc.

Mitsubishi Gas Chemical Co. Inc. - Overview
Mitsubishi Gas Chemical Co. Inc. - Business segments
Mitsubishi Gas Chemical Co. Inc. - Key news
Mitsubishi Gas Chemical Co. Inc. - Key offerings
Mitsubishi Gas Chemical Co. Inc. - Segment focus
SWOT

15.15 Suqian Xinya Technology Co.

Suqian Xinya Technology Co. - Overview
Suqian Xinya Technology Co. - Product / Service
Suqian Xinya Technology Co. - Key offerings
SWOT

15.16 Thermo Fisher Scientific Inc.

Thermo Fisher Scientific Inc. - Overview
Thermo Fisher Scientific Inc. - Business segments
Thermo Fisher Scientific Inc. - Key news
Thermo Fisher Scientific Inc. - Key offerings
Thermo Fisher Scientific Inc. - Segment focus
SWOT

15.17 Tokyo Chemical Co. Ltd.

Tokyo Chemical Co. Ltd. - Overview
Tokyo Chemical Co. Ltd. - Product / Service
Tokyo Chemical Co. Ltd. - Key offerings
SWOT

15.18 Triveni Interchem Pvt. Ltd.

Triveni Interchem Pvt. Ltd. - Overview
Triveni Interchem Pvt. Ltd. - Product / Service
Triveni Interchem Pvt. Ltd. - Key offerings
SWOT

16. Appendix

16.1 Scope of the report

Market definition
Objectives
Notes and caveats

16.2 Inclusions and exclusions checklist

Inclusions checklist
Exclusions checklist

16.3 Currency conversion rates for US$

16.4 Research methodology

16.5 Data procurement

Information sources

16.6 Data validation

16.7 Validation techniques employed for market sizing

16.8 Data synthesis

16.9 360 degree market analysis

16.10 List of abbreviations

Research Methodology

Technavio presents a detailed picture of the market by way of study, synthesis, and summation of data from multiple sources. The analysts have presented the various facets of the market with a particular focus on identifying the key industry influencers. The data thus presented is comprehensive, reliable, and the result of extensive research, both primary and secondary.

INFORMATION SOURCES

Primary sources

  • Manufacturers and suppliers
  • Channel partners
  • Industry experts
  • Strategic decision makers

Secondary sources

  • Industry journals and periodicals
  • Government data
  • Financial reports of key industry players
  • Historical data
  • Press releases

DATA ANALYSIS

Data Synthesis

  • Collation of data
  • Estimation of key figures
  • Analysis of derived insights

Data Validation

  • Triangulation with data models
  • Reference against proprietary databases
  • Corroboration with industry experts

REPORT WRITING

Qualitative

  • Market drivers
  • Market challenges
  • Market trends
  • Five forces analysis

Quantitative

  • Market size and forecast
  • Market segmentation
  • Geographical insights
  • Competitive landscape

Interested in this report?

Get your sample now to see our research methodology and insights!

Download Now

Frequently Asked Questions

Trimethylamine market growth will increase by USD 64.4 million during 2026-2030.

The Trimethylamine market is expected to grow at a CAGR of 3.4% during 2026-2030.

Trimethylamine market is segmented by Application (Choline chloride, Chemical intermediate, Ion-exchange resins, Others) Type (Aqueous solution, Anhydrous liquefied gas) End-user (Animal feed, Agrochemicals, Oil and gas, Others)

Alkyl Amines Chemicals Ltd., Balaji Amines Ltd., BASF SE, Belle Chemical, Celanese Corp., Eastman Chemical Co., Jaysons Chemical Industries., Linde Plc, LOTTE Fine Chemical Co., Luxi Chemical Group Co. Ltd., Merck KGaA, Mitsubishi Gas Chemical Co. Inc., SOCIETA ITALIANA ACETILENE Spa, Suqian Xinya Technology Co., Thermo Fisher Scientific Inc., Tokyo Chemical Co. Ltd., Triveni Interchem Pvt. Ltd. are a few of the key vendors in the Trimethylamine market.

APAC will register the highest growth rate of 48.9% among the other regions. Therefore, the Trimethylamine market in APAC is expected to garner significant business opportunities for the vendors during the forecast period.

China, India, Japan, South Korea, Thailand, Indonesia, US, Canada, Mexico, Germany, France, UK, Italy, The Netherlands, Spain, Saudi Arabia, South Africa, UAE, Egypt, Nigeria, Brazil, Argentina, Colombia

  • Growth in application of trimethylamine in ion exchange resin is the driving factor this market.

The Trimethylamine market vendors should focus on grabbing business opportunities from the Application segment as it accounted for the largest market share in the base year.