Third-Party Logistics (3PL) Market Analysis, Size, and Forecast 2025-2029: North America (US and Canada), Europe (France, Germany, and UK), APAC (China, India, Japan, and South Korea), South America (Brazil), and Rest of World (ROW)

Third-Party Logistics (3PL) Market Analysis, Size, and Forecast 2025-2029:
North America (US and Canada), Europe (France, Germany, and UK), APAC (China, India, Japan, and South Korea), South America (Brazil), and Rest of World (ROW)

Published: May 2025 236 Pages SKU: IRTNTR45655

Market Overview at a Glance

$662.8 B
Market Opportunity
8.4%
CAGR
7.6
YoY growth 2024-2025(%)

Third-Party Logistics (3PL) Market Size 2025-2029

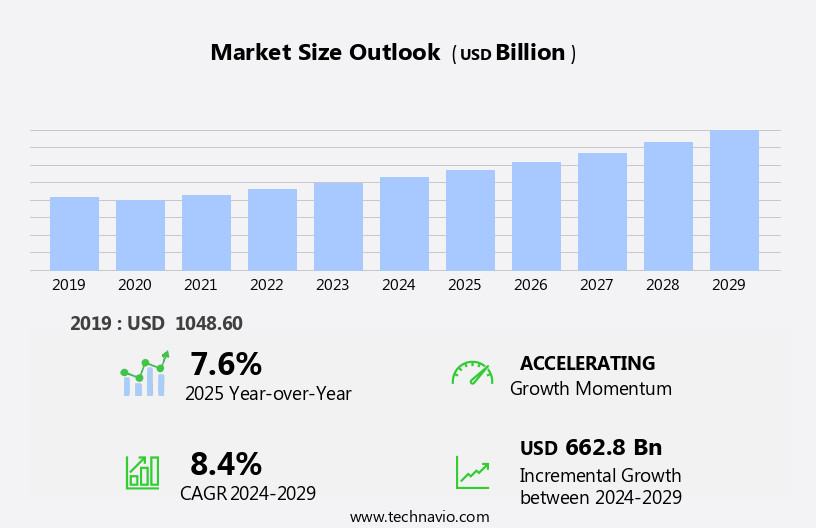
The third-party logistics (3pl) market size is forecast to increase by USD 662.8 billion, at a CAGR of 8.4% between 2024 and 2029.

  • The market is experiencing significant growth due to the surge in e-commerce and the increasing demand for integrated shipping services. As consumers continue to prefer online shopping, businesses are turning to 3PL providers to manage their supply chain and fulfill orders efficiently. This trend is expected to continue, presenting a lucrative opportunity for 3PL providers. Another key driver in the market is the emergence of big data analytics. The use of advanced analytics tools is enabling 3PLs to optimize their operations, improve customer service, and gain a competitive edge. However, the market also faces challenges, with high operational costs and competitive pricing being major obstacles.
  • To remain competitive, 3PLs must find ways to reduce costs while maintaining quality and service levels. This may involve implementing automation, leveraging technology, and optimizing their networks. Companies seeking to capitalize on market opportunities and navigate challenges effectively should focus on innovation, operational efficiency, and customer service.

What will be the Size of the Third-Party Logistics (3PL) Market during the forecast period?

Third-Party Logistics (3PL) Market Size

Explore in-depth regional segment analysis with market size data - historical 2019-2023 and forecasts 2025-2029 - in the full report.  
Request Free Sample

The market continues to evolve, with dynamic market activities shaping its landscape. Seamless integration of network design, API integrations, customs brokerage, labor management, returns processing, load planning, dock scheduling, freight forwarding, dedicated contract carriage, and supply chain optimization are essential elements of this complex system. Real-time visibility and order accuracy are critical components of modern logistics, enabling businesses to effectively manage inventory and optimize costs. Capacity planning and freight consolidation are ongoing processes, ensuring efficient use of resources and reducing unnecessary transportation costs. Route optimization and yard management are essential for streamlining operations and minimizing transportation time. Data analytics and business intelligence provide valuable insights, enabling predictive analytics and demand forecasting to optimize supply chain performance.

Technology integration, including warehouse automation and AI-powered logistics, plays a pivotal role in enhancing efficiency metrics and reducing risk. Carbon footprint and fleet management are increasingly important considerations, with sustainability becoming a key focus for many organizations. E-commerce logistics, reverse logistics, and last-mile delivery are growing sectors, requiring specialized solutions for pick and pack, order fulfillment, and on-time delivery. Contract logistics and distribution centers are integral to the supply chain, providing essential services such as sorting systems and risk management. The 3PL market is characterized by continuous change and innovation, with ongoing developments in technology, regulations, and customer expectations driving the need for adaptability and flexibility.

How is this Third-Party Logistics (3PL) Industry segmented?

The third-party logistics (3pl) industry research report provides comprehensive data (region-wise segment analysis), with forecasts and estimates in "USD billion" for the period 2025-2029, as well as historical data from 2019-2023 for the following segments.

  • Application
    • Transportation services
    • Warehousing and distribution services
    • Others
  • End-user
    • Manufacturing
    • Retail
    • Consumer goods
    • Healthcare
    • Others
  • Mode Of Transportation
    • Roadways
    • Seaways
    • Railways
    • Airways
    • Multimodal transport
  • Geography
    • North America
      • US
      • Canada
    • Europe
      • France
      • Germany
      • UK
    • APAC
      • China
      • India
      • Japan
      • South Korea
    • South America
      • Brazil
    • Rest of World (ROW)

    By Application Insights

    The transportation services segment is estimated to witness significant growth during the forecast period.

    The market's transportation services segment is a significant contributor to the industry's growth. This segment specializes in various transportation modes, including road, rail, air, and sea, to move goods efficiently. Outsourcing cargo and freight transportation to 3PL providers is increasingly popular due to the substantial investment and expertise required. The transportation services segment offers additional benefits, such as freight forwarding, project logistics, network planning, cargo insurance, optimization, and customs brokerage. Technological advancements are driving innovation in the transportation services segment. Real-time visibility, capacity planning, and route optimization are crucial elements that enhance supply chain efficiency. Data analytics and predictive analytics facilitate demand forecasting and inventory management, ensuring accurate order fulfillment.

    Fleet management systems optimize vehicle utilization and reduce carbon footprint. Yard management systems streamline loading and unloading processes, while technology integration enables seamless data exchange between systems. Efficiency metrics, risk management, and labor management are essential components of the transportation services segment. Warehouse automation, contract logistics, and order fulfillment are integral to the overall supply chain optimization. Reverse logistics, e-commerce logistics, and last-mile delivery are emerging trends that cater to evolving customer demands. The integration of artificial intelligence and machine learning in logistics processes further enhances operational efficiency and accuracy. In conclusion, the transportation services segment in the third-party logistics market is a dynamic and evolving sector that offers numerous benefits to businesses.

    Its ability to adapt to technological advancements and changing market trends positions it as a vital player in the global supply chain landscape.

    Third-Party Logistics (3PL) Market Size

    Request Free Sample

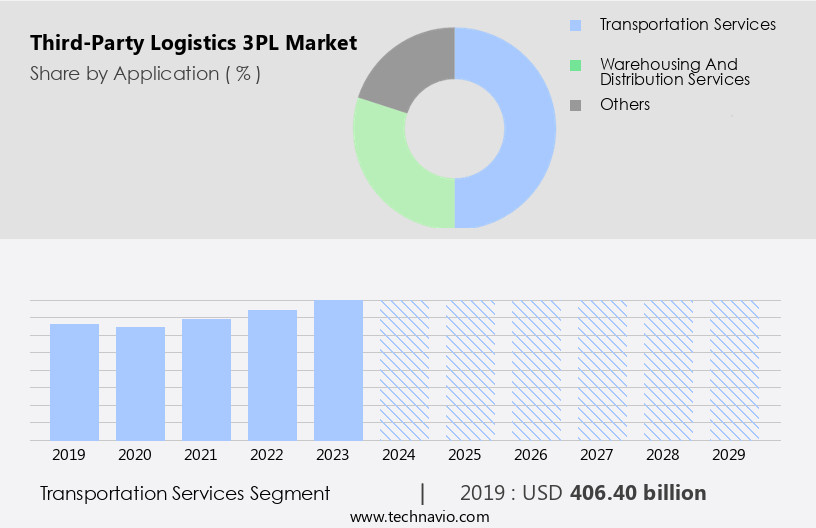
    The Transportation services segment was valued at USD 406.40 billion in 2019 and showed a gradual increase during the forecast period.

    Regional Analysis

    APAC is estimated to contribute 47% to the growth of the global market during the forecast period.Technavio’s analysts have elaborately explained the regional trends and drivers that shape the market during the forecast period.

    Third-Party Logistics (3PL) Market Share by Geography

     Request Free Sample

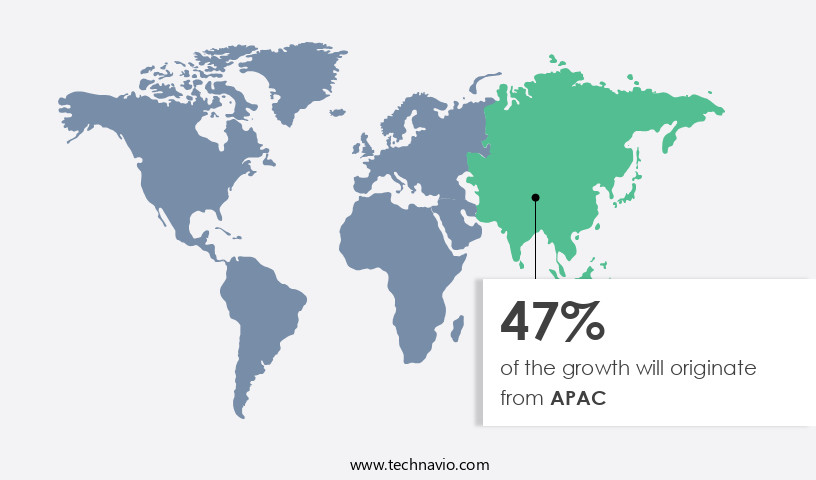
    The market in APAC is experiencing significant growth due to the increasing volume of international trade. The region's economic expansion, particularly in China and the automobile industries in Japan and India, presents substantial opportunities for 3PL service providers. However, the Indian logistics sector, which is largely unorganized, faces challenges such as high logistics costs, affecting both domestic and international competitiveness. To address these challenges, 3PLs are implementing advanced technologies such as real-time visibility, capacity planning, freight consolidation, route optimization, yard management, inventory management, data analytics, predictive analytics, and demand forecasting. These solutions improve efficiency, reduce costs, and enhance supply chain visibility.

    Additionally, 3PLs are focusing on cost optimization, risk management, technology integration, network design, and api integrations to streamline operations and provide customized services. Moreover, sustainability is becoming a critical consideration in the 3PL industry. Companies are implementing carbon footprint reduction strategies, fleet management, and warehouse automation to minimize their environmental impact. Furthermore, the integration of AI-powered logistics, e-commerce logistics, reverse logistics, and last-mile delivery solutions is enabling 3PLs to cater to evolving customer demands and stay competitive. Overall, the 3PL market in APAC is dynamic, with a focus on innovation, efficiency, and customer satisfaction.

    Market Dynamics

    Our researchers analyzed the data with 2024 as the base year, along with the key drivers, trends, and challenges. A holistic analysis of drivers will help companies refine their marketing strategies to gain a competitive advantage.

    The market is a dynamic and essential segment of the global supply chain industry. 3PL providers offer outsourced logistics solutions, expertly managing inventory, transportation, warehousing, and fulfillment for businesses seeking to streamline operations and focus on core competencies. Integrating advanced technologies like warehouse management systems (WMS), transportation management systems (TMS), and automation, 3PLs ensure efficient and cost-effective supply chain management. Flexible contract structures, scalability, and customized services cater to businesses of all sizes, from small startups to large enterprises. Strategic partnerships with carriers, technology providers, and other logistics players further enhance 3PLs' capabilities. Sustainability initiatives, regulatory compliance, and data analytics are key priorities, driving innovation and continuous improvement in the 3PL market.

    What are the key market drivers leading to the rise in the adoption of Third-Party Logistics (3PL) Industry?

    • The expansion of e-commerce and the resulting demand for seamless shipping solutions are primary market catalysts. 

    • The market has experienced significant growth due to the surge in e-commerce businesses and the increasing demand for efficient and cost-effective supply chain management. E-commerce companies require swift delivery systems, advanced inventory management, and streamlined freight forwarding to meet customer expectations and maintain operational success. 3PL providers offer business intelligence solutions, including predictive analytics and demand forecasting, to optimize inventory levels and minimize stockouts. Carbon footprint reduction is also a priority, with fleet management systems and sorting systems designed to improve efficiency metrics and reduce transportation costs. Risk management is crucial in this sector, with technology integration enabling real-time monitoring and automated responses to potential disruptions.
    • Efficient inventory management and quick delivery are essential in the e-commerce industry, making the need for advanced logistics solutions more pressing. The integration of technology, such as automated sorting systems and real-time tracking, has revolutionized the 3PL market, enabling businesses to make data-driven decisions and respond to market trends more effectively. In conclusion, the 3PL market is evolving to meet the demands of e-commerce businesses, offering advanced solutions for inventory management, freight forwarding, and risk management. The integration of technology, including predictive analytics and fleet management systems, is driving innovation and improving operational efficiency. The focus on sustainability and reducing carbon footprint is also a significant trend, with 3PL providers implementing strategies to minimize their environmental impact.

    What are the market trends shaping the Third-Party Logistics (3PL) Industry?

    • The emergence of big data analytics is a significant market trend, gaining increasing importance in today's data-driven business landscape. This trend signifies the growing recognition of the value in analyzing large and complex data sets to derive meaningful insights and inform strategic decision-making.

    • In the logistics sector, third-party logistics (3PL) providers and shippers are utilizing big data analytics to extract valuable insights from extensive data sets, thereby gaining a competitive edge. Big data analytics solutions facilitate the customization of services, expedite market demand, and inspire new business models based on agility. However, the implementation of big data analytics in logistics is still in its infancy due to substantial IT disparities. Big data analytics plays a pivotal role in three primary domains within the logistics industry: operational efficiency, customer experience, and new business models. By optimizing core activities, such as labor management, load planning, dock scheduling, freight forwarding, customs brokerage, and returns processing, logistics companies can enhance operational efficiency.
    • Moreover, big data analytics enables the provision of personalized services to customers, thereby improving customer experience. Lastly, the application of big data analytics can lead to the creation of innovative business models that prioritize flexibility and responsiveness. Additionally, big data analytics offers the optimization of essential logistics activities, including resource utilization, delivery time, and geographical coverage. Network design, API integrations, and dedicated contract carriage are some areas that can significantly benefit from big data analytics. By harnessing the power of big data analytics, logistics companies can streamline their operations, foster customer satisfaction, and maintain a competitive edge in the market.

    What challenges does the Third-Party Logistics (3PL) Industry face during its growth?

    • The convergence of high operational costs and competitive pricing poses a significant challenge to the industry's growth trajectory. 

    • The market is experiencing significant competition due to the increasing demand for value-added services and specialized solutions. However, rising fuel prices add to the operational costs, putting pressure on providers to maintain low prices for their customers. In response, businesses are seeking lower rates when renewing contracts and requesting additional services at the same price. Consequently, 3PL companies face cost pressures related to the pricing of their services. E-commerce logistics, including pick and pack and order fulfillment, are driving market growth.
    • Warehouse automation and AI-powered logistics solutions are also gaining popularity to enhance efficiency and accuracy. Reverse logistics and last-mile delivery are other areas of focus to meet customer demands for seamless returns and on-time delivery. Despite these challenges, 3PL companies are adapting by offering innovative solutions to reduce costs and improve overall supply chain efficiency.

    Exclusive Customer Landscape

    The third-party logistics (3pl) market forecasting report includes the adoption lifecycle of the market, covering from the innovator’s stage to the laggard’s stage. It focuses on adoption rates in different regions based on penetration. Furthermore, the third-party logistics (3pl) market report also includes key purchase criteria and drivers of price sensitivity to help companies evaluate and develop their market growth analysis strategies.
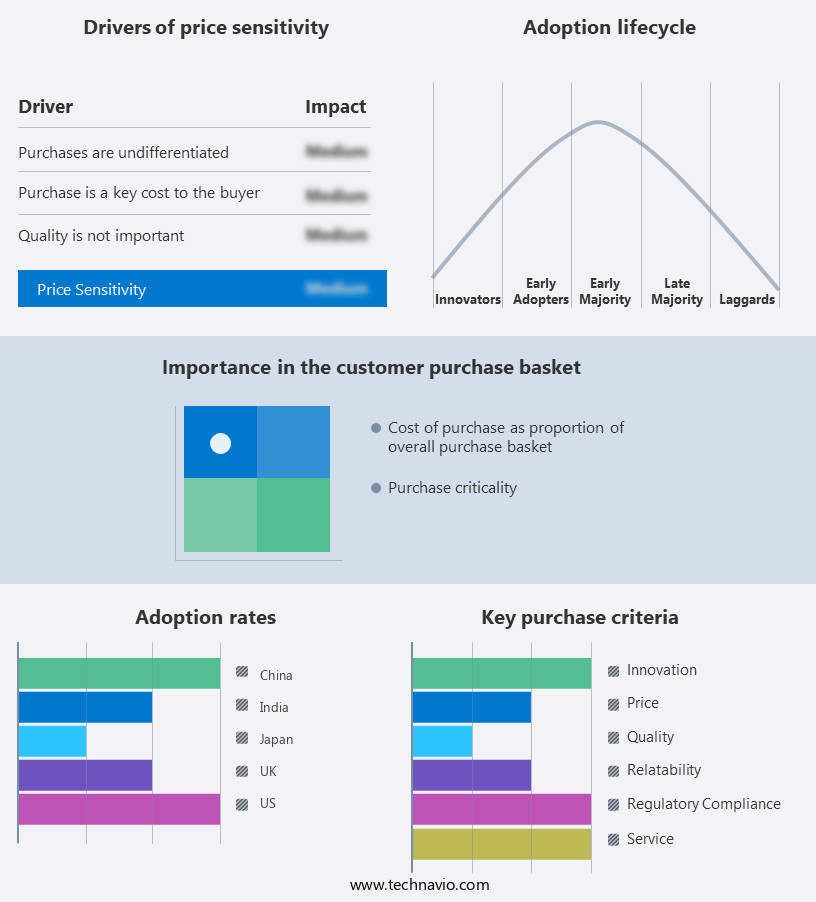
    Third-Party Logistics (3PL) Market Share by Geography

     Customer Landscape

    Key Companies & Market Insights

    Companies are implementing various strategies, such as strategic alliances, third-party logistics (3pl) market forecast, partnerships, mergers and acquisitions, geographical expansion, and product/service launches, to enhance their presence in the industry.

    Agility Public Warehousing Co. K.S.C.P - Third-party logistics provider offers global freight forwarding, contract logistics, warehousing, and specialized solutions for industries including chemicals, aerospace, and retail. Services ensure efficient supply chain management and enhanced market access. Solutions tailored to meet unique industry requirements. Expertise in international trade regulations and customs procedures. Innovative technology integration for streamlined operations.

    The industry research and growth report includes detailed analyses of the competitive landscape of the market and information about key companies, including:

    • Agility Public Warehousing Co. K.S.C.P
    • AP Moller Maersk AS
    • Baltic Logistics Group
    • BDP International Inc.
    • Burris Logistics Co.
    • C H Robinson Worldwide Inc.
    • CEVA Logistics SA
    • DB Schenker
    • Deutsche Bahn AG
    • Deutsche Post AG
    • FedEx Corp.
    • GEODIS
    • Hub Group Inc.
    • J B Hunt Transport Services Inc.
    • Kintetsu Group Holdings Co. Ltd.
    • Kuehne Nagel Management AG
    • Nippon Express Holdings Inc.
    • Sinotrans Ltd
    • United Parcel Service Inc.
    • XPO Inc.

    Qualitative and quantitative analysis of companies has been conducted to help clients understand the wider business environment as well as the strengths and weaknesses of key industry players. Data is qualitatively analyzed to categorize companies as pure play, category-focused, industry-focused, and diversified; it is quantitatively analyzed to categorize companies as dominant, leading, strong, tentative, and weak.

    Recent Development and News in Third-Party Logistics (3PL) Market

    • In January 2024, DHL Supply Chain, a leading third-party logistics (3PL) provider, announced the launch of its new Robotic Picking Solution in partnership with Swisslog, enhancing their order fulfillment capabilities (DHL press release). This technological advancement aimed to improve efficiency and reduce errors in the picking process.
    • In March 2024, UPS Logistics and DB Schenker, two major 3PL players, joined forces to offer integrated freight forwarding and contract logistics services, expanding their combined market reach and capabilities (UPS press release). This strategic partnership aimed to provide more comprehensive logistics solutions to their clients.
    • In May 2025, Kuehne + Nagel, a global 3PL company, secured a significant investment of USD500 million from Blackstone Group to strengthen its digital transformation and expand its logistics network (Bloomberg). This funding round demonstrated the growing interest in digitalization and innovation within the 3PL sector.
    • In the same month, FedEx Logistics received approval from the European Commission to acquire TNT Express, a leading European express and logistics company, marking a significant geographic expansion for FedEx (FedEx press release). This acquisition allowed FedEx to strengthen its European market presence and broaden its service offerings.

    Research Analyst Overview

    • The 3PL market encompasses various logistics services, including drop shipping, parcel delivery, and international logistics. A notable trend is the rise of direct-to-consumer (DTC) logistics, requiring efficient omni-channel fulfillment and returns management. Warehouse optimization and inventory control are crucial for managing stock levels and reducing carrying costs. Hazardous materials transportation and special commodity handling pose unique challenges, necessitating strict regulations and specialized expertise. Temperature-controlled transportation and cold chain logistics are essential for industries dealing with perishable goods. Value-added services, such as kitting and packaging, are increasingly popular, helping businesses save time and resources. Multimodal transportation, including truckload (TL), less-than-truckload (LTL), rail freight, intermodal transportation, and air freight, offers flexibility and cost savings.
    • Logistics software plays a pivotal role in managing complex supply chains, ensuring supply chain resilience and demand planning. Oversized load transportation and waste management are essential components of the 3PL market, catering to industries with large and bulky goods or waste disposal needs. In the realm of global logistics, international freight forwarding and ocean freight are vital for businesses engaging in international trade. Regional logistics networks facilitate efficient and cost-effective distribution within specific geographic areas. Consignment inventory and small parcel shipping are integral parts of the 3PL market, catering to businesses with varying logistics needs. Regardless of the specific logistics services required, the 3PL market continues to evolve, driven by the need for flexibility, efficiency, and innovation.

    Dive into Technavio’s robust research methodology, blending expert interviews, extensive data synthesis, and validated models for unparalleled Third-Party Logistics (3PL) Market insights. See full methodology.

    Market Scope

    Report Coverage

    Details

    Page number

    236

    Base year

    2024

    Historic period

    2019-2023

    Forecast period

    2025-2029

    Growth momentum & CAGR

    Accelerate at a CAGR of 8.4%

    Market growth 2025-2029

    USD 662.8 billion

    Market structure

    Fragmented

    YoY growth 2024-2025(%)

    7.6

    Key countries

    US, China, Japan, India, Brazil, South Korea, Germany, Canada, UK, and France

    Competitive landscape

    Leading Companies, Market Positioning of Companies, Competitive Strategies, and Industry Risks

    Request Free Sample

    What are the Key Data Covered in this Third-Party Logistics (3PL) Market Research and Growth Report?

    • CAGR of the Third-Party Logistics (3PL) industry during the forecast period
    • Detailed information on factors that will drive the growth and forecasting between 2025 and 2029
    • Precise estimation of the size of the market and its contribution of the industry in focus to the parent market
    • Accurate predictions about upcoming growth and trends and changes in consumer behaviour
    • Growth of the market across APAC, North America, Europe, South America, and Middle East and Africa
    • Thorough analysis of the market’s competitive landscape and detailed information about companies
    • Comprehensive analysis of factors that will challenge the third-party logistics (3pl) market growth of industry companies

    We can help! Our analysts can customize this third-party logistics (3pl) market research report to meet your requirements.

    Get in touch


    1 Executive Summary

    • 1.1 Market overview
      • Executive Summary - Chart on Market Overview
      • Executive Summary - Data Table on Market Overview
      • Executive Summary - Chart on Global Market Characteristics
      • Executive Summary - Chart on Market by Geography
      • Executive Summary - Chart on Market Segmentation by Application
      • Executive Summary - Chart on Market Segmentation by End-user
      • Executive Summary - Chart on Market Segmentation by Mode of Transportation
      • Executive Summary - Chart on Incremental Growth
      • Executive Summary - Data Table on Incremental Growth
      • Executive Summary - Chart on Company Market Positioning

    2 Technavio Analysis

    • 2.1 Analysis of price sensitivity, lifecycle, customer purchase basket, adoption rates, and purchase criteria
      • Analysis of price sensitivity, lifecycle, customer purchase basket, adoption rates, and purchase criteria
    • 2.2 Criticality of inputs and Factors of differentiation
      • Overview on criticality of inputs and factors of differentiation
    • 2.3 Factors of disruption
      • Overview on factors of disruption
    • 2.4 Impact of drivers and challenges
      • Impact of drivers and challenges in 2024 and 2029

    3 Market Landscape

    • 3.1 Market ecosystem
      • Parent Market
      • Data Table on - Parent Market
    • 3.2 Market characteristics
      • Market characteristics analysis
    • 3.3 Value chain analysis
      • Value chain analysis

    4 Market Sizing

    • 4.1 Market definition
      • Offerings of companies included in the market definition
    • 4.2 Market segment analysis
      • Market segments
    • 4.3 Market size 2024
      • 4.4 Market outlook: Forecast for 2024-2029
        • Chart on Global - Market size and forecast 2024-2029 ($ billion)
        • Data Table on Global - Market size and forecast 2024-2029 ($ billion)
        • Chart on Global Market: Year-over-year growth 2024-2029 (%)
        • Data Table on Global Market: Year-over-year growth 2024-2029 (%)

      5 Historic Market Size

      • 5.1 Global Third-Party Logistics (3PL) Market 2019 - 2023
        • Historic Market Size - Data Table on Global Third-Party Logistics (3PL) Market 2019 - 2023 ($ billion)
      • 5.2 Application segment analysis 2019 - 2023
        • Historic Market Size - Application Segment 2019 - 2023 ($ billion)
      • 5.3 End-user segment analysis 2019 - 2023
        • Historic Market Size - End-user Segment 2019 - 2023 ($ billion)
      • 5.4 Mode of Transportation segment analysis 2019 - 2023
        • Historic Market Size - Mode of Transportation Segment 2019 - 2023 ($ billion)
      • 5.5 Geography segment analysis 2019 - 2023
        • Historic Market Size - Geography Segment 2019 - 2023 ($ billion)
      • 5.6 Country segment analysis 2019 - 2023
        • Historic Market Size - Country Segment 2019 - 2023 ($ billion)

      6 Qualitative Analysis

      • 6.1 Impact of AI on Global Third-party Logistics (3PL) Market

        7 Five Forces Analysis

        • 7.1 Five forces summary
          • Five forces analysis - Comparison between 2024 and 2029
        • 7.2 Bargaining power of buyers
          • Bargaining power of buyers - Impact of key factors 2024 and 2029
        • 7.3 Bargaining power of suppliers
          • Bargaining power of suppliers - Impact of key factors in 2024 and 2029
        • 7.4 Threat of new entrants
          • Threat of new entrants - Impact of key factors in 2024 and 2029
        • 7.5 Threat of substitutes
          • Threat of substitutes - Impact of key factors in 2024 and 2029
        • 7.6 Threat of rivalry
          • Threat of rivalry - Impact of key factors in 2024 and 2029
        • 7.7 Market condition
          • Chart on Market condition - Five forces 2024 and 2029

        8 Market Segmentation by Application

        • 8.1 Market segments
          • Chart on Application - Market share 2024-2029 (%)
          • Data Table on Application - Market share 2024-2029 (%)
        • 8.2 Comparison by Application
          • Chart on Comparison by Application
          • Data Table on Comparison by Application
        • 8.3 Transportation services - Market size and forecast 2024-2029
          • Chart on Transportation services - Market size and forecast 2024-2029 ($ billion)
          • Data Table on Transportation services - Market size and forecast 2024-2029 ($ billion)
          • Chart on Transportation services - Year-over-year growth 2024-2029 (%)
          • Data Table on Transportation services - Year-over-year growth 2024-2029 (%)
        • 8.4 Warehousing and distribution services - Market size and forecast 2024-2029
          • Chart on Warehousing and distribution services - Market size and forecast 2024-2029 ($ billion)
          • Data Table on Warehousing and distribution services - Market size and forecast 2024-2029 ($ billion)
          • Chart on Warehousing and distribution services - Year-over-year growth 2024-2029 (%)
          • Data Table on Warehousing and distribution services - Year-over-year growth 2024-2029 (%)
        • 8.5 Others - Market size and forecast 2024-2029
          • Chart on Others - Market size and forecast 2024-2029 ($ billion)
          • Data Table on Others - Market size and forecast 2024-2029 ($ billion)
          • Chart on Others - Year-over-year growth 2024-2029 (%)
          • Data Table on Others - Year-over-year growth 2024-2029 (%)
        • 8.6 Market opportunity by Application
          • Market opportunity by Application ($ billion)
          • Data Table on Market opportunity by Application ($ billion)

        9 Market Segmentation by End-user

        • 9.1 Market segments
          • Chart on End-user - Market share 2024-2029 (%)
          • Data Table on End-user - Market share 2024-2029 (%)
        • 9.2 Comparison by End-user
          • Chart on Comparison by End-user
          • Data Table on Comparison by End-user
        • 9.3 Manufacturing - Market size and forecast 2024-2029
          • Chart on Manufacturing - Market size and forecast 2024-2029 ($ billion)
          • Data Table on Manufacturing - Market size and forecast 2024-2029 ($ billion)
          • Chart on Manufacturing - Year-over-year growth 2024-2029 (%)
          • Data Table on Manufacturing - Year-over-year growth 2024-2029 (%)
        • 9.4 Retail - Market size and forecast 2024-2029
          • Chart on Retail - Market size and forecast 2024-2029 ($ billion)
          • Data Table on Retail - Market size and forecast 2024-2029 ($ billion)
          • Chart on Retail - Year-over-year growth 2024-2029 (%)
          • Data Table on Retail - Year-over-year growth 2024-2029 (%)
        • 9.5 Consumer goods - Market size and forecast 2024-2029
          • Chart on Consumer goods - Market size and forecast 2024-2029 ($ billion)
          • Data Table on Consumer goods - Market size and forecast 2024-2029 ($ billion)
          • Chart on Consumer goods - Year-over-year growth 2024-2029 (%)
          • Data Table on Consumer goods - Year-over-year growth 2024-2029 (%)
        • 9.6 Healthcare - Market size and forecast 2024-2029
          • Chart on Healthcare - Market size and forecast 2024-2029 ($ billion)
          • Data Table on Healthcare - Market size and forecast 2024-2029 ($ billion)
          • Chart on Healthcare - Year-over-year growth 2024-2029 (%)
          • Data Table on Healthcare - Year-over-year growth 2024-2029 (%)
        • 9.7 Others - Market size and forecast 2024-2029
          • Chart on Others - Market size and forecast 2024-2029 ($ billion)
          • Data Table on Others - Market size and forecast 2024-2029 ($ billion)
          • Chart on Others - Year-over-year growth 2024-2029 (%)
          • Data Table on Others - Year-over-year growth 2024-2029 (%)
        • 9.8 Market opportunity by End-user
          • Market opportunity by End-user ($ billion)
          • Data Table on Market opportunity by End-user ($ billion)

        10 Market Segmentation by Mode of Transportation

        • 10.1 Market segments
          • Chart on Mode of Transportation - Market share 2024-2029 (%)
          • Data Table on Mode of Transportation - Market share 2024-2029 (%)
        • 10.2 Comparison by Mode of Transportation
          • Chart on Comparison by Mode of Transportation
          • Data Table on Comparison by Mode of Transportation
        • 10.3 Roadways - Market size and forecast 2024-2029
          • Chart on Roadways - Market size and forecast 2024-2029 ($ billion)
          • Data Table on Roadways - Market size and forecast 2024-2029 ($ billion)
          • Chart on Roadways - Year-over-year growth 2024-2029 (%)
          • Data Table on Roadways - Year-over-year growth 2024-2029 (%)
        • 10.4 Seaways - Market size and forecast 2024-2029
          • Chart on Seaways - Market size and forecast 2024-2029 ($ billion)
          • Data Table on Seaways - Market size and forecast 2024-2029 ($ billion)
          • Chart on Seaways - Year-over-year growth 2024-2029 (%)
          • Data Table on Seaways - Year-over-year growth 2024-2029 (%)
        • 10.5 Railways - Market size and forecast 2024-2029
          • Chart on Railways - Market size and forecast 2024-2029 ($ billion)
          • Data Table on Railways - Market size and forecast 2024-2029 ($ billion)
          • Chart on Railways - Year-over-year growth 2024-2029 (%)
          • Data Table on Railways - Year-over-year growth 2024-2029 (%)
        • 10.6 Airways - Market size and forecast 2024-2029
          • Chart on Airways - Market size and forecast 2024-2029 ($ billion)
          • Data Table on Airways - Market size and forecast 2024-2029 ($ billion)
          • Chart on Airways - Year-over-year growth 2024-2029 (%)
          • Data Table on Airways - Year-over-year growth 2024-2029 (%)
        • 10.7 Multimodal transport - Market size and forecast 2024-2029
          • Chart on Multimodal transport - Market size and forecast 2024-2029 ($ billion)
          • Data Table on Multimodal transport - Market size and forecast 2024-2029 ($ billion)
          • Chart on Multimodal transport - Year-over-year growth 2024-2029 (%)
          • Data Table on Multimodal transport - Year-over-year growth 2024-2029 (%)
        • 10.8 Market opportunity by Mode of Transportation
          • Market opportunity by Mode of Transportation ($ billion)
          • Data Table on Market opportunity by Mode of Transportation ($ billion)

        11 Customer Landscape

        • 11.1 Customer landscape overview
          • Analysis of price sensitivity, lifecycle, customer purchase basket, adoption rates, and purchase criteria

        12 Geographic Landscape

        • 12.1 Geographic segmentation
          • Chart on Market share by geography 2024-2029 (%)
          • Data Table on Market share by geography 2024-2029 (%)
        • 12.2 Geographic comparison
          • Chart on Geographic comparison
          • Data Table on Geographic comparison
        • 12.3 APAC - Market size and forecast 2024-2029
          • Chart on APAC - Market size and forecast 2024-2029 ($ billion)
          • Data Table on APAC - Market size and forecast 2024-2029 ($ billion)
          • Chart on APAC - Year-over-year growth 2024-2029 (%)
          • Data Table on APAC - Year-over-year growth 2024-2029 (%)
        • 12.4 North America - Market size and forecast 2024-2029
          • Chart on North America - Market size and forecast 2024-2029 ($ billion)
          • Data Table on North America - Market size and forecast 2024-2029 ($ billion)
          • Chart on North America - Year-over-year growth 2024-2029 (%)
          • Data Table on North America - Year-over-year growth 2024-2029 (%)
        • 12.5 Europe - Market size and forecast 2024-2029
          • Chart on Europe - Market size and forecast 2024-2029 ($ billion)
          • Data Table on Europe - Market size and forecast 2024-2029 ($ billion)
          • Chart on Europe - Year-over-year growth 2024-2029 (%)
          • Data Table on Europe - Year-over-year growth 2024-2029 (%)
        • 12.6 South America - Market size and forecast 2024-2029
          • Chart on South America - Market size and forecast 2024-2029 ($ billion)
          • Data Table on South America - Market size and forecast 2024-2029 ($ billion)
          • Chart on South America - Year-over-year growth 2024-2029 (%)
          • Data Table on South America - Year-over-year growth 2024-2029 (%)
        • 12.7 Middle East and Africa - Market size and forecast 2024-2029
          • Chart on Middle East and Africa - Market size and forecast 2024-2029 ($ billion)
          • Data Table on Middle East and Africa - Market size and forecast 2024-2029 ($ billion)
          • Chart on Middle East and Africa - Year-over-year growth 2024-2029 (%)
          • Data Table on Middle East and Africa - Year-over-year growth 2024-2029 (%)
        • 12.8 US - Market size and forecast 2024-2029
          • Chart on US - Market size and forecast 2024-2029 ($ billion)
          • Data Table on US - Market size and forecast 2024-2029 ($ billion)
          • Chart on US - Year-over-year growth 2024-2029 (%)
          • Data Table on US - Year-over-year growth 2024-2029 (%)
        • 12.9 China - Market size and forecast 2024-2029
          • Chart on China - Market size and forecast 2024-2029 ($ billion)
          • Data Table on China - Market size and forecast 2024-2029 ($ billion)
          • Chart on China - Year-over-year growth 2024-2029 (%)
          • Data Table on China - Year-over-year growth 2024-2029 (%)
        • 12.10 Japan - Market size and forecast 2024-2029
          • Chart on Japan - Market size and forecast 2024-2029 ($ billion)
          • Data Table on Japan - Market size and forecast 2024-2029 ($ billion)
          • Chart on Japan - Year-over-year growth 2024-2029 (%)
          • Data Table on Japan - Year-over-year growth 2024-2029 (%)
        • 12.11 India - Market size and forecast 2024-2029
          • Chart on India - Market size and forecast 2024-2029 ($ billion)
          • Data Table on India - Market size and forecast 2024-2029 ($ billion)
          • Chart on India - Year-over-year growth 2024-2029 (%)
          • Data Table on India - Year-over-year growth 2024-2029 (%)
        • 12.12 Brazil - Market size and forecast 2024-2029
          • Chart on Brazil - Market size and forecast 2024-2029 ($ billion)
          • Data Table on Brazil - Market size and forecast 2024-2029 ($ billion)
          • Chart on Brazil - Year-over-year growth 2024-2029 (%)
          • Data Table on Brazil - Year-over-year growth 2024-2029 (%)
        • 12.13 South Korea - Market size and forecast 2024-2029
          • Chart on South Korea - Market size and forecast 2024-2029 ($ billion)
          • Data Table on South Korea - Market size and forecast 2024-2029 ($ billion)
          • Chart on South Korea - Year-over-year growth 2024-2029 (%)
          • Data Table on South Korea - Year-over-year growth 2024-2029 (%)
        • 12.14 Germany - Market size and forecast 2024-2029
          • Chart on Germany - Market size and forecast 2024-2029 ($ billion)
          • Data Table on Germany - Market size and forecast 2024-2029 ($ billion)
          • Chart on Germany - Year-over-year growth 2024-2029 (%)
          • Data Table on Germany - Year-over-year growth 2024-2029 (%)
        • 12.15 Canada - Market size and forecast 2024-2029
          • Chart on Canada - Market size and forecast 2024-2029 ($ billion)
          • Data Table on Canada - Market size and forecast 2024-2029 ($ billion)
          • Chart on Canada - Year-over-year growth 2024-2029 (%)
          • Data Table on Canada - Year-over-year growth 2024-2029 (%)
        • 12.16 UK - Market size and forecast 2024-2029
          • Chart on UK - Market size and forecast 2024-2029 ($ billion)
          • Data Table on UK - Market size and forecast 2024-2029 ($ billion)
          • Chart on UK - Year-over-year growth 2024-2029 (%)
          • Data Table on UK - Year-over-year growth 2024-2029 (%)
        • 12.17 France - Market size and forecast 2024-2029
          • Chart on France - Market size and forecast 2024-2029 ($ billion)
          • Data Table on France - Market size and forecast 2024-2029 ($ billion)
          • Chart on France - Year-over-year growth 2024-2029 (%)
          • Data Table on France - Year-over-year growth 2024-2029 (%)
        • 12.18 Market opportunity by geography
          • Market opportunity by geography ($ billion)
          • Data Tables on Market opportunity by geography ($ billion)

        13 Drivers, Challenges, and Opportunity/Restraints

        • 13.1 Market drivers
          • 13.2 Market challenges
            • 13.3 Impact of drivers and challenges
              • Impact of drivers and challenges in 2024 and 2029
            • 13.4 Market opportunities/restraints

              14 Competitive Landscape

              • 14.1 Overview
                • 14.2 Competitive Landscape
                  • Overview on criticality of inputs and factors of differentiation
                • 14.3 Landscape disruption
                  • Overview on factors of disruption
                • 14.4 Industry risks
                  • Impact of key risks on business

                15 Competitive Analysis

                • 15.1 Companies profiled
                  • Companies covered
                • 15.2 Company ranking index
                  • Company ranking index
                • 15.3 Market positioning of companies
                  • Matrix on companies position and classification
                • 15.4 Agility Public Warehousing Co. K.S.C.P
                  • Agility Public Warehousing Co. K.S.C.P - Overview
                  • Agility Public Warehousing Co. K.S.C.P - Business segments
                  • Agility Public Warehousing Co. K.S.C.P - Key offerings
                  • Agility Public Warehousing Co. K.S.C.P - Segment focus
                  • SWOT
                • 15.5 AP Moller Maersk AS
                  • AP Moller Maersk AS - Overview
                  • AP Moller Maersk AS - Business segments
                  • AP Moller Maersk AS - Key news
                  • AP Moller Maersk AS - Key offerings
                  • AP Moller Maersk AS - Segment focus
                  • SWOT
                • 15.6 BDP International Inc.
                  • BDP International Inc. - Overview
                  • BDP International Inc. - Product / Service
                  • BDP International Inc. - Key offerings
                  • SWOT
                • 15.7 Burris Logistics Co.
                  • Burris Logistics Co. - Overview
                  • Burris Logistics Co. - Product / Service
                  • Burris Logistics Co. - Key offerings
                  • SWOT
                • 15.8 C H Robinson Worldwide Inc.
                  • C H Robinson Worldwide Inc. - Overview
                  • C H Robinson Worldwide Inc. - Product / Service
                  • C H Robinson Worldwide Inc. - Key news
                  • C H Robinson Worldwide Inc. - Key offerings
                  • SWOT
                • 15.9 CEVA Logistics SA
                  • CEVA Logistics SA - Overview
                  • CEVA Logistics SA - Product / Service
                  • CEVA Logistics SA - Key news
                  • CEVA Logistics SA - Key offerings
                  • SWOT
                • 15.10 DB Schenker
                  • DB Schenker - Overview
                  • DB Schenker - Product / Service
                  • DB Schenker - Key offerings
                  • SWOT
                • 15.11 Deutsche Bahn AG
                  • Deutsche Bahn AG - Overview
                  • Deutsche Bahn AG - Product / Service
                  • Deutsche Bahn AG - Key offerings
                  • SWOT
                • 15.12 Deutsche Post AG
                  • Deutsche Post AG - Overview
                  • Deutsche Post AG - Business segments
                  • Deutsche Post AG - Key news
                  • Deutsche Post AG - Key offerings
                  • Deutsche Post AG - Segment focus
                  • SWOT
                • 15.13 Hub Group Inc.
                  • Hub Group Inc. - Overview
                  • Hub Group Inc. - Product / Service
                  • Hub Group Inc. - Key offerings
                  • SWOT
                • 15.14 Kuehne Nagel Management AG
                  • Kuehne Nagel Management AG - Overview
                  • Kuehne Nagel Management AG - Business segments
                  • Kuehne Nagel Management AG - Key news
                  • Kuehne Nagel Management AG - Key offerings
                  • Kuehne Nagel Management AG - Segment focus
                  • SWOT
                • 15.15 Nippon Express Holdings Inc.
                  • Nippon Express Holdings Inc. - Overview
                  • Nippon Express Holdings Inc. - Business segments
                  • Nippon Express Holdings Inc. - Key news
                  • Nippon Express Holdings Inc. - Key offerings
                  • Nippon Express Holdings Inc. - Segment focus
                  • SWOT
                • 15.16 Sinotrans Ltd
                  • Sinotrans Ltd - Overview
                  • Sinotrans Ltd - Product / Service
                  • Sinotrans Ltd - Key offerings
                  • SWOT
                • 15.17 United Parcel Service Inc.
                  • United Parcel Service Inc. - Overview
                  • United Parcel Service Inc. - Business segments
                  • United Parcel Service Inc. - Key news
                  • United Parcel Service Inc. - Key offerings
                  • United Parcel Service Inc. - Segment focus
                  • SWOT
                • 15.18 XPO Inc.
                  • XPO Inc. - Overview
                  • XPO Inc. - Business segments
                  • XPO Inc. - Key news
                  • XPO Inc. - Key offerings
                  • XPO Inc. - Segment focus
                  • SWOT

                16 Appendix

                • 16.1 Scope of the report
                  • 16.2 Inclusions and exclusions checklist
                    • Inclusions checklist
                    • Exclusions checklist
                  • 16.3 Currency conversion rates for US$
                    • Currency conversion rates for US$
                  • 16.4 Research methodology
                    • Research methodology
                  • 16.5 Data procurement
                    • Information sources
                  • 16.6 Data validation
                    • Data validation
                  • 16.7 Validation techniques employed for market sizing
                    • Validation techniques employed for market sizing
                  • 16.8 Data synthesis
                    • Data synthesis
                  • 16.9 360 degree market analysis
                    • 360 degree market analysis
                  • 16.10 List of abbreviations
                    • List of abbreviations

                  Research Methodology

                  Technavio presents a detailed picture of the market by way of study, synthesis, and summation of data from multiple sources. The analysts have presented the various facets of the market with a particular focus on identifying the key industry influencers. The data thus presented is comprehensive, reliable, and the result of extensive research, both primary and secondary.

                  INFORMATION SOURCES

                  Primary sources

                  • Manufacturers and suppliers
                  • Channel partners
                  • Industry experts
                  • Strategic decision makers

                  Secondary sources

                  • Industry journals and periodicals
                  • Government data
                  • Financial reports of key industry players
                  • Historical data
                  • Press releases

                  DATA ANALYSIS

                  Data Synthesis

                  • Collation of data
                  • Estimation of key figures
                  • Analysis of derived insights

                  Data Validation

                  • Triangulation with data models
                  • Reference against proprietary databases
                  • Corroboration with industry experts

                  REPORT WRITING

                  Qualitative

                  • Market drivers
                  • Market challenges
                  • Market trends
                  • Five forces analysis

                  Quantitative

                  • Market size and forecast
                  • Market segmentation
                  • Geographical insights
                  • Competitive landscape

                  Interested in this report?

                  Get your sample now to see our research methodology and insights!

                  Download Now

                  Frequently Asked Questions

                  Third-Party Logistics (3Pl) market growth will increase by $ 662.8 bn during 2025-2029.

                  The Third-Party Logistics (3Pl) market is expected to grow at a CAGR of 8.4% during 2025-2029.

                  Third-Party Logistics (3Pl) market is segmented by Application( Transportation services, Warehousing and distribution services, Others) End-user( Manufacturing, Retail, Consumer goods, Healthcare, Others) Mode Of Transportation( Roadways, Seaways, Railways, Airways, Multimodal transport)

                  Agility Public Warehousing Co. K.S.C.P, AP Moller Maersk AS, Baltic Logistics Group, BDP International Inc., Burris Logistics Co., C H Robinson Worldwide Inc., CEVA Logistics SA, DB Schenker, Deutsche Bahn AG, Deutsche Post AG, FedEx Corp., GEODIS, Hub Group Inc., J B Hunt Transport Services Inc., Kintetsu Group Holdings Co. Ltd., Kuehne Nagel Management AG, Nippon Express Holdings Inc., Sinotrans Ltd, United Parcel Service Inc., XPO Inc. are a few of the key vendors in the Third-Party Logistics (3Pl) market.

                  APAC will register the highest growth rate of 47% among the other regions. Therefore, the Third-Party Logistics (3Pl) market in APAC is expected to garner significant business opportunities for the vendors during the forecast period.

                  US, China, Japan, India, Brazil, South Korea, Germany, Canada, UK, France

                  • Growth of e-commerce and need for integrated shipping servicesThe emergence of the e-commerce sector is attributable to the rise in domestic consumption of products among the rapidly expanding middle-class population and the increasing adoption of the Internet and mobile services. As the global parcel volumes continue to grow at an exponential rate is the driving factor this market.
                  • the e-commerce companies have found a reliable logistics partner in 3PL providers for more streamlined and cost-effective supply chain management. Therefore is the driving factor this market.
                  • the growth in the e-commerce industry has emerged as one of the major factors reshaping the global third-party logistics (3PL) market. Efficient inventory management and quick delivery have emerged as the keys to operational success in e-commerce is the driving factor this market.
                  • which has led to an increased need for efficiency in delivery systems is the driving factor this market.
                  • inventory management is the driving factor this market.
                  • and freight forwarding.An efficient supply chain provides an exceptional level of service across all channels. Due to a limited supply and the increase in demand is the driving factor this market.
                  • adopting the right distribution channel to reach out to consumers is also an increasingly difficult task. Therefore is the driving factor this market.
                  • several retailers opt to partner with 3PL service providers that provide integrated shipping services. As the e-commerce industry continues to expand is the driving factor this market.
                  • the demand for 3PL services is also estimated to grow is the driving factor this market.
                  • which in turn will drive the growth of the market in focus during the forecast period. is the driving factor this market.

                  The Third-Party Logistics (3Pl) market vendors should focus on grabbing business opportunities from the Transportation services segment as it accounted for the largest market share in the base year.