THEIC Market Analysis, Size, and Forecast 2026-2030: APAC (China, Japan, and South Korea), Europe (Germany, UK, and France), North America (US, Canada, and Mexico), South America (Brazil, Argentina, and Colombia), Middle East and Africa (Saudi Arabia, UAE, and South Africa), and Rest of World (ROW)

THEIC Market Analysis, Size, and Forecast 2026-2030:
APAC (China, Japan, and South Korea), Europe (Germany, UK, and France), North America (US, Canada, and Mexico), South America (Brazil, Argentina, and Colombia), Middle East and Africa (Saudi Arabia, UAE, and South Africa), and Rest of World (ROW)

Published: Jan 2026 299 Pages SKU: IRTNTR70734

Market Overview at a Glance

$93.7 Mn
Market Opportunity
5.9%
CAGR 2025 - 2030
46.2%
APAC Growth
$164.3 Mn
Paints and coatings segment 2024

THEIC Market Size 2026-2030

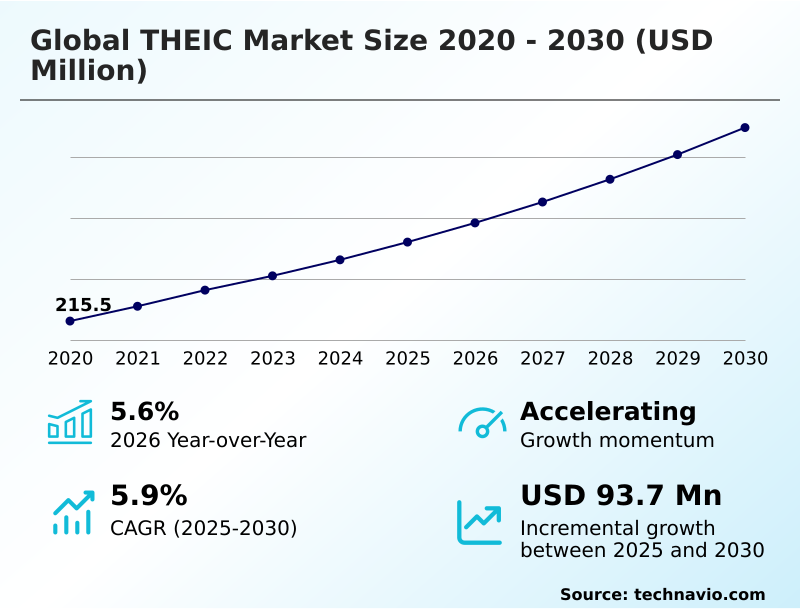
The theic market size is valued to increase by USD 93.7 million, at a CAGR of 5.9% from 2025 to 2030. Accelerated electrification of automotive sector will drive the theic market.

Major Market Trends & Insights

  • APAC dominated the market and accounted for a 46.2% growth during the forecast period.
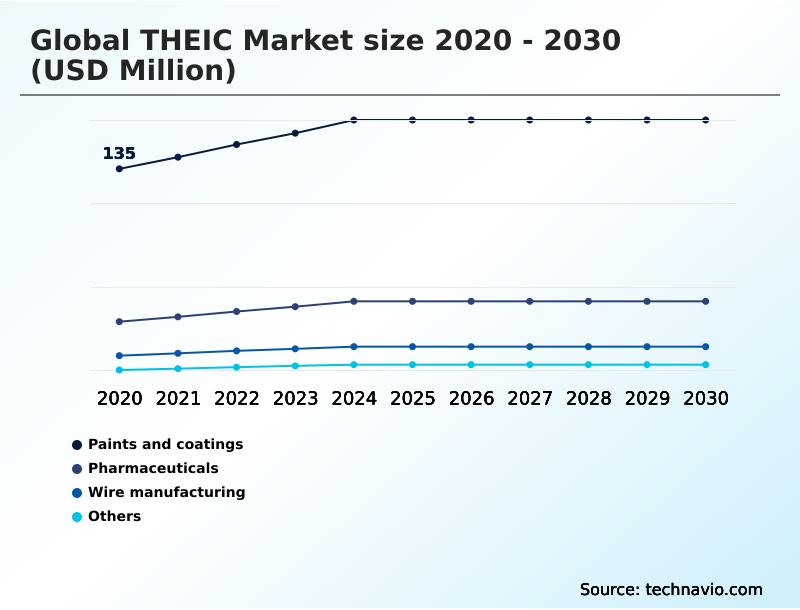
  • By End-user - Paints and coatings segment was valued at USD 164.3 million in 2024
  • By Grade Type - Grade 1 segment accounted for the largest market revenue share in 2024

Market Size & Forecast

  • Market Opportunities: USD 158.3 million
  • Market Future Opportunities: USD 93.7 million
  • CAGR from 2025 to 2030 : 5.9%

Market Summary

  • The THEIC market is propelled by its critical role in advanced manufacturing, particularly within the automotive and electronics sectors. This specialized chemical intermediate is fundamental to producing high-performance polymers, such as polyester-imide resins and polyamide-imide resins, which are essential for electrical insulation materials.
  • The ongoing global shift toward automotive electrification has intensified demand for robust components, where theic provides the necessary thermal stability and dielectric strength for electric vehicle traction motors operating under extreme conditions. A key business scenario involves supply chain managers for OEM suppliers who must secure a consistent supply of high-purity theic.
  • They balance the need for corona-resistant enamels to support 800-volt battery architectures against the backdrop of volatile petrochemical derivatives and the high costs of its chemical synthesis. This dynamic requires strategic sourcing and inventory management to mitigate risks associated with just-in-time chemical supply chains and ensure production continuity for next-generation electronic systems.

What will be the Size of the THEIC Market during the forecast period?

Get Key Insights on Market Forecast (PDF) Request Free Sample

How is the THEIC Market Segmented?

The theic industry research report provides comprehensive data (region-wise segment analysis), with forecasts and estimates in "USD million" for the period 2026-2030, as well as historical data from 2020-2024 for the following segments.

  • End-user
    • Paints and coatings
    • Pharmaceuticals
    • Wire manufacturing
    • Others
  • Grade type
    • Grade 1
    • Grade 2
  • Application
    • Coatings
    • Wire enamel
    • Plastic and resins
    • Others
  • Geography
    • APAC
      • China
      • Japan
      • South Korea
    • Europe
      • Germany
      • UK
      • France
    • North America
      • US
      • Canada
      • Mexico
    • South America
      • Brazil
      • Argentina
      • Colombia
    • Middle East and Africa
      • Saudi Arabia
      • UAE
      • South Africa
    • Rest of World (ROW)

By End-user Insights

The paints and coatings segment is estimated to witness significant growth during the forecast period.

In the coatings sector, Tris(2-hydroxyethyl) isocyanurate is a critical chemical intermediate, functioning as a high-performance cross-linking agent within polyester-imide resins and other thermosetting polymers.

The incorporation of this isocyanurate-based chemistry into the polymer matrix results in finishes with superior thermal endurance and weatherability. These properties are essential for industrial baking lacquers and powder coatings, where the material must withstand harsh environmental conditions.

Formulations benefit from a high glass transition temperature, ensuring the coating retains hardness and gloss, with some systems achieving over a 20% improvement in scratch resistance.

As the industry moves toward sustainable coating technologies, formulators are innovating with waterborne coating systems, leveraging grade 1 theic to maintain performance while complying with environmental health and safety regulations.

Request Free Sample

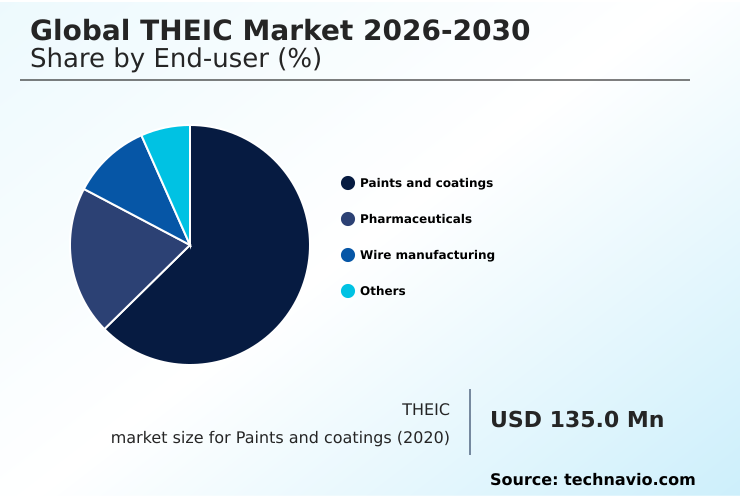
The Paints and coatings segment was valued at USD 164.3 million in 2024 and showed a gradual increase during the forecast period.

Request Free Sample

Regional Analysis

APAC is estimated to contribute 46.2% to the growth of the global market during the forecast period.Technavio’s analysts have elaborately explained the regional trends and drivers that shape the market during the forecast period.

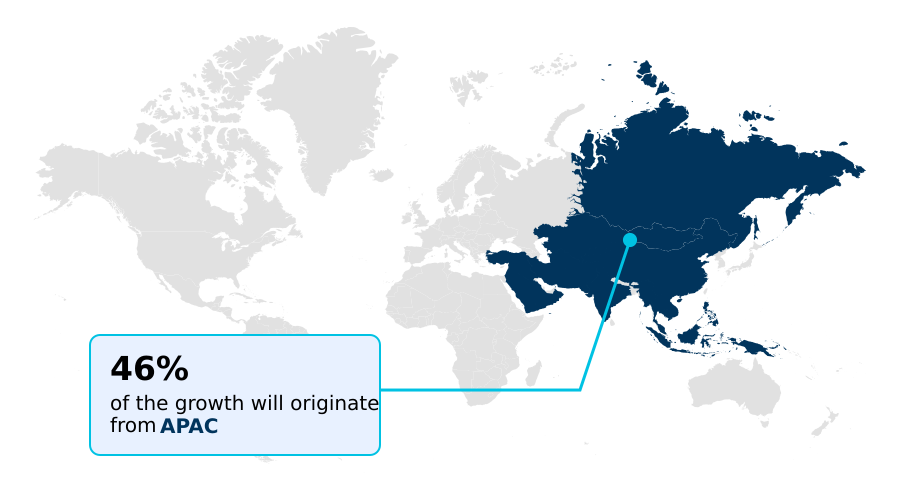
See How THEIC Market Demand is Rising in APAC Request Free Sample

APAC is the epicenter of the market, driven by its expansive manufacturing base in electronics and automotive sectors.

The region is projected to account for over 46% of the market's incremental growth, with its CAGR of 6.6% outpacing North America's 5.3%.

This growth is fueled by massive demand for magnet wire insulation and electrical insulation materials in countries like China and Japan.

The ongoing automotive electrification and the miniaturization trend in power conversion electronics create a continuous need for this high-purity chemical intermediate.

The material's role as a PVC heat stabilizer is also critical for the region's vast infrastructure projects, demanding consistent supply chains for both industrial grade 2 theic and high-purity grade 1 theic to support everything from consumer goods to advanced grid modernization efforts.

Market Dynamics

Our researchers analyzed the data with 2025 as the base year, along with the key drivers, trends, and challenges. A holistic analysis of drivers will help companies refine their marketing strategies to gain a competitive advantage.

  • The strategic importance of THEIC is increasingly defined by its specific applications across high-growth industries. The use of THEIC for high-voltage insulation systems is a prime example, where its role in enhancing the thermal endurance of motors is critical for the shift to 800-volt battery architecture insulation.
  • The impact of THEIC on thermal endurance of motors is a key performance metric, with formulations for class h insulation showing superior stability over alternatives. In parallel, THEIC applications in automotive wire manufacturing are expanding, where its function as a cross-linking agent in polyester-imide resins is non-negotiable.
  • For instance, grade 1 THEIC for polyester-imide resins ensures the necessary breakdown voltage and dielectric strength. There is also a significant focus on comparing THEIC with alternative insulation materials, although few can match its cost-performance ratio in demanding applications. Outside of automotive electrification, its function in flame retardant formulations and as a PVC heat stabilizer remains a core industrial application.
  • The challenges in THEIC raw material procurement, stemming from volatile petrochemical derivatives, force businesses to optimize their supply chains. A company that successfully manages its procurement can achieve a 15% better cost basis than competitors reliant on spot markets, highlighting the strategic advantage of secure sourcing.
  • This sourcing complexity, tied to synthesizing THEIC from cyanuric acid precursors, alongside the regulatory impact of REACH on THEIC production, shapes the competitive landscape.

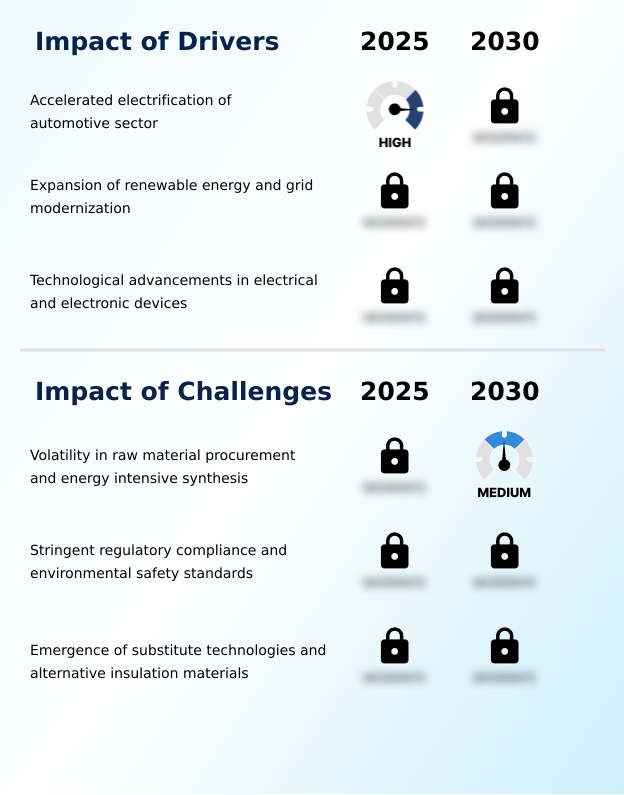
What are the key market drivers leading to the rise in the adoption of THEIC Industry?

  • The accelerated electrification of the automotive sector serves as a primary driver, fueling demand for high-performance materials.

  • The primary market driver is the accelerated electrification of the automotive sector, where THEIC is critical for high-performance polymers.
  • Its use in polyester-imide resins enables EV traction motors to operate under high thermal stress, contributing to a 15% increase in power density. Another key driver is the global expansion of renewable energy infrastructure and grid modernization.
  • Wind turbine generators and solar power inverters rely on theic-based insulation to ensure long-term reliability, with these materials improving inverter efficiency by up to 8%.
  • Furthermore, the continuous trend toward miniaturization and higher performance in the electrical and electronics sectors, including 5g telecommunications and high-power semiconductor modules, drives demand for heat-resistant materials.
  • THEIC's ability to create a stable polymer with a high glass transition temperature is essential for managing heat in these compact, high-power devices.

What are the market trends shaping the THEIC Industry?

  • A dominant trend shaping the market is the technical migration toward high-voltage insulation systems. This shift is driven by the evolving requirements of the electric mobility sector.

  • A dominant trend is the technical migration toward 800-volt battery architectures in the electric vehicle sector, which elevates electrical insulation standards. This shift is driving a surge in the development of advanced insulating varnishes that rely on the chemical stability of high-performance isocyanurates, with some new formulations improving partial discharge inception voltage by 25%.
  • This technical evolution is forcing closer collaboration between chemical producers and automotive suppliers. Concurrently, the coatings industry is aggressively shifting toward low-voc formulations and sustainable coating technologies to comply with stricter environmental regulations.
  • This transition to green-class insulating varnishes, which can achieve near-zero VOC emissions, creates demand for modified THEIC derivatives that maintain superior cross-linking density in eco-friendly waterborne coating systems without compromising the polymer matrix.

What challenges does the THEIC Industry face during its growth?

  • Volatility in the procurement of raw materials and the energy-intensive nature of synthesis processes present a key challenge for the market.

  • A primary challenge involves volatility in the procurement of petrochemical derivatives like cyanuric acid precursor and ethylene oxide precursor, which can see price fluctuations of up to 30% in a single quarter. This instability, coupled with the energy-intensive chemical synthesis process, creates significant margin pressure.
  • The reliance on a concentrated network of suppliers for high-purity grades increases the vulnerability of just-in-time chemical supply chains to disruptions. Another major hurdle is navigating the complex landscape of environmental health and safety regulations. Compliance with frameworks like REACH regulation compliance can increase operational overhead by over 10% due to investments in waste treatment and emissions control.
  • The emergence of alternative insulation technologies from ongoing material science innovation also presents a long-term competitive pressure, forcing constant R&D investment.

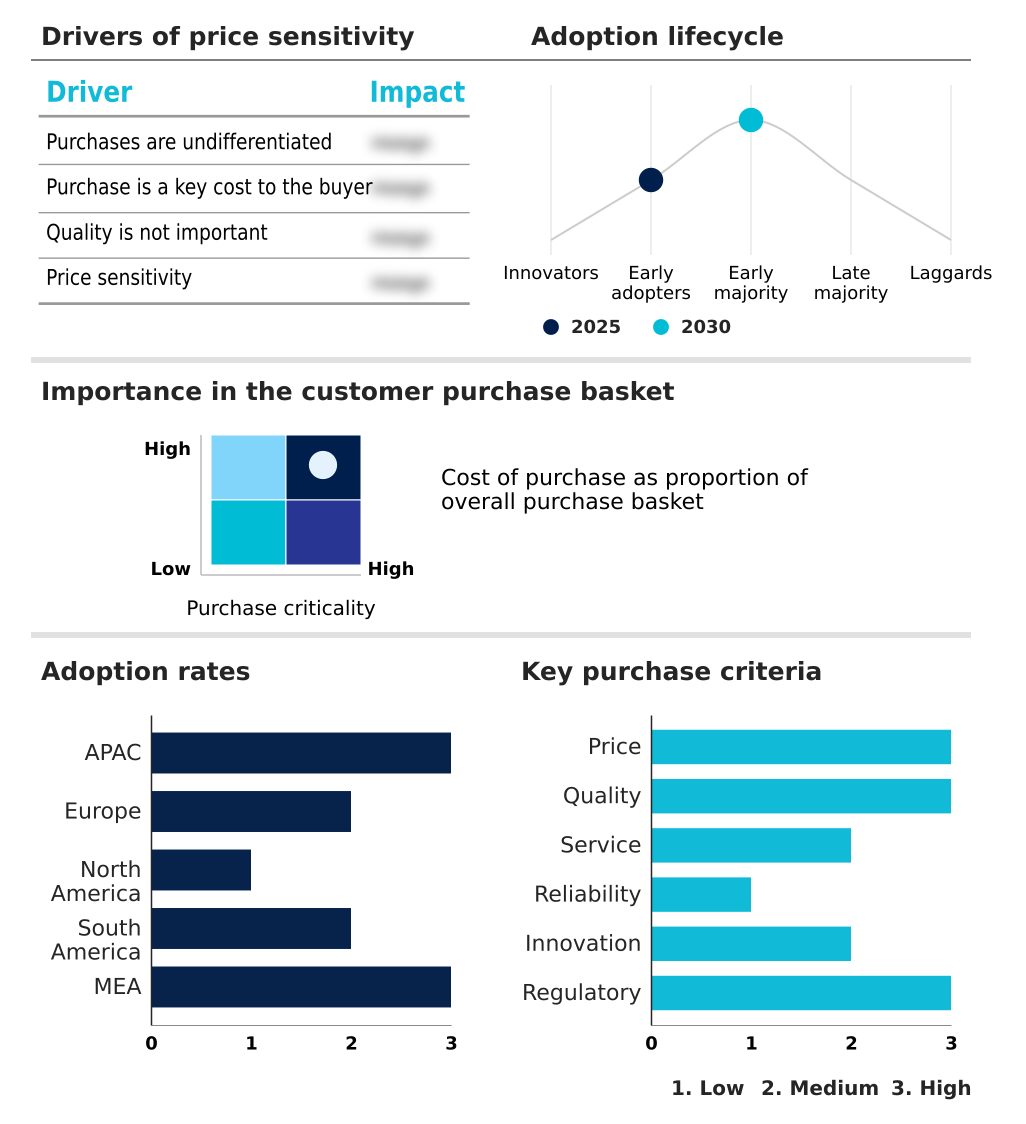
Exclusive Technavio Analysis on Customer Landscape

The theic market forecasting report includes the adoption lifecycle of the market, covering from the innovator’s stage to the laggard’s stage. It focuses on adoption rates in different regions based on penetration. Furthermore, the theic market report also includes key purchase criteria and drivers of price sensitivity to help companies evaluate and develop their market growth analysis strategies.

Customer Landscape of THEIC Industry

Competitive Landscape

Companies are implementing various strategies, such as strategic alliances, theic market forecast, partnerships, mergers and acquisitions, geographical expansion, and product/service launches, to enhance their presence in the industry.

AK Scientific Inc. - Delivering high-purity chemical intermediates and specialized isocyanurate-based chemistries engineered for advanced industrial applications and high-performance polymer synthesis.

The industry research and growth report includes detailed analyses of the competitive landscape of the market and information about key companies, including:

  • AK Scientific Inc.
  • Alfa Chemistry
  • Ataman Kimya A.S
  • Haihang Industry Co. Ltd.
  • Laffans Petrochemicals Ltd.
  • LAVEEK ADDCHEM
  • Merck KGaA
  • Nantong Haotai Chemical Co.Ltd.
  • Nissan Chemical Corp.
  • Shandong Jianbang Co. Ltd.
  • Shikoku Chemicals Corp.
  • The Cleveland Clinic Foundation
  • Tokyo Chemical Co. Ltd.
  • Toronto Research Chemicals
  • Wintersun International Inc.

Qualitative and quantitative analysis of companies has been conducted to help clients understand the wider business environment as well as the strengths and weaknesses of key industry players. Data is qualitatively analyzed to categorize companies as pure play, category-focused, industry-focused, and diversified; it is quantitatively analyzed to categorize companies as dominant, leading, strong, tentative, and weak.

Recent Development and News in Theic market

  • In August 2025, PPG Industries launched a new line of low-VOC, high-durability coatings for industrial infrastructure applications that rely on specialized cross-linking technologies.
  • In October 2025, Shikoku Chemicals Corp. announced the construction of a new R&D center in Japan, a strategic investment aimed at advancing high-functionality materials, including next-generation THEIC derivatives for electric vehicles.
  • In December 2025, Nissan Chemical Corp. announced its capital participation in Innova Agrotecnologia in Brazil, signifying a deepening investment in the agricultural supply chain where triazine-based chemistries are foundational.
  • In May 2025, Nissan Chemical Corp. released its financial results, emphasizing robust performance in its Performance Materials and Chemicals segments due to sustained demand for high-purity intermediates.

Dive into Technavio’s robust research methodology, blending expert interviews, extensive data synthesis, and validated models for unparalleled THEIC Market insights. See full methodology.

Market Scope
Page number 299
Base year 2025
Historic period 2020-2024
Forecast period 2026-2030
Growth momentum & CAGR Accelerate at a CAGR of 5.9%
Market growth 2026-2030 USD 93.7 million
Market structure Fragmented
YoY growth 2025-2026(%) 5.6%
Key countries China, Japan, South Korea, India, Australia, Indonesia, Germany, UK, France, Italy, The Netherlands, Spain, US, Canada, Mexico, Brazil, Argentina, Colombia, Saudi Arabia, UAE, South Africa, Israel and Turkey
Competitive landscape Leading Companies, Market Positioning of Companies, Competitive Strategies, and Industry Risks

Request Free Sample

Research Analyst Overview

  • The THEIC market's value is fundamentally tied to its function as a critical chemical intermediate in high-performance applications. As a trifunctional cross-linking agent, tris(2-hydroxyethyl) isocyanurate imparts exceptional thermal stability and thermal endurance to thermosetting polymers, making it indispensable for polyester-imide wire enamels and polyamide-imide resins.
  • The unique triazine ring structure is central to creating magnet wire insulation that meets stringent thermal class ratings, such as class h insulation and class n insulation, which is crucial for modern electronics. The shift toward higher-voltage systems in electric vehicles has amplified the need for corona-resistant enamels, where high-purity theic helps achieve a 20% improvement in dielectric strength.
  • Boardroom decisions are now focused on securing the supply of this high-purity chemical intermediate to support these advanced applications, from heat-resistant printed circuit boards to potting compounds. The material's role in solder mask inks, flame retardant formulations, and as a pvc heat stabilizer further cements its industrial importance, despite the complexities of its chemical synthesis from precursors like cyanuric acid.

What are the Key Data Covered in this THEIC Market Research and Growth Report?

  • What is the expected growth of the THEIC Market between 2026 and 2030?

    • USD 93.7 million, at a CAGR of 5.9%

  • What segmentation does the market report cover?

    • The report is segmented by End-user (Paints and coatings, Pharmaceuticals, Wire manufacturing, and Others), Grade Type (Grade 1, and Grade 2), Application (Coatings, Wire enamel, Plastic and resins, and Others) and Geography (APAC, Europe, North America, South America, Middle East and Africa)

  • Which regions are analyzed in the report?

    • APAC, Europe, North America, South America and Middle East and Africa

  • What are the key growth drivers and market challenges?

    • Accelerated electrification of automotive sector, Volatility in raw material procurement and energy intensive synthesis

  • Who are the major players in the THEIC Market?

    • AK Scientific Inc., Alfa Chemistry, Ataman Kimya A.S, Haihang Industry Co. Ltd., Laffans Petrochemicals Ltd., LAVEEK ADDCHEM, Merck KGaA, Nantong Haotai Chemical Co.Ltd., Nissan Chemical Corp., Shandong Jianbang Co. Ltd., Shikoku Chemicals Corp., The Cleveland Clinic Foundation, Tokyo Chemical Co. Ltd., Toronto Research Chemicals and Wintersun International Inc.

Market Research Insights

  • The market's dynamics are shaped by the material's ability to deliver measurable performance enhancements in high-stress environments. The integration of THEIC into insulating varnishes has been shown to improve thermal endurance by up to 30%, directly extending the operational life of electric vehicle traction motors and wind turbine generators.
  • This improvement in durability translates to a more than 40% reduction in warranty claims related to insulation failure for some manufacturers. Furthermore, as the industry pursues grid modernization, the use of THEIC in high-efficiency distribution equipment contributes to a 5% reduction in transmission losses.
  • These outcomes underscore its value in applications where reliability is paramount, from automotive electrification to renewable energy infrastructure, driving its adoption despite challenges in material science innovation.

We can help! Our analysts can customize this theic market research report to meet your requirements.

Get in touch

1. Executive Summary

1.1 Market overview

Executive Summary - Chart on Market Overview
Executive Summary - Data Table on Market Overview
Executive Summary - Chart on Global Market Characteristics
Executive Summary - Chart on Market by Geography
Executive Summary - Chart on Market Segmentation by End-user
Executive Summary - Chart on Market Segmentation by Grade Type
Executive Summary - Chart on Market Segmentation by Application
Executive Summary - Chart on Incremental Growth
Executive Summary - Data Table on Incremental Growth
Executive Summary - Chart on Company Market Positioning

2. Technavio Analysis

2.1 Analysis of price sensitivity, lifecycle, customer purchase basket, adoption rates, and purchase criteria

2.2 Criticality of inputs and Factors of differentiation

Chart on Overview on criticality of inputs and factors of differentiation

2.3 Factors of disruption

Chart on Overview on factors of disruption

2.4 Impact of drivers and challenges

Chart on Impact of drivers and challenges in 2025 and 2030

3. Market Landscape

3.1 Market ecosystem

Chart on Parent Market
Data Table on - Parent Market

3.2 Market characteristics

Chart on Market characteristics analysis

3.3 Value chain analysis

Chart on Value chain analysis

4. Market Sizing

4.1 Market definition

Data Table on Offerings of companies included in the market definition

4.2 Market segment analysis

Market segments

4.3 Market size 2025

4.4 Market outlook: Forecast for 2025-2030

Chart on Global - Market size and forecast 2025-2030 ($ million)
Data Table on Global - Market size and forecast 2025-2030 ($ million)
Chart on Global Market: Year-over-year growth 2025-2030 (%)
Data Table on Global Market: Year-over-year growth 2025-2030 (%)

5. Historic Market Size

5.1 Global THEIC Market 2020 - 2024

Historic Market Size - Data Table on Global THEIC Market 2020 - 2024 ($ million)

5.2 End-user segment analysis 2020 - 2024

Historic Market Size - End-user Segment 2020 - 2024 ($ million)

5.3 Grade Type segment analysis 2020 - 2024

Historic Market Size - Grade Type Segment 2020 - 2024 ($ million)

5.4 Application segment analysis 2020 - 2024

Historic Market Size - Application Segment 2020 - 2024 ($ million)

5.5 Geography segment analysis 2020 - 2024

Historic Market Size - Geography Segment 2020 - 2024 ($ million)

5.6 Country segment analysis 2020 - 2024

Historic Market Size - Country Segment 2020 - 2024 ($ million)

6. Qualitative Analysis

6.1 Impact of AI in Global THEIC Market

7. Five Forces Analysis

7.1 Five forces summary

Five forces analysis - Comparison between 2025 and 2030

7.2 Bargaining power of buyers

Bargaining power of buyers - Impact of key factors 2025 and 2030

7.3 Bargaining power of suppliers

Bargaining power of suppliers - Impact of key factors in 2025 and 2030

7.4 Threat of new entrants

Threat of new entrants - Impact of key factors in 2025 and 2030

7.5 Threat of substitutes

Threat of substitutes - Impact of key factors in 2025 and 2030

7.6 Threat of rivalry

Threat of rivalry - Impact of key factors in 2025 and 2030

7.7 Market condition

Chart on Market condition - Five forces 2025 and 2030

8. Market Segmentation by End-user

8.1 Market segments

Chart on End-user - Market share 2025-2030 (%)
Data Table on End-user - Market share 2025-2030 (%)

8.2 Comparison by End-user

Chart on Comparison by End-user
Data Table on Comparison by End-user

8.3 Paints and coatings - Market size and forecast 2025-2030

Chart on Paints and coatings - Market size and forecast 2025-2030 ($ million)
Data Table on Paints and coatings - Market size and forecast 2025-2030 ($ million)
Chart on Paints and coatings - Year-over-year growth 2025-2030 (%)
Data Table on Paints and coatings - Year-over-year growth 2025-2030 (%)

8.4 Pharmaceuticals - Market size and forecast 2025-2030

Chart on Pharmaceuticals - Market size and forecast 2025-2030 ($ million)
Data Table on Pharmaceuticals - Market size and forecast 2025-2030 ($ million)
Chart on Pharmaceuticals - Year-over-year growth 2025-2030 (%)
Data Table on Pharmaceuticals - Year-over-year growth 2025-2030 (%)

8.5 Wire manufacturing - Market size and forecast 2025-2030

Chart on Wire manufacturing - Market size and forecast 2025-2030 ($ million)
Data Table on Wire manufacturing - Market size and forecast 2025-2030 ($ million)
Chart on Wire manufacturing - Year-over-year growth 2025-2030 (%)
Data Table on Wire manufacturing - Year-over-year growth 2025-2030 (%)

8.6 Others - Market size and forecast 2025-2030

Chart on Others - Market size and forecast 2025-2030 ($ million)
Data Table on Others - Market size and forecast 2025-2030 ($ million)
Chart on Others - Year-over-year growth 2025-2030 (%)
Data Table on Others - Year-over-year growth 2025-2030 (%)

8.7 Market opportunity by End-user

Market opportunity by End-user ($ million)
Data Table on Market opportunity by End-user ($ million)

9. Market Segmentation by Grade Type

9.1 Market segments

Chart on Grade Type - Market share 2025-2030 (%)
Data Table on Grade Type - Market share 2025-2030 (%)

9.2 Comparison by Grade Type

Chart on Comparison by Grade Type
Data Table on Comparison by Grade Type

9.3 Grade 1 - Market size and forecast 2025-2030

Chart on Grade 1 - Market size and forecast 2025-2030 ($ million)
Data Table on Grade 1 - Market size and forecast 2025-2030 ($ million)
Chart on Grade 1 - Year-over-year growth 2025-2030 (%)
Data Table on Grade 1 - Year-over-year growth 2025-2030 (%)

9.4 Grade 2 - Market size and forecast 2025-2030

Chart on Grade 2 - Market size and forecast 2025-2030 ($ million)
Data Table on Grade 2 - Market size and forecast 2025-2030 ($ million)
Chart on Grade 2 - Year-over-year growth 2025-2030 (%)
Data Table on Grade 2 - Year-over-year growth 2025-2030 (%)

9.5 Market opportunity by Grade Type

Market opportunity by Grade Type ($ million)
Data Table on Market opportunity by Grade Type ($ million)

10. Market Segmentation by Application

10.1 Market segments

Chart on Application - Market share 2025-2030 (%)
Data Table on Application - Market share 2025-2030 (%)

10.2 Comparison by Application

Chart on Comparison by Application
Data Table on Comparison by Application

10.3 Coatings - Market size and forecast 2025-2030

Chart on Coatings - Market size and forecast 2025-2030 ($ million)
Data Table on Coatings - Market size and forecast 2025-2030 ($ million)
Chart on Coatings - Year-over-year growth 2025-2030 (%)
Data Table on Coatings - Year-over-year growth 2025-2030 (%)

10.4 Wire enamel - Market size and forecast 2025-2030

Chart on Wire enamel - Market size and forecast 2025-2030 ($ million)
Data Table on Wire enamel - Market size and forecast 2025-2030 ($ million)
Chart on Wire enamel - Year-over-year growth 2025-2030 (%)
Data Table on Wire enamel - Year-over-year growth 2025-2030 (%)

10.5 Plastic and resins - Market size and forecast 2025-2030

Chart on Plastic and resins - Market size and forecast 2025-2030 ($ million)
Data Table on Plastic and resins - Market size and forecast 2025-2030 ($ million)
Chart on Plastic and resins - Year-over-year growth 2025-2030 (%)
Data Table on Plastic and resins - Year-over-year growth 2025-2030 (%)

10.6 Others - Market size and forecast 2025-2030

Chart on Others - Market size and forecast 2025-2030 ($ million)
Data Table on Others - Market size and forecast 2025-2030 ($ million)
Chart on Others - Year-over-year growth 2025-2030 (%)
Data Table on Others - Year-over-year growth 2025-2030 (%)

10.7 Market opportunity by Application

Market opportunity by Application ($ million)
Data Table on Market opportunity by Application ($ million)

11. Customer Landscape

11.1 Customer landscape overview

Analysis of price sensitivity, lifecycle, customer purchase basket, adoption rates, and purchase criteria

12. Geographic Landscape

12.1 Geographic segmentation

Chart on Market share by geography 2025-2030 (%)
Data Table on Market share by geography 2025-2030 (%)

12.2 Geographic comparison

Chart on Geographic comparison
Data Table on Geographic comparison

12.3 APAC - Market size and forecast 2025-2030

Chart on APAC - Market size and forecast 2025-2030 ($ million)
Data Table on APAC - Market size and forecast 2025-2030 ($ million)
Chart on APAC - Year-over-year growth 2025-2030 (%)
Data Table on APAC - Year-over-year growth 2025-2030 (%)
Chart on Regional Comparison - APAC
Data Table on Regional Comparison - APAC

12.3.1 China - Market size and forecast 2025-2030

Chart on China - Market size and forecast 2025-2030 ($ million)
Data Table on China - Market size and forecast 2025-2030 ($ million)
Chart on China - Year-over-year growth 2025-2030 (%)
Data Table on China - Year-over-year growth 2025-2030 (%)

12.3.2 Japan - Market size and forecast 2025-2030

Chart on Japan - Market size and forecast 2025-2030 ($ million)
Data Table on Japan - Market size and forecast 2025-2030 ($ million)
Chart on Japan - Year-over-year growth 2025-2030 (%)
Data Table on Japan - Year-over-year growth 2025-2030 (%)

12.3.3 South Korea - Market size and forecast 2025-2030

Chart on South Korea - Market size and forecast 2025-2030 ($ million)
Data Table on South Korea - Market size and forecast 2025-2030 ($ million)
Chart on South Korea - Year-over-year growth 2025-2030 (%)
Data Table on South Korea - Year-over-year growth 2025-2030 (%)

12.3.4 India - Market size and forecast 2025-2030

Chart on India - Market size and forecast 2025-2030 ($ million)
Data Table on India - Market size and forecast 2025-2030 ($ million)
Chart on India - Year-over-year growth 2025-2030 (%)
Data Table on India - Year-over-year growth 2025-2030 (%)

12.3.5 Australia - Market size and forecast 2025-2030

Chart on Australia - Market size and forecast 2025-2030 ($ million)
Data Table on Australia - Market size and forecast 2025-2030 ($ million)
Chart on Australia - Year-over-year growth 2025-2030 (%)
Data Table on Australia - Year-over-year growth 2025-2030 (%)

12.3.6 Indonesia - Market size and forecast 2025-2030

Chart on Indonesia - Market size and forecast 2025-2030 ($ million)
Data Table on Indonesia - Market size and forecast 2025-2030 ($ million)
Chart on Indonesia - Year-over-year growth 2025-2030 (%)
Data Table on Indonesia - Year-over-year growth 2025-2030 (%)

12.4 Europe - Market size and forecast 2025-2030

Chart on Europe - Market size and forecast 2025-2030 ($ million)
Data Table on Europe - Market size and forecast 2025-2030 ($ million)
Chart on Europe - Year-over-year growth 2025-2030 (%)
Data Table on Europe - Year-over-year growth 2025-2030 (%)
Chart on Regional Comparison - Europe
Data Table on Regional Comparison - Europe

12.4.1 Germany - Market size and forecast 2025-2030

Chart on Germany - Market size and forecast 2025-2030 ($ million)
Data Table on Germany - Market size and forecast 2025-2030 ($ million)
Chart on Germany - Year-over-year growth 2025-2030 (%)
Data Table on Germany - Year-over-year growth 2025-2030 (%)

12.4.2 UK - Market size and forecast 2025-2030

Chart on UK - Market size and forecast 2025-2030 ($ million)
Data Table on UK - Market size and forecast 2025-2030 ($ million)
Chart on UK - Year-over-year growth 2025-2030 (%)
Data Table on UK - Year-over-year growth 2025-2030 (%)

12.4.3 France - Market size and forecast 2025-2030

Chart on France - Market size and forecast 2025-2030 ($ million)
Data Table on France - Market size and forecast 2025-2030 ($ million)
Chart on France - Year-over-year growth 2025-2030 (%)
Data Table on France - Year-over-year growth 2025-2030 (%)

12.4.4 Italy - Market size and forecast 2025-2030

Chart on Italy - Market size and forecast 2025-2030 ($ million)
Data Table on Italy - Market size and forecast 2025-2030 ($ million)
Chart on Italy - Year-over-year growth 2025-2030 (%)
Data Table on Italy - Year-over-year growth 2025-2030 (%)

12.4.5 The Netherlands - Market size and forecast 2025-2030

Chart on The Netherlands - Market size and forecast 2025-2030 ($ million)
Data Table on The Netherlands - Market size and forecast 2025-2030 ($ million)
Chart on The Netherlands - Year-over-year growth 2025-2030 (%)
Data Table on The Netherlands - Year-over-year growth 2025-2030 (%)

12.4.6 Spain - Market size and forecast 2025-2030

Chart on Spain - Market size and forecast 2025-2030 ($ million)
Data Table on Spain - Market size and forecast 2025-2030 ($ million)
Chart on Spain - Year-over-year growth 2025-2030 (%)
Data Table on Spain - Year-over-year growth 2025-2030 (%)

12.5 North America - Market size and forecast 2025-2030

Chart on North America - Market size and forecast 2025-2030 ($ million)
Data Table on North America - Market size and forecast 2025-2030 ($ million)
Chart on North America - Year-over-year growth 2025-2030 (%)
Data Table on North America - Year-over-year growth 2025-2030 (%)
Chart on Regional Comparison - North America
Data Table on Regional Comparison - North America

12.5.1 US - Market size and forecast 2025-2030

Chart on US - Market size and forecast 2025-2030 ($ million)
Data Table on US - Market size and forecast 2025-2030 ($ million)
Chart on US - Year-over-year growth 2025-2030 (%)
Data Table on US - Year-over-year growth 2025-2030 (%)

12.5.2 Canada - Market size and forecast 2025-2030

Chart on Canada - Market size and forecast 2025-2030 ($ million)
Data Table on Canada - Market size and forecast 2025-2030 ($ million)
Chart on Canada - Year-over-year growth 2025-2030 (%)
Data Table on Canada - Year-over-year growth 2025-2030 (%)

12.5.3 Mexico - Market size and forecast 2025-2030

Chart on Mexico - Market size and forecast 2025-2030 ($ million)
Data Table on Mexico - Market size and forecast 2025-2030 ($ million)
Chart on Mexico - Year-over-year growth 2025-2030 (%)
Data Table on Mexico - Year-over-year growth 2025-2030 (%)

12.6 South America - Market size and forecast 2025-2030

Chart on South America - Market size and forecast 2025-2030 ($ million)
Data Table on South America - Market size and forecast 2025-2030 ($ million)
Chart on South America - Year-over-year growth 2025-2030 (%)
Data Table on South America - Year-over-year growth 2025-2030 (%)
Chart on Regional Comparison - South America
Data Table on Regional Comparison - South America

12.6.1 Brazil - Market size and forecast 2025-2030

Chart on Brazil - Market size and forecast 2025-2030 ($ million)
Data Table on Brazil - Market size and forecast 2025-2030 ($ million)
Chart on Brazil - Year-over-year growth 2025-2030 (%)
Data Table on Brazil - Year-over-year growth 2025-2030 (%)

12.6.2 Argentina - Market size and forecast 2025-2030

Chart on Argentina - Market size and forecast 2025-2030 ($ million)
Data Table on Argentina - Market size and forecast 2025-2030 ($ million)
Chart on Argentina - Year-over-year growth 2025-2030 (%)
Data Table on Argentina - Year-over-year growth 2025-2030 (%)

12.6.3 Colombia - Market size and forecast 2025-2030

Chart on Colombia - Market size and forecast 2025-2030 ($ million)
Data Table on Colombia - Market size and forecast 2025-2030 ($ million)
Chart on Colombia - Year-over-year growth 2025-2030 (%)
Data Table on Colombia - Year-over-year growth 2025-2030 (%)

12.7 Middle East and Africa - Market size and forecast 2025-2030

Chart on Middle East and Africa - Market size and forecast 2025-2030 ($ million)
Data Table on Middle East and Africa - Market size and forecast 2025-2030 ($ million)
Chart on Middle East and Africa - Year-over-year growth 2025-2030 (%)
Data Table on Middle East and Africa - Year-over-year growth 2025-2030 (%)
Chart on Regional Comparison - Middle East and Africa
Data Table on Regional Comparison - Middle East and Africa

12.7.1 Saudi Arabia - Market size and forecast 2025-2030

Chart on Saudi Arabia - Market size and forecast 2025-2030 ($ million)
Data Table on Saudi Arabia - Market size and forecast 2025-2030 ($ million)
Chart on Saudi Arabia - Year-over-year growth 2025-2030 (%)
Data Table on Saudi Arabia - Year-over-year growth 2025-2030 (%)

12.7.2 UAE - Market size and forecast 2025-2030

Chart on UAE - Market size and forecast 2025-2030 ($ million)
Data Table on UAE - Market size and forecast 2025-2030 ($ million)
Chart on UAE - Year-over-year growth 2025-2030 (%)
Data Table on UAE - Year-over-year growth 2025-2030 (%)

12.7.3 South Africa - Market size and forecast 2025-2030

Chart on South Africa - Market size and forecast 2025-2030 ($ million)
Data Table on South Africa - Market size and forecast 2025-2030 ($ million)
Chart on South Africa - Year-over-year growth 2025-2030 (%)
Data Table on South Africa - Year-over-year growth 2025-2030 (%)

12.7.4 Israel - Market size and forecast 2025-2030

Chart on Israel - Market size and forecast 2025-2030 ($ million)
Data Table on Israel - Market size and forecast 2025-2030 ($ million)
Chart on Israel - Year-over-year growth 2025-2030 (%)
Data Table on Israel - Year-over-year growth 2025-2030 (%)

12.7.5 Turkey - Market size and forecast 2025-2030

Chart on Turkey - Market size and forecast 2025-2030 ($ million)
Data Table on Turkey - Market size and forecast 2025-2030 ($ million)
Chart on Turkey - Year-over-year growth 2025-2030 (%)
Data Table on Turkey - Year-over-year growth 2025-2030 (%)

12.8 Market opportunity by geography

Market opportunity by geography ($ million)
Data Tables on Market opportunity by geography ($ million)

13. Drivers, Challenges, and Opportunity

13.1 Market drivers

Accelerated electrification of automotive sector
Expansion of renewable energy and grid modernization
Technological advancements in electrical and electronic devices

13.2 Market challenges

Volatility in raw material procurement and energy intensive synthesis
Stringent regulatory compliance and environmental safety standards
Emergence of substitute technologies and alternative insulation materials

13.3 Impact of drivers and challenges

Impact of drivers and challenges in 2025 and 2030

13.4 Market opportunities

Transition to high-voltage insulation systems for electric mobility
Adoption of sustainable and low-VOC coating technologies
Miniaturization and power density increases in renewable energy electronics

14. Competitive Landscape

14.1 Overview

14.2

Overview on criticality of inputs and factors of differentiation

14.3 Landscape disruption

Overview on factors of disruption

14.4 Industry risks

Impact of key risks on business

15. Competitive Analysis

15.1 Companies profiled

Companies covered

15.2 Company ranking index

15.3 Market positioning of companies

Matrix on companies position and classification

15.4 AK Scientific Inc.

AK Scientific Inc. - Overview
AK Scientific Inc. - Product / Service
AK Scientific Inc. - Key offerings
SWOT

15.5 Alfa Chemistry

Alfa Chemistry - Overview
Alfa Chemistry - Product / Service
Alfa Chemistry - Key offerings
SWOT

15.6 Ataman Kimya A.S

Ataman Kimya A.S - Overview
Ataman Kimya A.S - Product / Service
Ataman Kimya A.S - Key offerings
SWOT

15.7 Haihang Industry Co. Ltd.

Haihang Industry Co. Ltd. - Overview
Haihang Industry Co. Ltd. - Product / Service
Haihang Industry Co. Ltd. - Key offerings
SWOT

15.8 Laffans Petrochemicals Ltd.

Laffans Petrochemicals Ltd. - Overview
Laffans Petrochemicals Ltd. - Product / Service
Laffans Petrochemicals Ltd. - Key offerings
SWOT

15.9 LAVEEK ADDCHEM

LAVEEK ADDCHEM - Overview
LAVEEK ADDCHEM - Product / Service
LAVEEK ADDCHEM - Key offerings
SWOT

15.10 Merck KGaA

Merck KGaA - Overview
Merck KGaA - Business segments
Merck KGaA - Key news
Merck KGaA - Key offerings
Merck KGaA - Segment focus
SWOT

15.11 Nantong Haotai Chemical Co.Ltd.

Nantong Haotai Chemical Co.Ltd. - Overview
Nantong Haotai Chemical Co.Ltd. - Product / Service
Nantong Haotai Chemical Co.Ltd. - Key offerings
SWOT

15.12 Nissan Chemical Corp.

Nissan Chemical Corp. - Overview
Nissan Chemical Corp. - Business segments
Nissan Chemical Corp. - Key offerings
Nissan Chemical Corp. - Segment focus
SWOT

15.13 Shandong Jianbang Co. Ltd.

Shandong Jianbang Co. Ltd. - Overview
Shandong Jianbang Co. Ltd. - Product / Service
Shandong Jianbang Co. Ltd. - Key offerings
SWOT

15.14 Shikoku Chemicals Corp.

Shikoku Chemicals Corp. - Overview
Shikoku Chemicals Corp. - Business segments
Shikoku Chemicals Corp. - Key offerings
Shikoku Chemicals Corp. - Segment focus
SWOT

15.15 The Cleveland Clinic Foundation

The Cleveland Clinic Foundation - Overview
The Cleveland Clinic Foundation - Product / Service
The Cleveland Clinic Foundation - Key offerings
SWOT

15.16 Tokyo Chemical Co. Ltd.

Tokyo Chemical Co. Ltd. - Overview
Tokyo Chemical Co. Ltd. - Product / Service
Tokyo Chemical Co. Ltd. - Key offerings
SWOT

15.17 Toronto Research Chemicals

Toronto Research Chemicals - Overview
Toronto Research Chemicals - Product / Service
Toronto Research Chemicals - Key offerings
SWOT

15.18 Wintersun International Inc.

Wintersun International Inc. - Overview
Wintersun International Inc. - Product / Service
Wintersun International Inc. - Key offerings
SWOT

16. Appendix

16.1 Scope of the report

Market definition
Objectives
Notes and caveats

16.2 Inclusions and exclusions checklist

Inclusions checklist
Exclusions checklist

16.3 Currency conversion rates for US$

16.4 Research methodology

16.5 Data procurement

Information sources

16.6 Data validation

16.7 Validation techniques employed for market sizing

16.8 Data synthesis

16.9 360 degree market analysis

16.10 List of abbreviations

Research Methodology

Technavio presents a detailed picture of the market by way of study, synthesis, and summation of data from multiple sources. The analysts have presented the various facets of the market with a particular focus on identifying the key industry influencers. The data thus presented is comprehensive, reliable, and the result of extensive research, both primary and secondary.

INFORMATION SOURCES

Primary sources

  • Manufacturers and suppliers
  • Channel partners
  • Industry experts
  • Strategic decision makers

Secondary sources

  • Industry journals and periodicals
  • Government data
  • Financial reports of key industry players
  • Historical data
  • Press releases

DATA ANALYSIS

Data Synthesis

  • Collation of data
  • Estimation of key figures
  • Analysis of derived insights

Data Validation

  • Triangulation with data models
  • Reference against proprietary databases
  • Corroboration with industry experts

REPORT WRITING

Qualitative

  • Market drivers
  • Market challenges
  • Market trends
  • Five forces analysis

Quantitative

  • Market size and forecast
  • Market segmentation
  • Geographical insights
  • Competitive landscape

Interested in this report?

Get your sample now to see our research methodology and insights!

Download Now

Frequently Asked Questions

THEIC market growth will increase by USD 93.7 million during 2026-2030.

The THEIC market is expected to grow at a CAGR of 5.9% during 2026-2030.

THEIC market is segmented by End-user (Paints and coatings, Pharmaceuticals, Wire manufacturing, Others) Grade type (Grade 1, Grade 2) Application (Coatings, Wire enamel, Plastic and resins, Others)

AK Scientific Inc., Alfa Chemistry, Ataman Kimya A.S, Haihang Industry Co. Ltd., Laffans Petrochemicals Ltd., LAVEEK ADDCHEM, Merck KGaA, Nantong Haotai Chemical Co.Ltd., Nissan Chemical Corp., Shandong Jianbang Co. Ltd., Shikoku Chemicals Corp., The Cleveland Clinic Foundation, Tokyo Chemical Co. Ltd., Toronto Research Chemicals, Wintersun International Inc. are a few of the key vendors in the THEIC market.

APAC will register the highest growth rate of 46.2% among the other regions. Therefore, the THEIC market in APAC is expected to garner significant business opportunities for the vendors during the forecast period.

China, Japan, South Korea, India, Australia, Indonesia, Germany, UK, France, Italy, The Netherlands, Spain, US, Canada, Mexico, Brazil, Argentina, Colombia, Saudi Arabia, UAE, South Africa, Israel, Turkey

  • Accelerated electrification of automotive sector is the driving factor this market.

The THEIC market vendors should focus on grabbing business opportunities from the End-user segment as it accounted for the largest market share in the base year.