Tanker Shipping Market Analysis, Size, and Forecast 2025-2029: North America (US), Europe (Germany, Greece, Norway, Switzerland, and UK), APAC (China, Japan, Singapore, and South Korea), and Rest of World (ROW)

Tanker Shipping Market Analysis, Size, and Forecast 2025-2029:
North America (US), Europe (Germany, Greece, Norway, Switzerland, and UK), APAC (China, Japan, Singapore, and South Korea), and Rest of World (ROW)

Published: Jun 2025 231 Pages SKU: IRTNTR73096

Market Overview at a Glance

$19.95 B
Market Opportunity
8.9%
CAGR
7.5
YoY growth 2024-2025(%)

Tanker Shipping Market Size 2025-2029

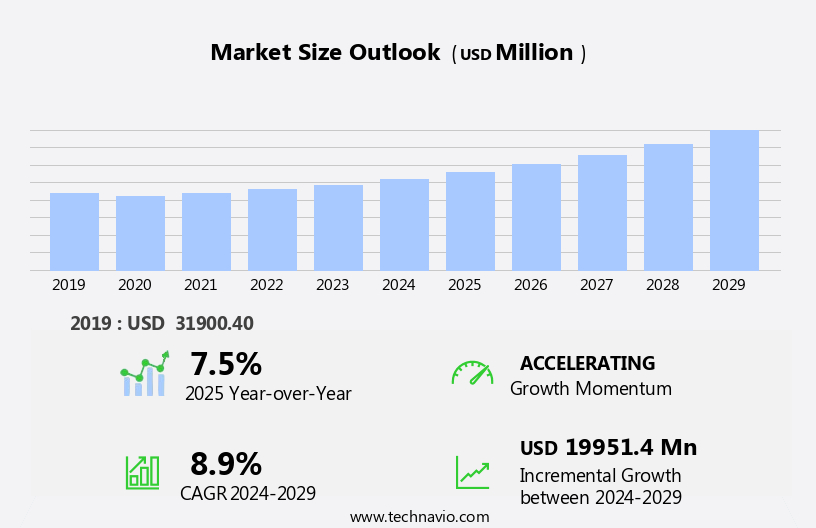
The tanker shipping market size is forecast to increase by USD 19.95 billion, at a CAGR of 8.9% between 2024 and 2029.

  • The market is shaped by two significant drivers: the global oil and gas demand and the shift towards sustainability. The ever-increasing demand for oil and gas is fueling the growth of the market, as these commodities remain the backbone of the global energy sector. However, this trend is not without challenges. Environmental regulations and compliance costs pose substantial obstacles for market participants. Stricter environmental regulations, such as the International Maritime Organization's (IMO) sulfur cap, are driving up costs for tanker shipping companies. These regulations require vessels to comply with stringent emissions standards, necessitating significant investments in new technologies and infrastructure.
  • Moreover, the growing emphasis on sustainability and the transition to renewable energy sources may further impact the market's future trajectory. Companies must navigate these challenges while also capitalizing on opportunities presented by the ongoing demand for oil and gas. To stay competitive, they must invest in eco-friendly technologies and innovative solutions that enable efficient and sustainable operations.

What will be the Size of the Tanker Shipping Market during the forecast period?

Tanker Shipping Market Size

Explore in-depth regional segment analysis with market size data - historical 2019-2023 and forecasts 2025-2029 - in the full report.  
Request Free Sample

The market continues to evolve, shaped by a complex interplay of factors. Double hull technology, a response to environmental concerns, has become the industry standard, while navigation systems ensure safe and efficient voyages. Economic indicators, such as oil prices and freight rates, influence fleet management decisions. Environmental impact, a growing concern, is addressed through initiatives like sustainable shipping and the use of alternative fuels. Ocean currents and weather routing impact trade routes, with canal transit offering shorter but riskier alternatives. Hull cleaning and tank cleaning are essential for maintaining vessel performance and safety. The size and type of tankers, from single hull to double hull, vary based on the cargo being transported, such as crude oil or iron ore.

IMO regulations shape the industry, with a focus on fuel efficiency, ballast water management, and crew management. Port security is paramount, with the risk of piracy and terrorism ever present. Ship recycling, a critical aspect of the industry's sustainability, is subject to increasing scrutiny. Economic indicators, such as oil prices and voyage charters, influence the market's dynamics. Cargo handling and time charters impact fleet utilization, while IOT sensors and bunker fuel efficiency initiatives shape the future of the industry. The ongoing unfolding of these patterns underscores the continuous nature of market activities in the tanker shipping sector.

How is this Tanker Shipping Industry segmented?

The tanker shipping industry research report provides comprehensive data (region-wise segment analysis), with forecasts and estimates in "USD million" for the period 2025-2029, as well as historical data from 2019-2023 for the following segments.

  • Type
    • Oil tankers
    • Liquid gas tankers
    • Chemical tankers
  • Mode Of Transportation
    • Deep sea
    • Coastal
    • In-land
  • Product Type
    • VLCC and ULCC
    • Suezmax
    • Aframax
    • Others
  • Tanker Type
    • Crude Oil Tankers
    • Product Tankers
    • Chemical Tankers
    • LNG Tankers
  • Service Time
    • Spot Market
    • Time Charter
    • Contract of Affreightment
  • Geography
    • North America
      • US
    • Europe
      • Germany
      • Greece
      • Norway
      • Switzerland
      • UK
    • APAC
      • China
      • Japan
      • Singapore
      • South Korea
    • Rest of World (ROW)

    By Type Insights

    The oil tankers segment is estimated to witness significant growth during the forecast period.

    The oil tanker market plays a pivotal role in the global energy sector, enabling the transportation of crude oil and petroleum products across vast maritime expanses. Tankers are classified based on their cargo and carrying capacity, with crude oil tankers and product tankers being the primary categories. Crude oil tankers are engineered for the transportation of unrefined oil from extraction sites to refineries. Among these, Very Large Crude Carriers (VLCCs), boasting a deadweight tonnage of 200,000 to 320,000, dominate long-haul crude shipping. Product tankers, on the other hand, are designed to transport refined petroleum products, such as gasoline, diesel, and jet fuel, to markets worldwide.

    The intricacies of tanker shipping involve various factors, including port congestion, shipping lanes, bill of lading, ocean currents, trade routes, canal transit, hull cleaning, and fleet management. Regulations from the International Maritime Organization (IMO) govern the industry, influencing aspects like tank cleaning, fuel efficiency, ballast water management, and environmental impact. Crude oil prices, voyage charters, cargo handling, weather routing, and carbon footprint are critical economic indicators that impact the market. Fuel efficiency, risk management, and charter rates are essential factors in tanker fleet management. Alternative fuels, such as liquefied natural gas (LNG) and biofuels, are gaining traction as sustainable shipping solutions.

    IoT sensors, bunker fuel, and petroleum products are integral components of tanker operations. Crew management, double hull, navigation systems, port security, ship recycling, and single hull tankers are other significant aspects of the market. Iron ore and other dry bulk commodities often travel via tankers, contributing to the market's diversity. The market's dynamics are influenced by economic indicators, weather conditions, and geopolitical factors. In the realm of tanker shipping, adaptability and innovation are key to navigating the complexities of this vital sector.

    Tanker Shipping Market Size

    Request Free Sample

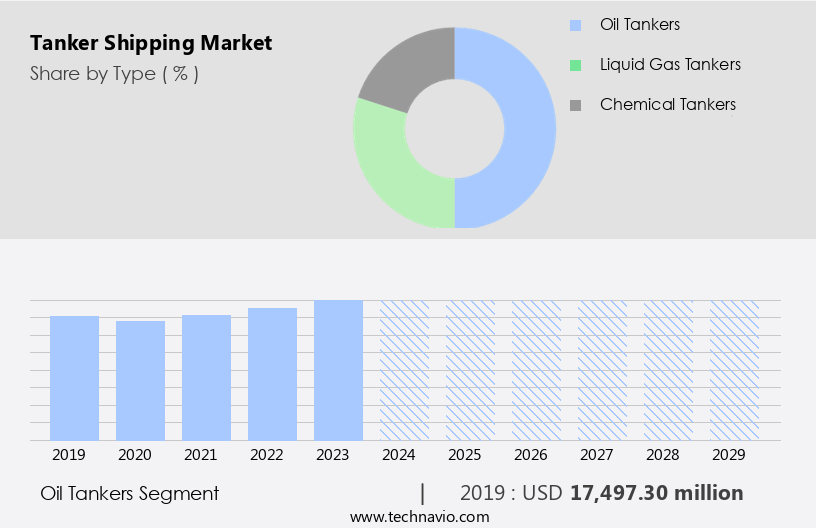
    The Oil tankers segment was valued at USD 17.5 billion in 2019 and showed a gradual increase during the forecast period.

    Regional Analysis

    APAC is estimated to contribute 50% to the growth of the global market during the forecast period.Technavio’s analysts have elaborately explained the regional trends and drivers that shape the market during the forecast period.

    Tanker Shipping Market Share by Geography

     Request Free Sample

    The Asia-Pacific (APAC) region is the leading player in The market due to its role as the world's largest importer of crude oil and an emerging exporter of refined petroleum products. This dominance is fueled by the region's rapid industrialization, urbanization, and escalating energy demands, particularly in major economies like China, India, Japan, and South Korea. Key maritime hubs, such as Singapore, Ulsan, Qingdao, and Jamnagar, serve as crucial nodes in this intricate energy logistics network. China, the world's top oil importer, epitomizes the immense energy demand in APAC. In 2024, China's domestic crude oil production averaged 4 million barrels per day.

    Port congestion and shipping lane traffic are persistent challenges in this market, necessitating efficient fleet management and weather routing to minimize delays. Tanker types, including crude oil, product tankers, and bulk carriers, navigate through ocean currents and trade routes, adhering to International Maritime Organization (IMO) regulations. Hull cleaning and tank cleaning are essential maintenance practices to ensure the safe and efficient operation of tankers. IMO regulations, oil prices, and voyage charters influence the market dynamics, while cargo handling and ballast water management are crucial aspects of tanker operations. The adoption of alternative fuels, such as liquefied natural gas (LNG) and biofuels, is gaining momentum to reduce the carbon footprint of tanker shipping.

    The size of tankers varies, with larger vessels offering increased fuel efficiency and economies of scale. Sustainable shipping initiatives, such as fuel efficiency improvements and risk management, are essential to mitigate environmental impact and ensure the long-term viability of the tanker shipping industry. Time charters and freight rates are crucial economic indicators, while IoT sensors, bunker fuel, and petroleum products are integral components of tanker operations. Crew management, double hulls, navigation systems, and environmental impact assessments are also essential considerations for tanker fleet owners and operators. Iron ore and other dry bulk commodities are transported in tankers, contributing to the market's diversity.

    Ballast water management regulations aim to prevent the spread of invasive species, while ship recycling and single hull tankers are topics of ongoing debate in the industry. Port security and supply chain efficiency are critical factors in ensuring the smooth operation of the market.

    Market Dynamics

    Our researchers analyzed the data with 2024 as the base year, along with the key drivers, trends, and challenges. A holistic analysis of drivers will help companies refine their marketing strategies to gain a competitive advantage.

    In the dynamic and complex world of global trade, the market plays a vital role in transporting essential commodities such as crude oil, liquefied natural gas, and petroleum products. This sector is characterized by advanced technologies, stringent safety regulations, and a diverse workforce. Tanker vessels, including Very Large Crude Carriers (VLCCs), Suezmaxes, and product tankers, navigate the world's waterways, ensuring the smooth flow of energy supplies. The market is influenced by various factors, including supply and demand, freight rates, fleet size, and geopolitical risks. Tanker shipping companies invest in research and development to optimize fuel efficiency, reduce emissions, and enhance safety. This industry's future looks promising, driven by growing energy demand and the ongoing shift towards cleaner energy sources.

    What are the key market drivers leading to the rise in the adoption of Tanker Shipping Industry?

    • Global oil and gas demand serves as the primary driver for market trends in this sector. 

    • The market is driven by the continued demand for oil and gas, with crude oil, refined products, and liquefied natural gas (LNG) being transported on a large scale. This need is particularly significant in emerging economies. The global oil consumption grew by around 0.8 million barrels per day in 2024, reaching a total of 103.9 million barrels per day, primarily due to the increasing demand for petrochemical feedstocks and a modest recovery in transportation fuels. Tanker types, including oil, chemical, and LNG carriers, play a crucial role in meeting this demand. IMO regulations, such as those related to safety and environmental sustainability, influence the market.
    • Cargo handling, weather routing, and carbon footprint are essential considerations in the sector. Deadweight tonnage, a key metric for tanker capacity, continues to evolve with technological advancements. Sustainable shipping practices, including the use of renewable energy and the reduction of emissions, are gaining importance. Voyage charters and route optimization strategies are essential for tanker operators to maximize efficiency and profitability.

    What are the market trends shaping the Tanker Shipping Industry?

    • The trend in the market is moving towards sustainability. As a professional, it is essential to acknowledge and adapt to this shift in consumer preferences.

    • The market is undergoing significant changes as stakeholders prioritize sustainability and operational efficiency. Regulatory pressures, technological innovations, and corporate environmental strategies are driving the adoption of cleaner technologies and alternative fuels. In a recent development, Scorpio Tankers Inc. Announced a non-binding Memorandum of Understanding to implement FOWE Eco Solutions fuel emulsion systems on its fleet of 111 product tankers. This initiative aims to reduce fuel consumption by at least 3% and cut carbon emissions by approximately 100,000 tons annually. The Cavitech technology used in the system enhances combustion efficiency and reduces greenhouse gas output without requiring substantial upfront capital or operational disruptions.
    • The supply chain in tanker shipping is also being transformed by advancements in IoT sensors, ballast water management systems, and crew management tools. Time charters are increasingly incorporating sustainability clauses, and bunker fuel specifications are evolving to include alternative fuels like LNG and biofuels. The market is expected to continue adapting to these trends, ensuring a more sustainable and efficient future for the industry.

    What challenges does the Tanker Shipping Industry face during its growth?

    • The growth of the industry is significantly impacted by the environmental regulations and ensuing compliance costs. 

    • The market faces significant regulatory challenges as environmental concerns continue to shape industry operations. The International Maritime Organization (IMO) and regional authorities have introduced stringent measures to reduce emissions, promote cleaner fuels, and ensure long-term sustainability. One such regulation, the IMO 2020 sulfur cap, limits the sulfur content in marine fuel to 0.5%. This regulation, while essential for climate goals, comes with substantial financial and operational costs for tanker owners and operators. Another critical area of focus is the implementation of advanced navigation systems and double hull tankers to improve safety and reduce the environmental impact of tanker shipping.
    • Fuel efficiency and ship recycling are also key economic indicators that are gaining importance in the market. Port security remains a top priority, with increasing investment in technologies and infrastructure to mitigate risks. Risk management is a crucial aspect of tanker shipping, with single hull vessels being phased out due to their higher risk profile. The market is also witnessing a shift towards iron ore as a primary cargo due to its high demand and the need for larger vessels to transport it efficiently. Overall, the market is undergoing significant changes as it adapts to regulatory requirements, technological advancements, and changing market dynamics.

    Exclusive Customer Landscape

    The tanker shipping market forecasting report includes the adoption lifecycle of the market, covering from the innovator’s stage to the laggard’s stage. It focuses on adoption rates in different regions based on penetration. Furthermore, the tanker shipping market report also includes key purchase criteria and drivers of price sensitivity to help companies evaluate and develop their market growth analysis strategies.

    Tanker Shipping Market Share by Geography

     Customer Landscape

    Key Companies & Market Insights

    Companies are implementing various strategies, such as strategic alliances, tanker shipping market forecast, partnerships, mergers and acquisitions, geographical expansion, and product/service launches, to enhance their presence in the industry.

    Bahri - Tanker shipping services optimize safety, quality, and cost-effectiveness through innovative methods, ensuring superior records in the industry. Our solutions prioritize vessel security, cargo integrity, and efficient operations, delivering trusted logistics solutions for global clients.

    The industry research and growth report includes detailed analyses of the competitive landscape of the market and information about key companies, including:

    • Bahri
    • BW Group
    • CMB.TECH NV
    • COSCO Shipping Ports Ltd.
    • DHT Holdings Inc.
    • Eastern Pacific Shipping
    • Frontline plc
    • IINO Kaiun Kaisha Ltd.
    • INTERNATIONAL SEAWAYS INC.
    • MAERSK TANKERS AS
    • Mitsui O.S.K. Lines Ltd.
    • Navios Maritime Holdings Inc.
    • Odfjell SE
    • Scorpio Tankers Inc.
    • SFL Corp. Ltd.
    • Stolt Nielsen Ltd.
    • Teekay Corp.
    • TORM plc
    • Tsakos Energy Navigation Ltd.

    Qualitative and quantitative analysis of companies has been conducted to help clients understand the wider business environment as well as the strengths and weaknesses of key industry players. Data is qualitatively analyzed to categorize companies as pure play, category-focused, industry-focused, and diversified; it is quantitatively analyzed to categorize companies as dominant, leading, strong, tentative, and weak.

    Recent Development and News in Tanker Shipping Market

    • In January 2024, Maersk Tankers, a leading player in the market, announced the launch of its new Very Large Crude Carrier (VLCC), the "Maersk Tindir," at the Hyundai Heavy Industries shipyard in South Korea. This vessel, the largest in Maersk's fleet, is designed to reduce carbon emissions by 10% through optimization of hull design and engine efficiency (Maersk press release, 2024).
    • In March 2024, Teekay Tankers and Frontline Ltd., two major tanker shipping companies, announced their merger, creating the world's largest independent crude tanker fleet. The combined entity, named Teekay Frontier, will have a fleet of 150 vessels and a market capitalization of approximately USD3.5 billion (Bloomberg, 2024).
    • In May 2024, the International Maritime Organization (IMO) approved the Carbon Intensity Indicator (CII) regulation, which sets a mandatory annual improvement target for the carbon intensity of ships starting from 2023. This regulation aims to reduce the carbon intensity of the shipping sector by 40% by 2030 (IMO press release, 2024).
    • In February 2025, Shell and TotalEnergies signed a strategic partnership to jointly develop and operate a fleet of 12 large liquefied natural gas (LNG) tankers. This collaboration is expected to reduce their carbon footprint by 15% through the use of advanced technologies like LNG as a fuel and energy recovery systems (Shell press release, 2025).

    Research Analyst Overview

    • In the dynamic world of tanker shipping, crude oil and product tankers play pivotal roles. Smart shipping technologies, such as blockchain and digital twins, are revolutionizing operations, enhancing hull performance, and ensuring cargo tracking and safety management systems. Oil majors are embracing low-sulfur fuel oil and engine technology to reduce air pollution, while weather forecasting and route optimization improve fuel efficiency. Product tankers face challenges with cargo insurance due to the risks of oil spills and water pollution. LPG carriers and LNG carriers are also adapting, integrating anti-fouling systems and noise pollution prevention measures. Classification societies and maritime insurance companies are key players in ensuring safety and environmental regulations are met.
    • Freight forwarders and port operations leverage vessel tracking and trade finance to optimize logistics. Marine ecology remains a priority, with pollution prevention efforts ongoing. Autonomous ships and hull optimization are future trends, as is the integration of waste management and crew training.

    Dive into Technavio’s robust research methodology, blending expert interviews, extensive data synthesis, and validated models for unparalleled Tanker Shipping Market insights. See full methodology.

    Market Scope

    Report Coverage

    Details

    Page number

    231

    Base year

    2024

    Historic period

    2019-2023

    Forecast period

    2025-2029

    Growth momentum & CAGR

    Accelerate at a CAGR of 8.9%

    Market growth 2025-2029

    USD 19951.4 million

    Market structure

    Fragmented

    YoY growth 2024-2025(%)

    7.5

    Key countries

    China, Japan, US, Greece, Singapore, South Korea, Norway, Germany, Switzerland, and UK

    Competitive landscape

    Leading Companies, Market Positioning of Companies, Competitive Strategies, and Industry Risks

    Request Free Sample

    What are the Key Data Covered in this Tanker Shipping Market Research and Growth Report?

    • CAGR of the Tanker Shipping industry during the forecast period
    • Detailed information on factors that will drive the growth and forecasting between 2025 and 2029
    • Precise estimation of the size of the market and its contribution of the industry in focus to the parent market
    • Accurate predictions about upcoming growth and trends and changes in consumer behaviour
    • Growth of the market across APAC, Europe, North America, South America, and Middle East and Africa
    • Thorough analysis of the market’s competitive landscape and detailed information about companies
    • Comprehensive analysis of factors that will challenge the tanker shipping market growth of industry companies

    We can help! Our analysts can customize this tanker shipping market research report to meet your requirements.

    Get in touch


    1 Executive Summary

    • 1.1 Market overview
      • Executive Summary - Chart on Market Overview
      • Executive Summary - Data Table on Market Overview
      • Executive Summary - Chart on Global Market Characteristics
      • Executive Summary - Chart on Market by Geography
      • Executive Summary - Chart on Market Segmentation by Type
      • Executive Summary - Chart on Market Segmentation by Mode of Transportation
      • Executive Summary - Chart on Market Segmentation by Product Type
      • Executive Summary - Chart on Incremental Growth
      • Executive Summary - Data Table on Incremental Growth
      • Executive Summary - Chart on Company Market Positioning

    2 Technavio Analysis

    • 2.1 Analysis of price sensitivity, lifecycle, customer purchase basket, adoption rates, and purchase criteria
      • Analysis of price sensitivity, lifecycle, customer purchase basket, adoption rates, and purchase criteria
    • 2.2 Criticality of inputs and Factors of differentiation
      • Overview on criticality of inputs and factors of differentiation
    • 2.3 Factors of disruption
      • Overview on factors of disruption
    • 2.4 Impact of drivers and challenges
      • Impact of drivers and challenges in 2024 and 2029

    3 Market Landscape

    • 3.1 Market ecosystem
      • Parent Market
      • Data Table on - Parent Market
    • 3.2 Market characteristics
      • Market characteristics analysis
    • 3.3 Value chain analysis
      • Value chain analysis

    4 Market Sizing

    • 4.1 Market definition
      • Offerings of companies included in the market definition
    • 4.2 Market segment analysis
      • Market segments
    • 4.3 Market size 2024
      • 4.4 Market outlook: Forecast for 2024-2029
        • Chart on Global - Market size and forecast 2024-2029 ($ million)
        • Data Table on Global - Market size and forecast 2024-2029 ($ million)
        • Chart on Global Market: Year-over-year growth 2024-2029 (%)
        • Data Table on Global Market: Year-over-year growth 2024-2029 (%)

      5 Historic Market Size

      • 5.1 Global Tanker Shipping Market 2019 - 2023
        • Historic Market Size - Data Table on Global Tanker Shipping Market 2019 - 2023 ($ million)
      • 5.2 Type segment analysis 2019 - 2023
        • Historic Market Size - Type Segment 2019 - 2023 ($ million)
      • 5.3 Mode of Transportation segment analysis 2019 - 2023
        • Historic Market Size - Mode of Transportation Segment 2019 - 2023 ($ million)
      • 5.4 Product Type segment analysis 2019 - 2023
        • Historic Market Size - Product Type Segment 2019 - 2023 ($ million)
      • 5.5 Geography segment analysis 2019 - 2023
        • Historic Market Size - Geography Segment 2019 - 2023 ($ million)
      • 5.6 Country segment analysis 2019 - 2023
        • Historic Market Size - Country Segment 2019 - 2023 ($ million)

      6 Qualitative Analysis

      • 6.1 Impact Analysis of U.S. Tariffs on Global Tanker Shipping Market

        7 Five Forces Analysis

        • 7.1 Five forces summary
          • Five forces analysis - Comparison between 2024 and 2029
        • 7.2 Bargaining power of buyers
          • Bargaining power of buyers - Impact of key factors 2024 and 2029
        • 7.3 Bargaining power of suppliers
          • Bargaining power of suppliers - Impact of key factors in 2024 and 2029
        • 7.4 Threat of new entrants
          • Threat of new entrants - Impact of key factors in 2024 and 2029
        • 7.5 Threat of substitutes
          • Threat of substitutes - Impact of key factors in 2024 and 2029
        • 7.6 Threat of rivalry
          • Threat of rivalry - Impact of key factors in 2024 and 2029
        • 7.7 Market condition
          • Chart on Market condition - Five forces 2024 and 2029

        8 Market Segmentation by Type

        • 8.1 Market segments
          • Chart on Type - Market share (2024-2029) (%)
          • Data Table on Type - Market share (2024-2029) (%)
        • 8.2 Comparison by Type
          • Chart on Comparison by Type
          • Data Table on Comparison by Type
        • 8.3 Oil tankers - Market size and forecast (2024-2029)
          • Chart on Oil tankers - Market size and forecast (2024-2029) ($ million)
          • Data Table on Oil tankers - Market size and forecast (2024-2029) ($ million)
          • Chart on Oil tankers - Year-over-year growth (2024-2029) (%)
          • Data Table on Oil tankers - Year-over-year growth (2024-2029) (%)
        • 8.4 Liquid gas tankers - Market size and forecast (2024-2029)
          • Chart on Liquid gas tankers - Market size and forecast (2024-2029) ($ million)
          • Data Table on Liquid gas tankers - Market size and forecast (2024-2029) ($ million)
          • Chart on Liquid gas tankers - Year-over-year growth (2024-2029) (%)
          • Data Table on Liquid gas tankers - Year-over-year growth (2024-2029) (%)
        • 8.5 Chemical tankers - Market size and forecast (2024-2029)
          • Chart on Chemical tankers - Market size and forecast (2024-2029) ($ million)
          • Data Table on Chemical tankers - Market size and forecast (2024-2029) ($ million)
          • Chart on Chemical tankers - Year-over-year growth (2024-2029) (%)
          • Data Table on Chemical tankers - Year-over-year growth (2024-2029) (%)
        • 8.6 Market opportunity by Type
          • Market opportunity by Type ($ million)
          • Data Table on Market opportunity by Type ($ million)

        9 Market Segmentation by Mode Of Transportation

        • 9.1 Market segments
          • Chart on Mode Of Transportation - Market share (2024-2029) (%)
          • Data Table on Mode Of Transportation - Market share (2024-2029) (%)
        • 9.2 Comparison by Mode Of Transportation
          • Chart on Comparison by Mode Of Transportation
          • Data Table on Comparison by Mode Of Transportation
        • 9.3 Deep sea - Market size and forecast (2024-2029)
          • Chart on Deep sea - Market size and forecast (2024-2029) ($ million)
          • Data Table on Deep sea - Market size and forecast (2024-2029) ($ million)
          • Chart on Deep sea - Year-over-year growth (2024-2029) (%)
          • Data Table on Deep sea - Year-over-year growth (2024-2029) (%)
        • 9.4 Coastal - Market size and forecast (2024-2029)
          • Chart on Coastal - Market size and forecast (2024-2029) ($ million)
          • Data Table on Coastal - Market size and forecast (2024-2029) ($ million)
          • Chart on Coastal - Year-over-year growth (2024-2029) (%)
          • Data Table on Coastal - Year-over-year growth (2024-2029) (%)
        • 9.5 In-land - Market size and forecast (2024-2029)
          • Chart on In-land - Market size and forecast (2024-2029) ($ million)
          • Data Table on In-land - Market size and forecast (2024-2029) ($ million)
          • Chart on In-land - Year-over-year growth (2024-2029) (%)
          • Data Table on In-land - Year-over-year growth (2024-2029) (%)
        • 9.6 Market opportunity by Mode Of Transportation
          • Market opportunity by Mode Of Transportation ($ million)
          • Data Table on Market opportunity by Mode Of Transportation ($ million)

        10 Market Segmentation by Product Type

        • 10.1 Market segments
          • Chart on Product Type - Market share (2024-2029) (%)
          • Data Table on Product Type - Market share (2024-2029) (%)
        • 10.2 Comparison by Product Type
          • Chart on Comparison by Product Type
          • Data Table on Comparison by Product Type
        • 10.3 VLCC and ULCC - Market size and forecast (2024-2029)
          • Chart on VLCC and ULCC - Market size and forecast (2024-2029) ($ million)
          • Data Table on VLCC and ULCC - Market size and forecast (2024-2029) ($ million)
          • Chart on VLCC and ULCC - Year-over-year growth (2024-2029) (%)
          • Data Table on VLCC and ULCC - Year-over-year growth (2024-2029) (%)
        • 10.4 Suezmax - Market size and forecast (2024-2029)
          • Chart on Suezmax - Market size and forecast (2024-2029) ($ million)
          • Data Table on Suezmax - Market size and forecast (2024-2029) ($ million)
          • Chart on Suezmax - Year-over-year growth (2024-2029) (%)
          • Data Table on Suezmax - Year-over-year growth (2024-2029) (%)
        • 10.5 Aframax - Market size and forecast (2024-2029)
          • Chart on Aframax - Market size and forecast (2024-2029) ($ million)
          • Data Table on Aframax - Market size and forecast (2024-2029) ($ million)
          • Chart on Aframax - Year-over-year growth (2024-2029) (%)
          • Data Table on Aframax - Year-over-year growth (2024-2029) (%)
        • 10.6 Others - Market size and forecast (2024-2029)
          • Chart on Others - Market size and forecast (2024-2029) ($ million)
          • Data Table on Others - Market size and forecast (2024-2029) ($ million)
          • Chart on Others - Year-over-year growth (2024-2029) (%)
          • Data Table on Others - Year-over-year growth (2024-2029) (%)
        • 10.7 Market opportunity by Product Type
          • Market opportunity by Product Type ($ million)
          • Data Table on Market opportunity by Product Type ($ million)

        11 Market Segmentation by Tanker Type

        • 11.1 Market segments
          • Chart on Tanker Type - Market share (2024-2029) (%)
          • Data Table on Tanker Type - Market share (2024-2029) (%)
        • 11.2 Comparison by Tanker Type
          • Chart on Comparison by Tanker Type
          • Data Table on Comparison by Tanker Type
        • 11.3 Crude Oil Tankers - Market size and forecast (2024-2029)
          • Chart on Crude Oil Tankers - Market size and forecast (2024-2029) ($ million)
          • Data Table on Crude Oil Tankers - Market size and forecast (2024-2029) ($ million)
          • Chart on Crude Oil Tankers - Year-over-year growth (2024-2029) (%)
          • Data Table on Crude Oil Tankers - Year-over-year growth (2024-2029) (%)
        • 11.4 Product Tankers - Market size and forecast (2024-2029)
          • Chart on Product Tankers - Market size and forecast (2024-2029) ($ million)
          • Data Table on Product Tankers - Market size and forecast (2024-2029) ($ million)
          • Chart on Product Tankers - Year-over-year growth (2024-2029) (%)
          • Data Table on Product Tankers - Year-over-year growth (2024-2029) (%)
        • 11.5 Chemical Tankers - Market size and forecast (2024-2029)
          • Chart on Chemical Tankers - Market size and forecast (2024-2029) ($ million)
          • Data Table on Chemical Tankers - Market size and forecast (2024-2029) ($ million)
          • Chart on Chemical Tankers - Year-over-year growth (2024-2029) (%)
          • Data Table on Chemical Tankers - Year-over-year growth (2024-2029) (%)
        • 11.6 LNG Tankers - Market size and forecast (2024-2029)
          • Chart on LNG Tankers - Market size and forecast (2024-2029) ($ million)
          • Data Table on LNG Tankers - Market size and forecast (2024-2029) ($ million)
          • Chart on LNG Tankers - Year-over-year growth (2024-2029) (%)
          • Data Table on LNG Tankers - Year-over-year growth (2024-2029) (%)
        • 11.7 Market opportunity by Tanker Type
          • Market opportunity by Tanker Type ($ million)
          • Data Table on Market opportunity by Tanker Type ($ million)

        12 Market Segmentation by Service Time

        • 12.1 Market segments
          • Chart on Service Time - Market share (2024-2029) (%)
          • Data Table on Service Time - Market share (2024-2029) (%)
        • 12.2 Comparison by Service Time
          • Chart on Comparison by Service Time
          • Data Table on Comparison by Service Time
        • 12.3 Spot Market - Market size and forecast (2024-2029)
          • Chart on Spot Market - Market size and forecast (2024-2029) ($ million)
          • Data Table on Spot Market - Market size and forecast (2024-2029) ($ million)
          • Chart on Spot Market - Year-over-year growth (2024-2029) (%)
          • Data Table on Spot Market - Year-over-year growth (2024-2029) (%)
        • 12.4 Time Charter - Market size and forecast (2024-2029)
          • Chart on Time Charter - Market size and forecast (2024-2029) ($ million)
          • Data Table on Time Charter - Market size and forecast (2024-2029) ($ million)
          • Chart on Time Charter - Year-over-year growth (2024-2029) (%)
          • Data Table on Time Charter - Year-over-year growth (2024-2029) (%)
        • 12.5 Contract of Affreightment - Market size and forecast (2024-2029)
          • Chart on Contract of Affreightment - Market size and forecast (2024-2029) ($ million)
          • Data Table on Contract of Affreightment - Market size and forecast (2024-2029) ($ million)
          • Chart on Contract of Affreightment - Year-over-year growth (2024-2029) (%)
          • Data Table on Contract of Affreightment - Year-over-year growth (2024-2029) (%)
        • 12.6 Market opportunity by Service Time
          • Market opportunity by Service Time ($ million)
          • Data Table on Market opportunity by Service Time ($ million)

        13 Customer Landscape

        • 13.1 Customer landscape overview
          • Analysis of price sensitivity, lifecycle, customer purchase basket, adoption rates, and purchase criteria

        14 Geographic Landscape

        • 14.1 Geographic segmentation
          • Chart on Market share by geography 2024-2029 (%)
          • Data Table on Market share by geography 2024-2029 (%)
        • 14.2 Geographic comparison
          • Chart on Geographic comparison
          • Data Table on Geographic comparison
        • 14.3 APAC - Market size and forecast 2024-2029
          • Chart on APAC - Market size and forecast 2024-2029 ($ million)
          • Data Table on APAC - Market size and forecast 2024-2029 ($ million)
          • Chart on APAC - Year-over-year growth 2024-2029 (%)
          • Data Table on APAC - Year-over-year growth 2024-2029 (%)
        • 14.4 Europe - Market size and forecast 2024-2029
          • Chart on Europe - Market size and forecast 2024-2029 ($ million)
          • Data Table on Europe - Market size and forecast 2024-2029 ($ million)
          • Chart on Europe - Year-over-year growth 2024-2029 (%)
          • Data Table on Europe - Year-over-year growth 2024-2029 (%)
        • 14.5 North America - Market size and forecast 2024-2029
          • Chart on North America - Market size and forecast 2024-2029 ($ million)
          • Data Table on North America - Market size and forecast 2024-2029 ($ million)
          • Chart on North America - Year-over-year growth 2024-2029 (%)
          • Data Table on North America - Year-over-year growth 2024-2029 (%)
        • 14.6 South America - Market size and forecast 2024-2029
          • Chart on South America - Market size and forecast 2024-2029 ($ million)
          • Data Table on South America - Market size and forecast 2024-2029 ($ million)
          • Chart on South America - Year-over-year growth 2024-2029 (%)
          • Data Table on South America - Year-over-year growth 2024-2029 (%)
        • 14.7 Middle East and Africa - Market size and forecast 2024-2029
          • Chart on Middle East and Africa - Market size and forecast 2024-2029 ($ million)
          • Data Table on Middle East and Africa - Market size and forecast 2024-2029 ($ million)
          • Chart on Middle East and Africa - Year-over-year growth 2024-2029 (%)
          • Data Table on Middle East and Africa - Year-over-year growth 2024-2029 (%)
        • 14.8 China - Market size and forecast 2024-2029
          • Chart on China - Market size and forecast 2024-2029 ($ million)
          • Data Table on China - Market size and forecast 2024-2029 ($ million)
          • Chart on China - Year-over-year growth 2024-2029 (%)
          • Data Table on China - Year-over-year growth 2024-2029 (%)
        • 14.9 Japan - Market size and forecast 2024-2029
          • Chart on Japan - Market size and forecast 2024-2029 ($ million)
          • Data Table on Japan - Market size and forecast 2024-2029 ($ million)
          • Chart on Japan - Year-over-year growth 2024-2029 (%)
          • Data Table on Japan - Year-over-year growth 2024-2029 (%)
        • 14.10 US - Market size and forecast 2024-2029
          • Chart on US - Market size and forecast 2024-2029 ($ million)
          • Data Table on US - Market size and forecast 2024-2029 ($ million)
          • Chart on US - Year-over-year growth 2024-2029 (%)
          • Data Table on US - Year-over-year growth 2024-2029 (%)
        • 14.11 Greece - Market size and forecast 2024-2029
          • Chart on Greece - Market size and forecast 2024-2029 ($ million)
          • Data Table on Greece - Market size and forecast 2024-2029 ($ million)
          • Chart on Greece - Year-over-year growth 2024-2029 (%)
          • Data Table on Greece - Year-over-year growth 2024-2029 (%)
        • 14.12 Singapore - Market size and forecast 2024-2029
          • Chart on Singapore - Market size and forecast 2024-2029 ($ million)
          • Data Table on Singapore - Market size and forecast 2024-2029 ($ million)
          • Chart on Singapore - Year-over-year growth 2024-2029 (%)
          • Data Table on Singapore - Year-over-year growth 2024-2029 (%)
        • 14.13 South Korea - Market size and forecast 2024-2029
          • Chart on South Korea - Market size and forecast 2024-2029 ($ million)
          • Data Table on South Korea - Market size and forecast 2024-2029 ($ million)
          • Chart on South Korea - Year-over-year growth 2024-2029 (%)
          • Data Table on South Korea - Year-over-year growth 2024-2029 (%)
        • 14.14 Norway - Market size and forecast 2024-2029
          • Chart on Norway - Market size and forecast 2024-2029 ($ million)
          • Data Table on Norway - Market size and forecast 2024-2029 ($ million)
          • Chart on Norway - Year-over-year growth 2024-2029 (%)
          • Data Table on Norway - Year-over-year growth 2024-2029 (%)
        • 14.15 Germany - Market size and forecast 2024-2029
          • Chart on Germany - Market size and forecast 2024-2029 ($ million)
          • Data Table on Germany - Market size and forecast 2024-2029 ($ million)
          • Chart on Germany - Year-over-year growth 2024-2029 (%)
          • Data Table on Germany - Year-over-year growth 2024-2029 (%)
        • 14.16 UK - Market size and forecast 2024-2029
          • Chart on UK - Market size and forecast 2024-2029 ($ million)
          • Data Table on UK - Market size and forecast 2024-2029 ($ million)
          • Chart on UK - Year-over-year growth 2024-2029 (%)
          • Data Table on UK - Year-over-year growth 2024-2029 (%)
        • 14.17 Switzerland - Market size and forecast 2024-2029
          • Chart on Switzerland - Market size and forecast 2024-2029 ($ million)
          • Data Table on Switzerland - Market size and forecast 2024-2029 ($ million)
          • Chart on Switzerland - Year-over-year growth 2024-2029 (%)
          • Data Table on Switzerland - Year-over-year growth 2024-2029 (%)
        • 14.18 Market opportunity by geography
          • Market opportunity by geography ($ million)
          • Data Tables on Market opportunity by geography ($ million)
        • 14.19 Rest of World (ROW) - Market size and forecast (2024-2029)
          • Chart on Rest of World (ROW) - Market size and forecast (2024-2029) ($ million)
          • Data Table on Rest of World (ROW) - Market size and forecast (2024-2029) ($ million)
          • Chart on Rest of World (ROW) - Year-over-year growth (2024-2029) (%)
          • Data Table on Rest of World (ROW) - Year-over-year growth (2024-2029) (%)

        15 Drivers, Challenges, and Opportunity/Restraints

        • 15.1 Market drivers
          • 15.2 Market challenges
            • 15.3 Impact of drivers and challenges
              • Impact of drivers and challenges in 2024 and 2029
            • 15.4 Market opportunities/restraints

              16 Competitive Landscape

              • 16.1 Overview
                • 16.2 Competitive Landscape
                  • Overview on criticality of inputs and factors of differentiation
                • 16.3 Landscape disruption
                  • Overview on factors of disruption
                • 16.4 Industry risks
                  • Impact of key risks on business

                17 Competitive Analysis

                • 17.1 Companies profiled
                  • Companies covered
                • 17.2 Company ranking index
                  • Company ranking index
                • 17.3 Market positioning of companies
                  • Matrix on companies position and classification
                • 17.4 Bahri
                  • Bahri - Overview
                  • Bahri - Business segments
                  • Bahri - Key offerings
                  • Bahri - Segment focus
                  • SWOT
                • 17.5 BW Group
                  • BW Group - Overview
                  • BW Group - Product / Service
                  • BW Group - Key offerings
                  • SWOT
                • 17.6 CMB.TECH NV
                  • CMB.TECH NV - Overview
                  • CMB.TECH NV - Business segments
                  • CMB.TECH NV - Key offerings
                  • CMB.TECH NV - Segment focus
                  • SWOT
                • 17.7 COSCO Shipping Ports Ltd.
                  • COSCO Shipping Ports Ltd. - Overview
                  • COSCO Shipping Ports Ltd. - Product / Service
                  • COSCO Shipping Ports Ltd. - Key offerings
                  • SWOT
                • 17.8 Frontline plc
                  • Frontline plc - Overview
                  • Frontline plc - Product / Service
                  • Frontline plc - Key offerings
                  • SWOT
                • 17.9 IINO Kaiun Kaisha Ltd.
                  • IINO Kaiun Kaisha Ltd. - Overview
                  • IINO Kaiun Kaisha Ltd. - Product / Service
                  • IINO Kaiun Kaisha Ltd. - Key offerings
                  • SWOT
                • 17.10 INTERNATIONAL SEAWAYS INC.
                  • INTERNATIONAL SEAWAYS INC. - Overview
                  • INTERNATIONAL SEAWAYS INC. - Business segments
                  • INTERNATIONAL SEAWAYS INC. - Key offerings
                  • INTERNATIONAL SEAWAYS INC. - Segment focus
                  • SWOT
                • 17.11 MAERSK TANKERS AS
                  • MAERSK TANKERS AS - Overview
                  • MAERSK TANKERS AS - Product / Service
                  • MAERSK TANKERS AS - Key offerings
                  • SWOT
                • 17.12 Mitsui O.S.K. Lines Ltd.
                  • Mitsui O.S.K. Lines Ltd. - Overview
                  • Mitsui O.S.K. Lines Ltd. - Business segments
                  • Mitsui O.S.K. Lines Ltd. - Key offerings
                  • Mitsui O.S.K. Lines Ltd. - Segment focus
                  • SWOT
                • 17.13 Odfjell SE
                  • Odfjell SE - Overview
                  • Odfjell SE - Product / Service
                  • Odfjell SE - Key news
                  • Odfjell SE - Key offerings
                  • SWOT
                • 17.14 Scorpio Tankers Inc.
                  • Scorpio Tankers Inc. - Overview
                  • Scorpio Tankers Inc. - Product / Service
                  • Scorpio Tankers Inc. - Key offerings
                  • SWOT
                • 17.15 SFL Corp. Ltd.
                  • SFL Corp. Ltd. - Overview
                  • SFL Corp. Ltd. - Product / Service
                  • SFL Corp. Ltd. - Key offerings
                  • SWOT
                • 17.16 Stolt Nielsen Ltd.
                  • Stolt Nielsen Ltd. - Overview
                  • Stolt Nielsen Ltd. - Business segments
                  • Stolt Nielsen Ltd. - Key offerings
                  • Stolt Nielsen Ltd. - Segment focus
                  • SWOT
                • 17.17 Teekay Corp.
                  • Teekay Corp. - Overview
                  • Teekay Corp. - Product / Service
                  • Teekay Corp. - Key offerings
                  • SWOT
                • 17.18 Tsakos Energy Navigation Ltd.
                  • Tsakos Energy Navigation Ltd. - Overview
                  • Tsakos Energy Navigation Ltd. - Product / Service
                  • Tsakos Energy Navigation Ltd. - Key offerings
                  • SWOT

                18 Appendix

                • 18.1 Scope of the report
                  • 18.2 Inclusions and exclusions checklist
                    • Inclusions checklist
                    • Exclusions checklist
                  • 18.3 Currency conversion rates for US$
                    • Currency conversion rates for US$
                  • 18.4 Research methodology
                    • Research methodology
                  • 18.5 Data procurement
                    • Information sources
                  • 18.6 Data validation
                    • Data validation
                  • 18.7 Validation techniques employed for market sizing
                    • Validation techniques employed for market sizing
                  • 18.8 Data synthesis
                    • Data synthesis
                  • 18.9 360 degree market analysis
                    • 360 degree market analysis
                  • 18.10 List of abbreviations
                    • List of abbreviations

                  Research Methodology

                  Technavio presents a detailed picture of the market by way of study, synthesis, and summation of data from multiple sources. The analysts have presented the various facets of the market with a particular focus on identifying the key industry influencers. The data thus presented is comprehensive, reliable, and the result of extensive research, both primary and secondary.

                  INFORMATION SOURCES

                  Primary sources

                  • Manufacturers and suppliers
                  • Channel partners
                  • Industry experts
                  • Strategic decision makers

                  Secondary sources

                  • Industry journals and periodicals
                  • Government data
                  • Financial reports of key industry players
                  • Historical data
                  • Press releases

                  DATA ANALYSIS

                  Data Synthesis

                  • Collation of data
                  • Estimation of key figures
                  • Analysis of derived insights

                  Data Validation

                  • Triangulation with data models
                  • Reference against proprietary databases
                  • Corroboration with industry experts

                  REPORT WRITING

                  Qualitative

                  • Market drivers
                  • Market challenges
                  • Market trends
                  • Five forces analysis

                  Quantitative

                  • Market size and forecast
                  • Market segmentation
                  • Geographical insights
                  • Competitive landscape

                  Interested in this report?

                  Get your sample now to see our research methodology and insights!

                  Download Now

                  Frequently Asked Questions

                  Tanker Shipping market growth will increase by $ 19951.4 mn during 2025-2029.

                  The Tanker Shipping market is expected to grow at a CAGR of 8.9% during 2025-2029.

                  Tanker Shipping market is segmented by Type( Oil tankers, Liquid gas tankers, Chemical tankers) Mode Of Transportation( Deep sea, Coastal, In-land, North America, South America) Product Type( VLCC and ULCC, Suezmax, Aframax, Others, South America)

                  Bahri, BW Group, CMB.TECH NV, COSCO Shipping Ports Ltd., DHT Holdings Inc., Eastern Pacific Shipping, Frontline plc, IINO Kaiun Kaisha Ltd., INTERNATIONAL SEAWAYS INC., MAERSK TANKERS AS, Mitsui O.S.K. Lines Ltd., Navios Maritime Holdings Inc., Odfjell SE, Scorpio Tankers Inc., SFL Corp. Ltd., Stolt Nielsen Ltd., Teekay Corp., TORM plc, Tsakos Energy Navigation Ltd. are a few of the key vendors in the Tanker Shipping market.

                  APAC will register the highest growth rate of 50% among the other regions. Therefore, the Tanker Shipping market in APAC is expected to garner significant business opportunities for the vendors during the forecast period.

                  China, Japan, US, Greece, Singapore, South Korea, Norway, Germany, Switzerland, UK

                  • Global oil and gas demandThe global oil and gas demand is expected to remain a primary driver of the global tanker shipping market. The continued reliance on fossil fuels is the driving factor this market.
                  • particularly in emerging economies is the driving factor this market.
                  • sustains the need for large-scale maritime transport of crude oil is the driving factor this market.
                  • refined products is the driving factor this market.
                  • and liquefied natural gas (LNG). This demand directly influences tanker utilization rates is the driving factor this market.
                  • voyage frequency is the driving factor this market.
                  • and route optimization strategies across the sector. In 2024 is the driving factor this market.
                  • global oil consumption increased by approximately 0.8 million barrels per day is the driving factor this market.
                  • reaching a total of 103.9 million barrels per day. This growth was largely attributed to rising demand for petrochemical feedstocks and a modest recovery in transportation fuels. The petrochemical sector is the driving factor this market.
                  • in particular is the driving factor this market.
                  • continues to expand in response to industrial development and consumer goods manufacturing is the driving factor this market.
                  • especially in Asia and the Middle East. As a result is the driving factor this market.
                  • the need for consistent and efficient crude and product tanker operations remains critical to supporting downstream supply chains. Simultaneously is the driving factor this market.
                  • global natural gas consumption rose by 2.8 percent in 2024 is the driving factor this market.
                  • equivalent to an increase of approximately 115 billion cubic meters. This surge was driven by economic expansion and industrial growth in emerging markets is the driving factor this market.
                  • particularly in Asia. The increased use of natural gas as a transitional energy source has led to higher demand for LNG carriers and related infrastructure. Countries investing in gas-fired power generation and industrial applications are contributing to a more complex and geographically diverse LNG trade network. The sustained demand for oil and gas reinforces the strategic importance of tanker shipping in global energy logistics. Operators are responding by optimizing fleet deployment is the driving factor this market.
                  • investing in fuel-efficient vessels is the driving factor this market.
                  • and expanding capacity to meet evolving trade patterns. As energy consumption continues to shift geographically and sectorally is the driving factor this market.
                  • tanker shipping remains a vital link in the global energy supply chain. is the driving factor this market.

                  The Tanker Shipping market vendors should focus on grabbing business opportunities from the Oil tankers segment as it accounted for the largest market share in the base year.