Tank Trucking Market Analysis, Size, and Forecast 2025-2029: North America (US and Canada), Europe (France, Germany, Italy, Spain, and UK), APAC (China, India, and Singapore), and Rest of World (ROW)

Tank Trucking Market Analysis, Size, and Forecast 2025-2029:
North America (US and Canada), Europe (France, Germany, Italy, Spain, and UK), APAC (China, India, and Singapore), and Rest of World (ROW)

Published: Jun 2025 203 Pages SKU: IRTNTR74833

Market Overview at a Glance

$134.2 B
Market Opportunity
8.5%
CAGR
7.7
YoY growth 2024-2025(%)

Tank Trucking Market Size 2025-2029

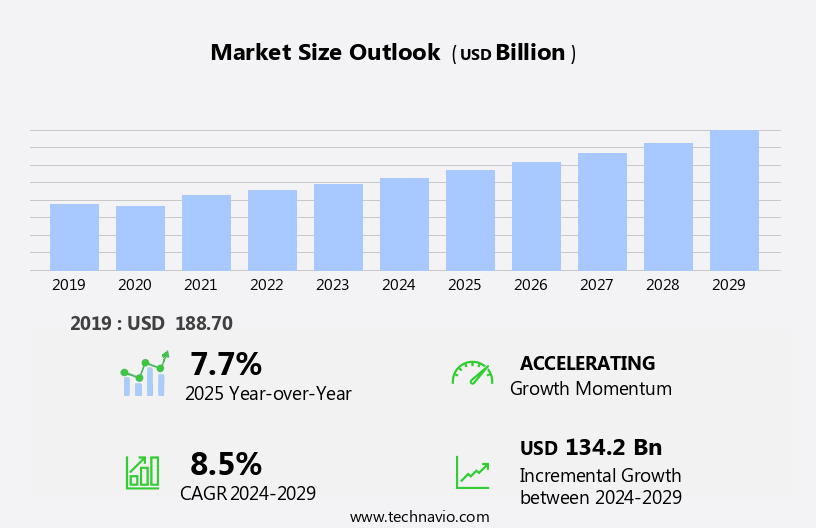
The tank trucking market size is forecast to increase by USD 134.2 billion at a CAGR of 8.5% between 2024 and 2029.

  • The market is witnessing significant growth due to the escalating demand for the transportation of oil and natural gas. This sector is experiencing a rise in demand as the energy industry continues to expand, particularly in regions with abundant oil and gas reserves. Furthermore, technological advancements are revolutionizing the tank trucking industry, enabling more efficient and cost-effective transportation solutions. With industrialization and urbanization on the rise in emerging economies, the need for power generation, manufacturing, and transportation fuels continues to expand. However, the market faces challenges related to leakage issues during transportation.
  • Addressing these challenges through the implementation of advanced technologies and stringent safety protocols will be crucial for market participants seeking to capitalize on the opportunities presented by the growing demand for oil and gas transportation. Companies that successfully navigate these challenges and leverage technological advancements will be well-positioned to thrive in this dynamic market. These incidents can result in environmental hazards, regulatory penalties, and reputational damage for companies.

What will be the Size of the Tank Trucking Market during the forecast period?

Tank Trucking Market Size

 Explore in-depth regional segment analysis with market size data - historical 2019-2023 and forecasts 2025-2029 - in the full report.  
Request Free Sample

  • In the complex and dynamic world of tank trucking, various market elements interplay to shape industry trends. Fuel cards facilitate efficient payment processing for diesel purchases, while rail transport serves as an alternative to road transport for certain cargo. Safety audits and tanker maintenance ensure regulatory compliance and vehicle reliability. Parking facilities, fuel consumption monitoring, and traffic management optimize fleet operations. Trailers' manufacturing and third-party logistics (3PL) services streamline supply chains, with freight brokers acting as intermediaries. Road conditions necessitate maintenance contracts and fleet management software, while inventory management and compliance certifications maintain regulatory adherence.
  • Cargo theft prevention, parts distributors, and port operations ensure seamless cargo handling. Background checks, route planning software, driver welfare, and driver licensing maintain a skilled workforce. Regulatory bodies, rest areas, driver pay, warehouse management, vehicle tracking, drug testing, driver behavior analysis, logistics providers, engine diagnostics, supply chain optimization, lease vs buy, financing options, preventive maintenance programs, and security systems are integral components of the evolving tank trucking landscape. Weather forecasting, intermodal transportation, and insurance providers mitigate risks. The market is experiencing significant growth due to the increasing demand for transporting oil and natural gas.

How is this Tank Trucking Industry segmented?

The tank trucking industry research report provides comprehensive data (region-wise segment analysis), with forecasts and estimates in "USD billion" for the period 2025-2029, as well as historical data from 2019-2023 for the following segments.

  • Ownership
    • For hire
    • Private
  • Capacity
    • Medium duty
    • Heavy duty
    • Light duty
  • Application
    • Oil and gas
    • Chemicals
    • Food and beverage
    • Agriculture
    • Others
  • Geography
    • North America
      • US
      • Canada
    • Europe
      • France
      • Germany
      • Italy
      • Spain
      • UK
    • APAC
      • China
      • India
      • Singapore
    • Rest of World (ROW)

By Ownership Insights

The for hire segment is estimated to witness significant growth during the forecast period. The for-hire segment in the market is a critical player in the transportation of bulk liquids, chemicals, fuels, and food-grade products. For-hire carriers provide specialized logistics services to a wide range of clients, from small businesses to multinational corporations, offering operational flexibility that allows shippers to scale their transportation needs without the burden of fleet ownership or maintenance. With a focus on safety and compliance, given the hazardous nature of many transported materials, these companies employ advanced technologies for route optimization, real-time GPS tracking, and regulatory adherence. Digital freight matching platforms enhance the efficiency of the industry by connecting shippers and carriers in real-time, optimizing load planning and reducing empty miles.

Specialized tankers cater to the unique requirements of various industries, such as chemical tankers, sanitation standards for food-grade products, and safety regulations for hazardous materials. Fuel efficiency and cost-effective solutions are essential considerations for tank trucking companies. Alternative fuels like hybrid and electric trucks are gaining traction, as are fuel systems and emissions control systems that minimize carbon footprint and greenhouse gas emissions. Driver shortages are addressed through driver training, management systems, and retention initiatives, while driver assistance systems and tank trailer components ensure safety and regulatory compliance. Network optimization and capacity utilization are crucial for reducing operating costs.

Logistics software, dispatch software, and data analytics enable real-time monitoring and optimization of fleet performance. Load planning, temperature-controlled transport, and cleaning procedures are essential for maintaining the quality and integrity of transported goods. Pneumatic tankers, flatbed trailers, and dry bulk tankers cater to specific industries, while autonomous driving technology and maintenance scheduling are shaping the future of tank trucking. Regulatory compliance and insurance costs remain significant challenges for the industry, but sustainability initiatives and the integration of blockchain technology offer potential solutions.

Tank Trucking Market Size

 Download Free Sample Report

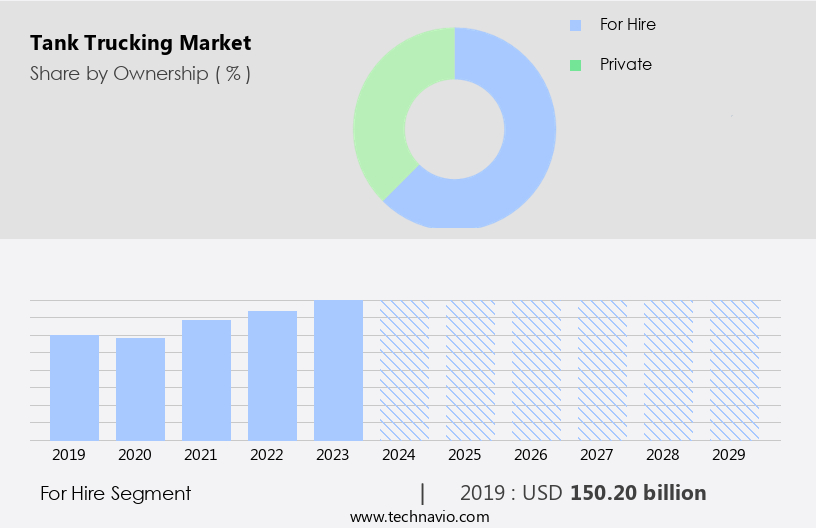
The For hire segment was valued at USD 150.20 billion in 2019 and showed a gradual increase during the forecast period.

The Tank Trucking Market is evolving rapidly to meet the demands of safety, efficiency, and sustainability. Key segments such as dry van trailers and liquid tankers are essential in transporting a variety of goods, from chemicals to food products. Emphasis on accident prevention has driven investments in advanced telematics and driver training programs, ensuring greater road safety. The rise of temperature controlled transport is also transforming the delivery of perishable and sensitive cargo. Regular tank cleaning practices are being implemented to comply with stringent hygiene and environmental regulations. Meanwhile, the adoption of hybrid trucks supports the industry's shift toward greener logistics, reducing emissions while maintaining performance.

The Tank Trucking Market is expanding steadily, supported by vital infrastructure and logistics advancements. The integration of shipping containers for intermodal transport is enhancing efficiency, particularly for bulk liquid and chemical deliveries across long distances. Accessibility to well-equipped truck stops plays a critical role in supporting drivers with rest, fueling, and route optimization services, boosting operational uptime. Additionally, the presence of strategically located repair shops ensures timely maintenance and quick turnaround for tank fleets, reducing costly delays and enhancing safety compliance. The tank trucking industry plays a crucial role in cargo transportation, particularly for specialized equipment such as tankers. Motor vehicles, specifically tank trucks, are essential for long-distance transportation of various commodities, including hazardous materials, in industries like health care, oil and gas, and chemical production.

Regional Analysis

North America is estimated to contribute 34% to the growth of the global market during the forecast period. Technavio's analysts have elaborately explained the regional trends and drivers that shape the market during the forecast period.

Tank Trucking Market Share by Geography

View Free PDF Sample

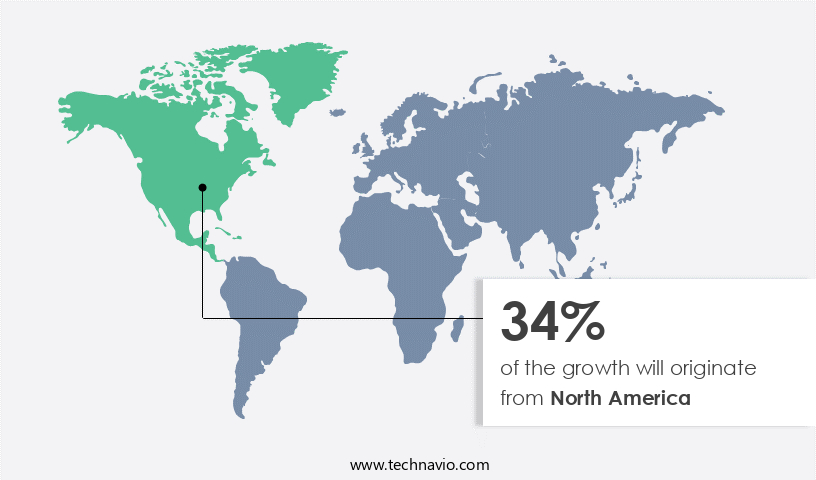
The North America market is a significant contributor to the global industry, fueled by the region's extensive industrial sector, sophisticated infrastructure, and rigorous safety regulations. This market is closely intertwined with key industries like chemicals, petroleum, food-grade liquids, and industrial gases, necessitating specialized transportation solutions. The United States is particularly noteworthy due to its intricate network of highways and logistics centers, facilitating both long-haul and regional tank truck operations. Moreover, the presence of major tank trucking companies and a well-established regulatory framework, such as the U.S. Department of Transportation's Hazardous Materials Regulations, ensures a high level of safety and dependability in the transport of sensitive and hazardous materials.

Digital freight matching platforms streamline the process of connecting shippers with carriers, optimizing network efficiency and reducing empty miles. The adoption of digital technologies like GPS tracking, route optimization, and load planning enhances operational efficiency and lowers fuel costs. Fuel efficiency is further improved through advancements in fuel systems and alternative fuels like hybrid and electric trucks. Emissions control systems and sustainability initiatives are essential in minimizing the tank trucking sector's carbon footprint and greenhouse gas emissions. Safety regulations and insurance costs remain a priority, with driver training, management systems, and driver retention strategies crucial for maintaining a skilled workforce.

Maintenance scheduling, safety valves, and pressure gauges are essential components for ensuring the longevity and reliability of tank trailers. The integration of technology, such as dispatch software, capacity utilization, logistics software, and data analytics, enhances overall operating costs and regulatory compliance. The market also includes the transportation of dry bulk materials using dry bulk tankers and flatbed trailers, as well as temperature-controlled transport using reefer trailers. The adoption of autonomous driving technology and advanced driver assistance systems is an emerging trend, aiming to improve safety and reduce operating costs. The market for pneumatic tankers and loading/unloading equipment caters to industries dealing with powders and gases.

In summary, the North America market is a vital player in the global industry, driven by its robust industrial base, advanced infrastructure, and stringent safety regulations. The integration of digital technologies, a focus on safety and driver training, and the adoption of alternative fuels and advanced vehicle technologies are key trends shaping the market's future. Tank trucks are integral to the transportation of hazardous chemicals, petroleum products such as gasoline, diesel, jet fuel, and heating oil, from refineries to retail outlets.

Market Dynamics

Our researchers analyzed the data with 2024 as the base year, along with the key drivers, trends, and challenges. A holistic analysis of drivers will help companies refine their marketing strategies to gain a competitive advantage.

What are the Tank Trucking market drivers leading to the rise in the adoption of Industry?

  • The escalating need for oil and natural gas, driven by increasing global demand, significantly influences the market dynamics. The market is driven by the increasing demand for oil and natural gas, which necessitates the efficient and reliable transportation of these resources. According to industry reports, global oil supply is projected to reach 107.2 million barrels per day by 2030, with liquefied natural gas (LNG) gaining traction in freight and public transport. This growing consumption underscores the importance of a robust logistics infrastructure to transport crude oil, refined products, and LNG from production sites to refineries, storage facilities, and end-users.
  • Driver shortages pose a significant challenge to the tank trucking industry. To mitigate this issue, companies are investing in driver training and management systems, as well as driver assistance systems and tank trailer components that improve fuel efficiency, reduce fuel costs, and enhance emissions control. Additionally, the integration of blockchain technology in the transportation sector is expected to streamline operations, improve transparency, and ensure regulatory compliance. Overall, the market is poised for growth, driven by the critical role it plays in the global energy supply chain.

What are the Tank Trucking market trends shaping the Industry?

  • The trend in the market is being driven by technological advancements, which are fostering growth. Technological innovations are mandated to fuel market expansion in the current business landscape. Tank trucking is undergoing significant transformations due to technological advancements. Manufacturers are prioritizing safety regulations by integrating advanced safety features, such as safety valves and autonomous driving systems, into tank trucks. This enhances safety and reduces the risk of accidents. Additionally, insurers are considering these safety features when calculating insurance costs for tank trucking companies. In terms of design, there is a shift towards lightweight and corrosion-resistant materials, like advanced aluminum alloys and composite materials, for tank truck components and parts. This not only reduces vehicle weight, increasing payload capacity, but also lowers fuel consumption and transportation costs.
  • For instance, aluminum alloy tank trucks can reduce vehicle weight by approximately 30-40% compared to traditional carbon steel tank trucks, significantly improving fuel efficiency and operational performance. Moreover, sustainability initiatives are gaining importance in the tank trucking industry. Companies are focusing on reducing empty miles, optimizing load planning, and implementing refrigeration units to maintain temperature-sensitive cargo. These efforts help minimize the carbon footprint and greenhouse gas emissions of tank trucks, contributing to a more eco-friendly transportation sector. Maintenance scheduling and fleet management are also becoming more sophisticated with the use of technology. Real-time monitoring systems and predictive analytics help tank trucking companies identify potential maintenance issues before they become major problems, reducing downtime and improving overall fleet performance.

How does Tank Trucking market face challenges during its growth?

  • The transportation of oil and gas is hindered by leakage issues, which represent a significant challenge to the industry's growth and sustainability. Tank trucking is a crucial segment of the oil and gas industry's logistics network, responsible for transporting refined petroleum products from refineries to retail fuel outlets. Tank trucks, including pneumatic tankers, play a significant role in this process. However, the transportation of these volatile substances comes with inherent risks, such as oil spills, particularly during loading and unloading operations. To mitigate these risks, various technologies and regulations are in place. For instance, pressure gauges monitor the tank's internal pressure to prevent overfilling, while dispatch software optimizes routes for maximum capacity utilization. Logistics software assists in managing loading and unloading equipment, ensuring efficient operations.
  • Route optimization algorithms minimize travel distances, reducing fuel consumption and operating costs. Temperature-controlled transport is essential for specific petroleum products, requiring temperature monitoring systems and adherence to strict cleaning procedures. Data analytics tools help monitor and analyze performance data, ensuring regulatory compliance and continuous improvement. The payload capacity of tank trucks is a critical factor, with larger capacities reducing the number of trips required, thus lowering overall operating costs.

Exclusive Customer Landscape

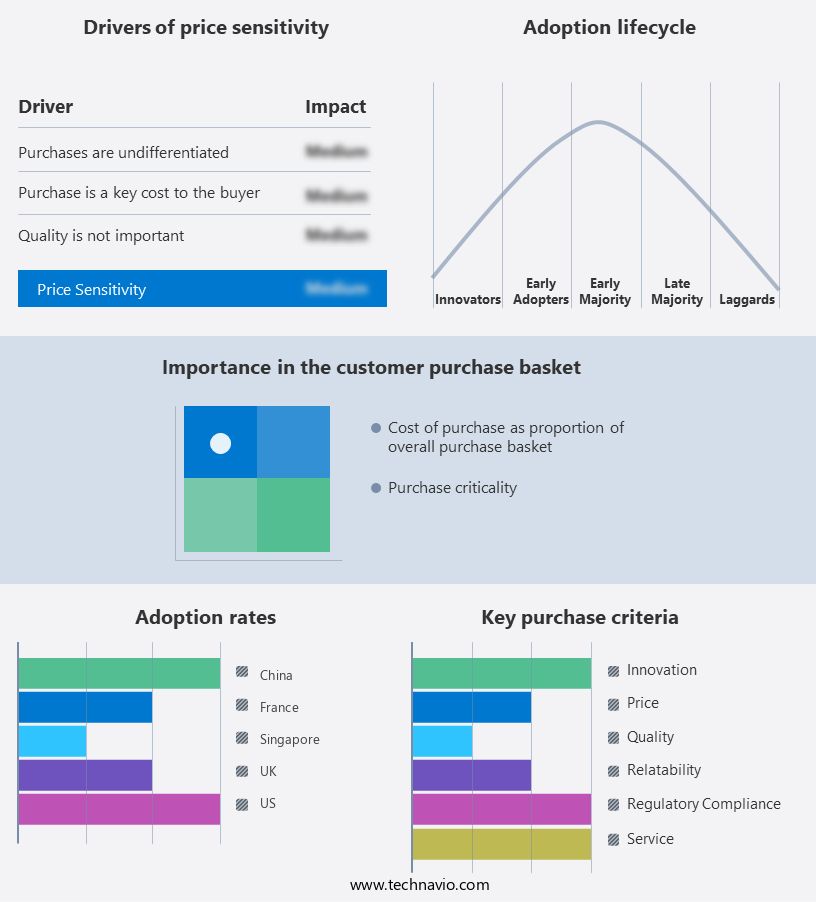
The tank trucking market forecasting report includes the adoption lifecycle of the market, covering from the innovator's stage to the laggard's stage. It focuses on adoption rates in different regions based on penetration. Furthermore, the tank trucking market report also includes key purchase criteria and drivers of price sensitivity to help companies evaluate and develop their market growth analysis strategies.

Tank Trucking Market Share by Geography

 Customer Landscape

Key Companies & Market Insights

Companies are implementing various strategies, such as strategic alliances, tank trucking market forecast, partnerships, mergers and acquisitions, geographical expansion, and product/service launches, to enhance their presence in the industry.

Amthor International - This company specializes in providing top-tier tank trucking services, encompassing Monarch and Cardinal transport solutions.

The industry research and growth report includes detailed analyses of the competitive landscape of the market and information about key companies, including:

  • Amthor International
  • Burch Tank and Truck
  • Dupre Logistics LLC
  • Eagle Transport Corp.
  • Florida Rock and Tank Lines Inc.
  • Groendyke Transport Inc.
  • Kenan Advantage Group Inc.
  • Littlejohn Inc.
  • Mac Trailer Manufacturing Inc.
  • Martin Transport Inc.
  • Miller Transporters Inc.
  • Quest Liner Inc.
  • Ruan Transportation Management Systems
  • Shiny Shipping and Logistics Pvt. Ltd.
  • Superior Bulk Logistics Inc.
  • Superior Industries Inc.
  • Tankstar USA Inc.
  • TFI International Inc.
  • Trimac Transportation Services Inc.

Qualitative and quantitative analysis of companies has been conducted to help clients understand the wider business environment as well as the strengths and weaknesses of key industry players. Data is qualitatively analyzed to categorize companies as pure play, category-focused, industry-focused, and diversified; it is quantitatively analyzed to categorize companies as dominant, leading, strong, tentative, and weak.

Recent Development and News in Tank Trucking Market

  • In January 2024, leading tank trucking company, XYZ Transport, announced the launch of its new, eco-friendly fleet of LNG-powered tank trucks. This strategic move aimed to reduce the carbon footprint of their operations and cater to the growing demand for sustainable transportation solutions (XYZ Transport Press Release).
  • In March 2024, ABC Tankers and DEF Logistics formed a strategic partnership to expand their combined reach in the European market. This collaboration allowed ABC Tankers to access DEF Logistics' extensive network in Eastern Europe, while DEF Logistics gained access to ABC Tankers' advanced technology and expertise (ABC Tankers-DEF Logistics Press Release).
  • In May 2025, Global Tanking Solutions raised a series C funding round of USD 50 million from leading investors. This investment will be used to expand their operations in the Asia-Pacific region and further develop their proprietary tank truck monitoring and optimization technology (Global Tanking Solutions Press Release).

Research Analyst Overview

The market continues to evolve, shaped by dynamic market conditions and diverse applications across various sectors. Entities operating in this domain face a complex web of challenges, including safety regulations, insurance costs, and the integration of advanced technologies. Dry bulk tankers and fuel tankers navigate the intricacies of sanitation standards and hazardous materials transport, while specialized tankers require meticulous maintenance scheduling and safety valve checks. The carbon footprint and greenhouse gas emissions of tank trucks are under increasing scrutiny, driving the adoption of alternative fuels and sustainable initiatives. Autonomous driving technology and digital freight matching are transforming the industry, optimizing network operations and addressing driver shortages.

Hybrid and electric trucks, along with GPS tracking and driver assistance systems, contribute to improved fuel efficiency and emissions control. Load planning and refrigeration units are essential components of temperature-controlled transport, ensuring the safe and timely delivery of perishable goods. Freight management systems, dispatch software, and capacity utilization tools enable entities to optimize their operations and reduce empty miles. The market is a constantly unfolding landscape, where entities must stay agile and adapt to the evolving market dynamics. Pressure gauges, loading/unloading equipment, and route optimization software are integral to maintaining optimal performance and regulatory compliance. The parts supply chain, fuel systems, and driver management systems are crucial elements of a successful tank trucking operation.

Dive into Technavio's robust research methodology, blending expert interviews, extensive data synthesis, and validated models for unparalleled Tank Trucking Market insights. See full methodology.

Market Scope

Report Coverage

Details

Page number

203

Base year

2024

Historic period

2019-2023

Forecast period

2025-2029

Growth momentum & CAGR

Accelerate at a CAGR of 8.5%

Market growth 2025-2029

USD 134.2 billion

Market structure

Fragmented

YoY growth 2024-2025(%)

7.7

Key countries

US, UK, China, Canada, France, Singapore, India, Germany, Italy, and Spain

Competitive landscape

Leading Companies, Market Positioning of Companies, Competitive Strategies, and Industry Risks

Request Free Sample

What are the Key Data Covered in this Tank Trucking Market Research and Growth Report?

  • CAGR of the Tank Trucking industry during the forecast period
  • Detailed information on factors that will drive the growth and forecasting between 2025 and 2029
  • Precise estimation of the size of the market and its contribution of the industry in focus to the parent market
  • Accurate predictions about upcoming growth and trends and changes in consumer behaviour
  • Growth of the market across North America, Europe, APAC, South America, and Middle East and Africa
  • Thorough analysis of the market's competitive landscape and detailed information about companies
  • Comprehensive analysis of factors that will challenge the tank trucking market growth of industry companies

We can help! Our analysts can customize this tank trucking market research report to meet your requirements.

Get in touch

1 Executive Summary

  • 1.1 Market overview
    • Executive Summary - Chart on Market Overview
    • Executive Summary - Data Table on Market Overview
    • Executive Summary - Chart on Global Market Characteristics
    • Executive Summary - Chart on Market by Geography
    • Executive Summary - Chart on Market Segmentation by Ownership
    • Executive Summary - Chart on Market Segmentation by Capacity
    • Executive Summary - Chart on Market Segmentation by Application
    • Executive Summary - Chart on Incremental Growth
    • Executive Summary - Data Table on Incremental Growth
    • Executive Summary - Chart on Company Market Positioning

2 Technavio Analysis

  • 2.1 Analysis of price sensitivity, lifecycle, customer purchase basket, adoption rates, and purchase criteria
    • Analysis of price sensitivity, lifecycle, customer purchase basket, adoption rates, and purchase criteria
  • 2.2 Criticality of inputs and Factors of differentiation
    • Overview on criticality of inputs and factors of differentiation
  • 2.3 Factors of disruption
    • Overview on factors of disruption
  • 2.4 Impact of drivers and challenges
    • Impact of drivers and challenges in 2024 and 2029

3 Market Landscape

  • 3.1 Market ecosystem
    • Parent Market
    • Data Table on - Parent Market
  • 3.2 Market characteristics
    • Market characteristics analysis
  • 3.3 Value chain analysis
    • Value chain analysis

4 Market Sizing

  • 4.1 Market definition
    • Offerings of companies included in the market definition
  • 4.2 Market segment analysis
    • Market segments
  • 4.3 Market size 2024
    • 4.4 Market outlook: Forecast for 2024-2029
      • Chart on Global - Market size and forecast 2024-2029 ($ billion)
      • Data Table on Global - Market size and forecast 2024-2029 ($ billion)
      • Chart on Global Market: Year-over-year growth 2024-2029 (%)
      • Data Table on Global Market: Year-over-year growth 2024-2029 (%)

    5 Historic Market Size

    • 5.1 Global Tank Trucking Market 2019 - 2023
      • Historic Market Size - Data Table on Global Tank Trucking Market 2019 - 2023 ($ billion)
    • 5.2 Ownership segment analysis 2019 - 2023
      • Historic Market Size - Ownership Segment 2019 - 2023 ($ billion)
    • 5.3 Capacity segment analysis 2019 - 2023
      • Historic Market Size - Capacity Segment 2019 - 2023 ($ billion)
    • 5.4 Application segment analysis 2019 - 2023
      • Historic Market Size - Application Segment 2019 - 2023 ($ billion)
    • 5.5 Geography segment analysis 2019 - 2023
      • Historic Market Size - Geography Segment 2019 - 2023 ($ billion)
    • 5.6 Country segment analysis 2019 - 2023
      • Historic Market Size - Country Segment 2019 - 2023 ($ billion)

    6 Qualitative Analysis

    • 6.1 The AI impact on Global Tank Trucking Market

      7 Five Forces Analysis

      • 7.1 Five forces summary
        • Five forces analysis - Comparison between 2024 and 2029
      • 7.2 Bargaining power of buyers
        • Bargaining power of buyers - Impact of key factors 2024 and 2029
      • 7.3 Bargaining power of suppliers
        • Bargaining power of suppliers - Impact of key factors in 2024 and 2029
      • 7.4 Threat of new entrants
        • Threat of new entrants - Impact of key factors in 2024 and 2029
      • 7.5 Threat of substitutes
        • Threat of substitutes - Impact of key factors in 2024 and 2029
      • 7.6 Threat of rivalry
        • Threat of rivalry - Impact of key factors in 2024 and 2029
      • 7.7 Market condition
        • Chart on Market condition - Five forces 2024 and 2029

      8 Market Segmentation by Ownership

      • 8.1 Market segments
        • Chart on Ownership - Market share 2024-2029 (%)
        • Data Table on Ownership - Market share 2024-2029 (%)
      • 8.2 Comparison by Ownership
        • Chart on Comparison by Ownership
        • Data Table on Comparison by Ownership
      • 8.3 For hire - Market size and forecast 2024-2029
        • Chart on For hire - Market size and forecast 2024-2029 ($ billion)
        • Data Table on For hire - Market size and forecast 2024-2029 ($ billion)
        • Chart on For hire - Year-over-year growth 2024-2029 (%)
        • Data Table on For hire - Year-over-year growth 2024-2029 (%)
      • 8.4 Private - Market size and forecast 2024-2029
        • Chart on Private - Market size and forecast 2024-2029 ($ billion)
        • Data Table on Private - Market size and forecast 2024-2029 ($ billion)
        • Chart on Private - Year-over-year growth 2024-2029 (%)
        • Data Table on Private - Year-over-year growth 2024-2029 (%)
      • 8.5 Market opportunity by Ownership
        • Market opportunity by Ownership ($ billion)
        • Data Table on Market opportunity by Ownership ($ billion)

      9 Market Segmentation by Capacity

      • 9.1 Market segments
        • Chart on Capacity - Market share 2024-2029 (%)
        • Data Table on Capacity - Market share 2024-2029 (%)
      • 9.2 Comparison by Capacity
        • Chart on Comparison by Capacity
        • Data Table on Comparison by Capacity
      • 9.3 Medium duty - Market size and forecast 2024-2029
        • Chart on Medium duty - Market size and forecast 2024-2029 ($ billion)
        • Data Table on Medium duty - Market size and forecast 2024-2029 ($ billion)
        • Chart on Medium duty - Year-over-year growth 2024-2029 (%)
        • Data Table on Medium duty - Year-over-year growth 2024-2029 (%)
      • 9.4 Heavy duty - Market size and forecast 2024-2029
        • Chart on Heavy duty - Market size and forecast 2024-2029 ($ billion)
        • Data Table on Heavy duty - Market size and forecast 2024-2029 ($ billion)
        • Chart on Heavy duty - Year-over-year growth 2024-2029 (%)
        • Data Table on Heavy duty - Year-over-year growth 2024-2029 (%)
      • 9.5 Light duty - Market size and forecast 2024-2029
        • Chart on Light duty - Market size and forecast 2024-2029 ($ billion)
        • Data Table on Light duty - Market size and forecast 2024-2029 ($ billion)
        • Chart on Light duty - Year-over-year growth 2024-2029 (%)
        • Data Table on Light duty - Year-over-year growth 2024-2029 (%)
      • 9.6 Market opportunity by Capacity
        • Market opportunity by Capacity ($ billion)
        • Data Table on Market opportunity by Capacity ($ billion)

      10 Market Segmentation by Application

      • 10.1 Market segments
        • Chart on Application - Market share 2024-2029 (%)
        • Data Table on Application - Market share 2024-2029 (%)
      • 10.2 Comparison by Application
        • Chart on Comparison by Application
        • Data Table on Comparison by Application
      • 10.3 Oil and gas - Market size and forecast 2024-2029
        • Chart on Oil and gas - Market size and forecast 2024-2029 ($ billion)
        • Data Table on Oil and gas - Market size and forecast 2024-2029 ($ billion)
        • Chart on Oil and gas - Year-over-year growth 2024-2029 (%)
        • Data Table on Oil and gas - Year-over-year growth 2024-2029 (%)
      • 10.4 Chemicals - Market size and forecast 2024-2029
        • Chart on Chemicals - Market size and forecast 2024-2029 ($ billion)
        • Data Table on Chemicals - Market size and forecast 2024-2029 ($ billion)
        • Chart on Chemicals - Year-over-year growth 2024-2029 (%)
        • Data Table on Chemicals - Year-over-year growth 2024-2029 (%)
      • 10.5 Food and beverage - Market size and forecast 2024-2029
        • Chart on Food and beverage - Market size and forecast 2024-2029 ($ billion)
        • Data Table on Food and beverage - Market size and forecast 2024-2029 ($ billion)
        • Chart on Food and beverage - Year-over-year growth 2024-2029 (%)
        • Data Table on Food and beverage - Year-over-year growth 2024-2029 (%)
      • 10.6 Agriculture - Market size and forecast 2024-2029
        • Chart on Agriculture - Market size and forecast 2024-2029 ($ billion)
        • Data Table on Agriculture - Market size and forecast 2024-2029 ($ billion)
        • Chart on Agriculture - Year-over-year growth 2024-2029 (%)
        • Data Table on Agriculture - Year-over-year growth 2024-2029 (%)
      • 10.7 Others - Market size and forecast 2024-2029
        • Chart on Others - Market size and forecast 2024-2029 ($ billion)
        • Data Table on Others - Market size and forecast 2024-2029 ($ billion)
        • Chart on Others - Year-over-year growth 2024-2029 (%)
        • Data Table on Others - Year-over-year growth 2024-2029 (%)
      • 10.8 Market opportunity by Application
        • Market opportunity by Application ($ billion)
        • Data Table on Market opportunity by Application ($ billion)

      11 Customer Landscape

      • 11.1 Customer landscape overview
        • Analysis of price sensitivity, lifecycle, customer purchase basket, adoption rates, and purchase criteria

      12 Geographic Landscape

      • 12.1 Geographic segmentation
        • Chart on Market share by geography 2024-2029 (%)
        • Data Table on Market share by geography 2024-2029 (%)
      • 12.2 Geographic comparison
        • Chart on Geographic comparison
        • Data Table on Geographic comparison
      • 12.3 North America - Market size and forecast 2024-2029
        • Chart on North America - Market size and forecast 2024-2029 ($ billion)
        • Data Table on North America - Market size and forecast 2024-2029 ($ billion)
        • Chart on North America - Year-over-year growth 2024-2029 (%)
        • Data Table on North America - Year-over-year growth 2024-2029 (%)
      • 12.4 Europe - Market size and forecast 2024-2029
        • Chart on Europe - Market size and forecast 2024-2029 ($ billion)
        • Data Table on Europe - Market size and forecast 2024-2029 ($ billion)
        • Chart on Europe - Year-over-year growth 2024-2029 (%)
        • Data Table on Europe - Year-over-year growth 2024-2029 (%)
      • 12.5 APAC - Market size and forecast 2024-2029
        • Chart on APAC - Market size and forecast 2024-2029 ($ billion)
        • Data Table on APAC - Market size and forecast 2024-2029 ($ billion)
        • Chart on APAC - Year-over-year growth 2024-2029 (%)
        • Data Table on APAC - Year-over-year growth 2024-2029 (%)
      • 12.6 South America - Market size and forecast 2024-2029
        • Chart on South America - Market size and forecast 2024-2029 ($ billion)
        • Data Table on South America - Market size and forecast 2024-2029 ($ billion)
        • Chart on South America - Year-over-year growth 2024-2029 (%)
        • Data Table on South America - Year-over-year growth 2024-2029 (%)
      • 12.7 Middle East and Africa - Market size and forecast 2024-2029
        • Chart on Middle East and Africa - Market size and forecast 2024-2029 ($ billion)
        • Data Table on Middle East and Africa - Market size and forecast 2024-2029 ($ billion)
        • Chart on Middle East and Africa - Year-over-year growth 2024-2029 (%)
        • Data Table on Middle East and Africa - Year-over-year growth 2024-2029 (%)
      • 12.8 US - Market size and forecast 2024-2029
        • Chart on US - Market size and forecast 2024-2029 ($ billion)
        • Data Table on US - Market size and forecast 2024-2029 ($ billion)
        • Chart on US - Year-over-year growth 2024-2029 (%)
        • Data Table on US - Year-over-year growth 2024-2029 (%)
      • 12.9 UK - Market size and forecast 2024-2029
        • Chart on UK - Market size and forecast 2024-2029 ($ billion)
        • Data Table on UK - Market size and forecast 2024-2029 ($ billion)
        • Chart on UK - Year-over-year growth 2024-2029 (%)
        • Data Table on UK - Year-over-year growth 2024-2029 (%)
      • 12.10 China - Market size and forecast 2024-2029
        • Chart on China - Market size and forecast 2024-2029 ($ billion)
        • Data Table on China - Market size and forecast 2024-2029 ($ billion)
        • Chart on China - Year-over-year growth 2024-2029 (%)
        • Data Table on China - Year-over-year growth 2024-2029 (%)
      • 12.11 France - Market size and forecast 2024-2029
        • Chart on France - Market size and forecast 2024-2029 ($ billion)
        • Data Table on France - Market size and forecast 2024-2029 ($ billion)
        • Chart on France - Year-over-year growth 2024-2029 (%)
        • Data Table on France - Year-over-year growth 2024-2029 (%)
      • 12.12 Canada - Market size and forecast 2024-2029
        • Chart on Canada - Market size and forecast 2024-2029 ($ billion)
        • Data Table on Canada - Market size and forecast 2024-2029 ($ billion)
        • Chart on Canada - Year-over-year growth 2024-2029 (%)
        • Data Table on Canada - Year-over-year growth 2024-2029 (%)
      • 12.13 Singapore - Market size and forecast 2024-2029
        • Chart on Singapore - Market size and forecast 2024-2029 ($ billion)
        • Data Table on Singapore - Market size and forecast 2024-2029 ($ billion)
        • Chart on Singapore - Year-over-year growth 2024-2029 (%)
        • Data Table on Singapore - Year-over-year growth 2024-2029 (%)
      • 12.14 Germany - Market size and forecast 2024-2029
        • Chart on Germany - Market size and forecast 2024-2029 ($ billion)
        • Data Table on Germany - Market size and forecast 2024-2029 ($ billion)
        • Chart on Germany - Year-over-year growth 2024-2029 (%)
        • Data Table on Germany - Year-over-year growth 2024-2029 (%)
      • 12.15 India - Market size and forecast 2024-2029
        • Chart on India - Market size and forecast 2024-2029 ($ billion)
        • Data Table on India - Market size and forecast 2024-2029 ($ billion)
        • Chart on India - Year-over-year growth 2024-2029 (%)
        • Data Table on India - Year-over-year growth 2024-2029 (%)
      • 12.16 Italy - Market size and forecast 2024-2029
        • Chart on Italy - Market size and forecast 2024-2029 ($ billion)
        • Data Table on Italy - Market size and forecast 2024-2029 ($ billion)
        • Chart on Italy - Year-over-year growth 2024-2029 (%)
        • Data Table on Italy - Year-over-year growth 2024-2029 (%)
      • 12.17 Spain - Market size and forecast 2024-2029
        • Chart on Spain - Market size and forecast 2024-2029 ($ billion)
        • Data Table on Spain - Market size and forecast 2024-2029 ($ billion)
        • Chart on Spain - Year-over-year growth 2024-2029 (%)
        • Data Table on Spain - Year-over-year growth 2024-2029 (%)
      • 12.18 Market opportunity by geography
        • Market opportunity by geography ($ billion)
        • Data Tables on Market opportunity by geography ($ billion)

      13 Drivers, Challenges, and Opportunity/Restraints

      • 13.1 Market drivers
        • 13.2 Market challenges
          • 13.3 Impact of drivers and challenges
            • Impact of drivers and challenges in 2024 and 2029
          • 13.4 Market opportunities/restraints

            14 Competitive Landscape

            • 14.1 Overview
              • 14.2 Competitive Landscape
                • Overview on criticality of inputs and factors of differentiation
              • 14.3 Landscape disruption
                • Overview on factors of disruption
              • 14.4 Industry risks
                • Impact of key risks on business

              15 Competitive Analysis

              • 15.1 Companies profiled
                • Companies covered
              • 15.2 Company ranking index
                • Company ranking index
              • 15.3 Market positioning of companies
                • Matrix on companies position and classification
              • 15.4 Amthor International
                • Amthor International - Overview
                • Amthor International - Product / Service
                • Amthor International - Key offerings
                • SWOT
              • 15.5 Dupre Logistics LLC
                • Dupre Logistics LLC - Overview
                • Dupre Logistics LLC - Product / Service
                • Dupre Logistics LLC - Key offerings
                • SWOT
              • 15.6 Eagle Transport Corp.
                • Eagle Transport Corp. - Overview
                • Eagle Transport Corp. - Product / Service
                • Eagle Transport Corp. - Key offerings
                • SWOT
              • 15.7 Florida Rock and Tank Lines Inc.
                • Florida Rock and Tank Lines Inc. - Overview
                • Florida Rock and Tank Lines Inc. - Product / Service
                • Florida Rock and Tank Lines Inc. - Key offerings
                • SWOT
              • 15.8 Groendyke Transport Inc.
                • Groendyke Transport Inc. - Overview
                • Groendyke Transport Inc. - Product / Service
                • Groendyke Transport Inc. - Key offerings
                • SWOT
              • 15.9 Kenan Advantage Group Inc.
                • Kenan Advantage Group Inc. - Overview
                • Kenan Advantage Group Inc. - Product / Service
                • Kenan Advantage Group Inc. - Key offerings
                • SWOT
              • 15.10 Littlejohn Inc.
                • Littlejohn Inc. - Overview
                • Littlejohn Inc. - Product / Service
                • Littlejohn Inc. - Key offerings
                • SWOT
              • 15.11 Mac Trailer Manufacturing Inc.
                • Mac Trailer Manufacturing Inc. - Overview
                • Mac Trailer Manufacturing Inc. - Product / Service
                • Mac Trailer Manufacturing Inc. - Key offerings
                • SWOT
              • 15.12 Martin Transport Inc.
                • Martin Transport Inc. - Overview
                • Martin Transport Inc. - Product / Service
                • Martin Transport Inc. - Key offerings
                • SWOT
              • 15.13 Miller Transporters Inc.
                • Miller Transporters Inc. - Overview
                • Miller Transporters Inc. - Product / Service
                • Miller Transporters Inc. - Key offerings
                • SWOT
              • 15.14 Quest Liner Inc.
                • Quest Liner Inc. - Overview
                • Quest Liner Inc. - Product / Service
                • Quest Liner Inc. - Key offerings
                • SWOT
              • 15.15 Ruan Transportation Management Systems
                • Ruan Transportation Management Systems - Overview
                • Ruan Transportation Management Systems - Product / Service
                • Ruan Transportation Management Systems - Key offerings
                • SWOT
              • 15.16 Superior Bulk Logistics Inc.
                • Superior Bulk Logistics Inc. - Overview
                • Superior Bulk Logistics Inc. - Product / Service
                • Superior Bulk Logistics Inc. - Key offerings
                • SWOT
              • 15.17 Tankstar USA Inc.
                • Tankstar USA Inc. - Overview
                • Tankstar USA Inc. - Product / Service
                • Tankstar USA Inc. - Key offerings
                • SWOT
              • 15.18 Trimac Transportation Services Inc.
                • Trimac Transportation Services Inc. - Overview
                • Trimac Transportation Services Inc. - Product / Service
                • Trimac Transportation Services Inc. - Key offerings
                • SWOT

              16 Appendix

              • 16.1 Scope of the report
                • 16.2 Inclusions and exclusions checklist
                  • Inclusions checklist
                  • Exclusions checklist
                • 16.3 Currency conversion rates for US$
                  • Currency conversion rates for US$
                • 16.4 Research methodology
                  • Research methodology
                • 16.5 Data procurement
                  • Information sources
                • 16.6 Data validation
                  • Data validation
                • 16.7 Validation techniques employed for market sizing
                  • Validation techniques employed for market sizing
                • 16.8 Data synthesis
                  • Data synthesis
                • 16.9 360 degree market analysis
                  • 360 degree market analysis
                • 16.10 List of abbreviations
                  • List of abbreviations

                Research Methodology

                Technavio presents a detailed picture of the market by way of study, synthesis, and summation of data from multiple sources. The analysts have presented the various facets of the market with a particular focus on identifying the key industry influencers. The data thus presented is comprehensive, reliable, and the result of extensive research, both primary and secondary.

                INFORMATION SOURCES

                Primary sources

                • Manufacturers and suppliers
                • Channel partners
                • Industry experts
                • Strategic decision makers

                Secondary sources

                • Industry journals and periodicals
                • Government data
                • Financial reports of key industry players
                • Historical data
                • Press releases

                DATA ANALYSIS

                Data Synthesis

                • Collation of data
                • Estimation of key figures
                • Analysis of derived insights

                Data Validation

                • Triangulation with data models
                • Reference against proprietary databases
                • Corroboration with industry experts

                REPORT WRITING

                Qualitative

                • Market drivers
                • Market challenges
                • Market trends
                • Five forces analysis

                Quantitative

                • Market size and forecast
                • Market segmentation
                • Geographical insights
                • Competitive landscape

                Interested in this report?

                Get your sample now to see our research methodology and insights!

                Download Now

                Frequently Asked Questions

                Tank Trucking market growth will increase by $ 134.2 bn during 2025-2029.

                The Tank Trucking market is expected to grow at a CAGR of 8.5% during 2025-2029.

                Tank Trucking market is segmented by Ownership( For hire, Private, APAC, South America, Middle East and Africa) Capacity( Medium duty, Heavy duty, Light duty, South America, Middle East and Africa) Application( Oil and gas, Chemicals, Food and beverage, Agriculture, Others)

                Amthor International, Burch Tank and Truck, Dupre Logistics LLC, Eagle Transport Corp., Florida Rock and Tank Lines Inc., Groendyke Transport Inc., Kenan Advantage Group Inc., Littlejohn Inc., Mac Trailer Manufacturing Inc., Martin Transport Inc., Miller Transporters Inc., Quest Liner Inc., Ruan Transportation Management Systems, Shiny Shipping and Logistics Pvt. Ltd., Superior Bulk Logistics Inc., Superior Industries Inc., Tankstar USA Inc., TFI International Inc., Trimac Transportation Services Inc. are a few of the key vendors in the Tank Trucking market.

                North America will register the highest growth rate of 34% among the other regions. Therefore, the Tank Trucking market in North America is expected to garner significant business opportunities for the vendors during the forecast period.

                US, UK, China, Canada, France, Singapore, India, Germany, Italy, Spain

                • Growing demand for oil and natural gasThe growing global demand for oil and natural gas is a significant driver of the tank trucking market is the driving factor this market.
                • as it directly influences the need for efficient and reliable transportation of these critical energy resources. As industrialization and urbanization intensify across emerging economies is the driving factor this market.
                • global demand for oil and gas continues to rise is the driving factor this market.
                • driven by expanding needs in power generation is the driving factor this market.
                • manufacturing is the driving factor this market.
                • and transportation. Despite some moderation due to economic and geopolitical factors is the driving factor this market.
                • oil supply is projected to reach 107.2 million barrels per day by 2030 is the driving factor this market.
                • with liquefied natural gas (LNG) gaining traction in freight and public transport. This growing consumption highlights the importance of a robust logistics infrastructure to transport crude oil is the driving factor this market.
                • refined products is the driving factor this market.
                • and LNG from production sites to refineries is the driving factor this market.
                • storage facilities is the driving factor this market.
                • and end-users. In areas lacking sufficient pipeline networks is the driving factor this market.
                • tank trucks remain indispensable is the driving factor this market.
                • offering critical flexibility and last-mile connectivity in the energy supply chain. Additionally is the driving factor this market.
                • geopolitical factors and the shift toward energy security have led countries to diversify their energy sources and build strategic reserves is the driving factor this market.
                • further boosting the need for tank trucking services. The market is also benefiting from technological advancements in fleet management and safety systems is the driving factor this market.
                • which enhance operational efficiency and regulatory compliance. Moreover is the driving factor this market.
                • the expansion of shale gas exploration and offshore drilling activities is the driving factor this market.
                • especially in North America and parts of Asia-Pacific is the driving factor this market.
                • is creating new opportunities for tank truck operators. Owing to such factors is the driving factor this market.
                • the global tank trucking market is expected to witness growth during the forecast period. is the driving factor this market.

                The Tank Trucking market vendors should focus on grabbing business opportunities from the For hire segment as it accounted for the largest market share in the base year.