Structural Health Monitoring Market Analysis, Size, and Forecast 2025-2029: North America (US and Canada), Europe (France, Germany, Italy, UK), APAC (China, India, Japan, South Korea), South America , and Middle East and Africa

Structural Health Monitoring Market Analysis, Size, and Forecast 2025-2029:
North America (US and Canada), Europe (France, Germany, Italy, UK), APAC (China, India, Japan, South Korea), South America , and Middle East and Africa

Published: Mar 2025 209 Pages SKU: IRTNTR75697

Market Overview at a Glance

$4.13 B
Market Opportunity
20%
CAGR
15.7
YoY growth 2024-2025(%)

Structural Health Monitoring Market Size 2025-2029

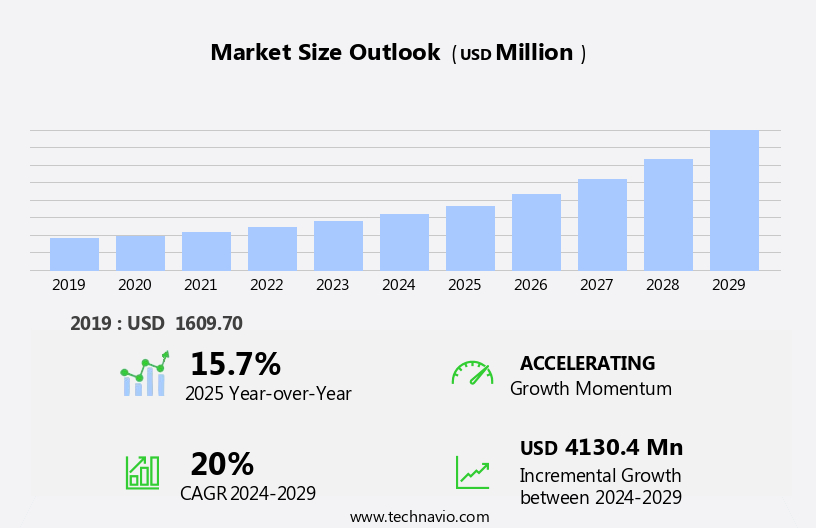
The structural health monitoring market size is forecast to increase by USD 4.13 billion, at a CAGR of 20% between 2024 and 2029.

  • The Structural Health Monitoring (SHM) market is experiencing significant growth, driven by the increasing need for infrastructure maintenance and safety. With the aging infrastructure worldwide, there is a growing awareness of the importance of proactively monitoring the condition of structures to ensure their longevity and safety. This is particularly relevant in industries such as construction, transportation, and energy, where the consequences of structural failure can be catastrophic. Another key driver for the SHM market is the advent of Internet of Things (IoT) technology. IoT sensors enable real-time monitoring of structural health, providing valuable data for predictive maintenance and early detection of potential issues.
  • This not only enhances safety but also reduces downtime and maintenance costs. However, the market faces challenges, including budgetary constraints, which can limit the adoption of SHM systems, particularly in smaller organizations and projects. Despite this, the potential benefits of SHM are compelling, making it an attractive area for investment and innovation. Companies seeking to capitalize on this market opportunity should focus on developing cost-effective solutions that provide real-time data and actionable insights, while also addressing the challenges of installation, integration, and maintenance.

What will be the Size of the Structural Health Monitoring Market during the forecast period?

Structural Health Monitoring Market Size

Explore in-depth regional segment analysis with market size data - historical 2019-2023 and forecasts 2025-2029 - in the full report.  
Request Free Sample

The structural health monitoring (SHM) market continues to evolve, driven by the increasing demand for real-time monitoring and condition-based maintenance in various sectors. Environmental factors, such as humidity and temperature effects, significantly impact the structural integrity of buildings, civil infrastructure, offshore structures, and aerospace structures. SHM applications extend to damage identification, data acquisition systems, and decision support systems, which utilize advanced software algorithms, machine learning, and sensor fusion. Cloud-based platforms facilitate remote monitoring and data visualization, enabling asset management and cost optimization. Low-power sensors and wireless communication enable the deployment of SHM systems in remote and hard-to-reach locations. Vibration monitoring, acoustic emission testing, and fiber optic sensors are integral to the early detection of cracks and fatigue analysis.

Power plants and industrial facilities require continuous monitoring for data validation, quality control, and risk assessment. SHM systems ensure data integrity and long-term stability, providing valuable insights for maintenance procedures and life cycle assessment. Sensor reliability, accuracy, and integration are crucial considerations for effective SHM implementation. Data security and expert systems are essential components of SHM systems, ensuring the confidentiality and authenticity of data. The ongoing development of SHM technologies offers significant potential for the monitoring of tunnels, pipelines, bridges, wind turbines, and nuclear power plants. The evolving market dynamics reflect the continuous unfolding of innovative applications and solutions in the realm of structural health monitoring.

How is this Structural Health Monitoring Industry segmented?

The structural health monitoring industry research report provides comprehensive data (region-wise segment analysis), with forecasts and estimates in "USD million" for the period 2025-2029, as well as historical data from 2019-2023 for the following segments.

  • Component
    • Hardware
    • Software
    • Services
  • Connectivity
    • Wired
    • Wireless
  • Application
    • Civil infrastructure
    • Aerospace
    • Energy
    • Defense
    • Others
  • Geography
    • North America
      • US
      • Canada
    • Europe
      • France
      • Germany
      • Italy
      • UK
    • APAC
      • China
      • India
      • Japan
      • South Korea
    • Rest of World (ROW)

    By Component Insights

    The hardware segment is estimated to witness significant growth during the forecast period.

    The market encompasses various sectors, with hardware being a significant component. Hardware in this context refers to the physical devices and instruments used to assess the structural health of infrastructure, buildings, bridges, and other civil structures. Sensors are a vital hardware segment, as they capture essential data on structural behavior, including strain, vibration, temperature, humidity, and corrosion. Installation techniques are crucial for sensor reliability and accuracy, ensuring proper placement and calibration. Real-time monitoring is facilitated by software algorithms, enabling prompt identification of anomalies and damage. Offshore structures, such as oil rigs and wind turbines, require specialized sensors for monitoring environmental factors like temperature, humidity, and wave action.

    Corrosion monitoring sensors help detect and prevent damage in industrial facilities and civil infrastructure. Strain gauges, a type of sensor, measure deformation and stress in structures, while alert systems provide immediate notifications of potential issues. Cloud-based platforms facilitate data acquisition, storage, and analysis, allowing for big data analytics and machine learning applications. Low-power sensors and wireless communication enable remote monitoring, reducing the need for frequent on-site inspections. Fiber optic sensors offer high precision and long-term stability, making them suitable for applications like bridge monitoring and fatigue analysis. Sensor integration, data security, and expert systems are essential for ensuring data integrity and accurate decision-making.

    Cost optimization and life cycle assessment are crucial considerations in the deployment and maintenance of structural health monitoring systems. Data validation and quality control procedures help maintain sensor accuracy and reliability. Environmental factors, such as temperature and humidity, can impact sensor performance and data interpretation. Damage identification and risk assessment are critical applications of structural health monitoring, with applications ranging from civil infrastructure to aerospace structures and nuclear power plants.

    Structural Health Monitoring Market Size

    Request Free Sample

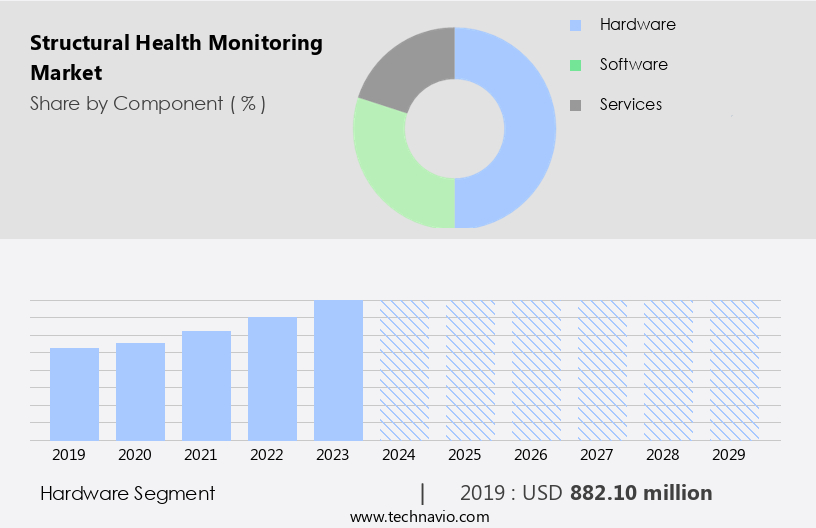
    The Hardware segment was valued at USD 882.10 billion in 2019 and showed a gradual increase during the forecast period.

    Regional Analysis

    North America is estimated to contribute 40% to the growth of the global market during the forecast period.Technavio’s analysts have elaborately explained the regional trends and drivers that shape the market during the forecast period.

    Structural Health Monitoring Market Share by Geography

     Request Free Sample

    The market in North America is experiencing significant growth, driven by several key factors. The increasing adoption of advanced monitoring services by industries such as IT, apparel and textile, FMCG, and consumer durables is a major contributor. These industries are witnessing an expansion in the number of office buildings in regions like the Southeast, Mideast, Far West, Great Lakes, and Southwest. In addition, there is a trend towards replacing conventional management services with third-party structural health monitoring providers. Furthermore, the growth of end-user industries and government initiatives for implementing structural health monitoring are also fueling market growth. Advanced technologies such as artificial intelligence, real-time monitoring, machine learning, and big data analytics are transforming the industry.

    These technologies enable condition-based maintenance, predictive analysis, and remote monitoring, enhancing the overall efficiency and reliability of structures. Installation techniques for sensors, including fiber optic sensors, strain gauges, and acoustic emission testing, are continually improving, ensuring greater sensor reliability. Structural analysis, including temperature effects, humidity effects, and crack detection, is becoming more sophisticated, allowing for early damage identification. Data visualization tools and decision support systems facilitate data interpretation and data-driven insights. Sensor integration, data security, and cost optimization are critical considerations for asset management in various sectors, including civil infrastructure, offshore structures, wind turbines, and industrial facilities. Long-term stability, signal processing, and sensor fusion are essential for ensuring the accuracy and effectiveness of health monitoring systems.

    Nuclear power plants and aerospace structures also benefit from these advanced monitoring solutions. Overall, the market in North America is poised for continued growth, driven by technological advancements, increasing industry adoption, and government initiatives.

    Market Dynamics

    Our researchers analyzed the data with 2024 as the base year, along with the key drivers, trends, and challenges. A holistic analysis of drivers will help companies refine their marketing strategies to gain a competitive advantage.

    The market encompasses innovative technologies and solutions designed to assess the condition of infrastructure assets, ensuring their safety and longevity. This market caters to various industries, including transportation, construction, energy, and civil engineering. Key players offer advanced sensors, monitoring systems, and data analysis tools to detect anomalies, predict failures, and optimize maintenance. Structural health monitoring systems utilize technologies like IoT, AI, and machine learning for real-time data collection and analysis. These solutions enable proactive maintenance, reducing downtime and maintenance costs, while ensuring public safety and infrastructure reliability. Additionally, regulatory compliance, increasing demand for smart infrastructure, and growing awareness of risk mitigation are key market drivers.

    What are the key market drivers leading to the rise in the adoption of Structural Health Monitoring Industry?

    • The escalating demand for infrastructure maintenance and safety measures serves as the primary market catalyst. 

    • The market is experiencing significant growth due to the increasing importance of asset management in various industries, including civil infrastructure, industrial facilities, and renewable energy. Structural health monitoring solutions, such as those used for wind turbines, tunnel monitoring, and pipeline monitoring, leverage advanced technologies like big data analytics, machine learning, and data interpretation to provide real-time data on the condition of critical infrastructure. This data is crucial for maintaining the safety and integrity of these assets, as well as for implementing effective maintenance procedures. Safety concerns are a major driver for the adoption of structural health monitoring systems.
    • Infrastructure failures can result in catastrophic consequences, including loss of life, property damage, and economic disruptions. By continuously monitoring the health of infrastructure, potential issues can be identified and addressed before they escalate into costly and dangerous problems. Additionally, temperature effects and crack detection are critical aspects of structural health monitoring, as they can indicate underlying issues that may lead to infrastructure failure. Machine learning algorithms and data validation techniques are used to ensure the accuracy and reliability of the data generated by these systems. Quality control measures are also essential to ensure that the data is interpreted correctly and that maintenance procedures are carried out effectively.
    • Overall, the market is poised for continued growth as the need for infrastructure maintenance and safety becomes increasingly prioritized.

    What are the market trends shaping the Structural Health Monitoring Industry?

    • The IoT's emergence is shaping the future of structural health monitoring as a significant market trend. In this context, IoT technology enhances infrastructure surveillance, offering enhanced efficiency and accuracy.

    • The market has witnessed significant growth due to the integration of advanced technologies such as Internet of Things (IoT) and Industry 4.0. IoT networks consist of various devices, including sensors, thermostats, and actuators, which are interconnected over the Internet. These devices collect and evaluate data to optimize energy usage and implement predictive maintenance, leading to reduced operational costs and enhanced productivity. Moreover, IoT technologies enable remote monitoring of environmental factors affecting aerospace structures, power plants, and other critical infrastructure. Damage identification is facilitated through techniques such as vibration monitoring, acoustic emission testing, and signal processing. Data acquisition systems and cloud-based platforms ensure data integrity and long-term stability.
    • Sensor fusion and decision support systems further enhance the accuracy and efficiency of damage identification. In summary, the market is driven by the adoption of IoT and Industry 4.0 technologies, which offer benefits such as energy efficiency, predictive maintenance, and remote monitoring. These innovations have transformed the way organizations manage their critical infrastructure, ensuring improved safety, reliability, and sustainability.

    What challenges does the Structural Health Monitoring Industry face during its growth?

    • Budgetary constraints posing a significant challenge, the industry's growth is adversely affected. 

    • Structural health monitoring (SHM) is a critical aspect of maintaining the integrity and safety of infrastructure, particularly in industries such as nuclear power. SHM utilizes advanced technologies like fiber optic sensors for fatigue analysis and expert systems for risk assessment. However, small organizations, even in developed economies, face budgetary constraints that prevent them from procuring services from established SHM providers. This results in the deployment of less accurate sensors and sensor integration challenges, leading to increased maintenance and operation costs.
    • Furthermore, labor costs pose another significant challenge to the growth of the SHM market. To mitigate these issues, organizations are focusing on cost optimization through sensor deployment strategies, life cycle assessment, and data logging using wireless communication and data security measures. These efforts aim to improve overall SHM capabilities while reducing costs and enhancing profitability.

    Exclusive Customer Landscape

    The structural health monitoring market forecasting report includes the adoption lifecycle of the market, covering from the innovator’s stage to the laggard’s stage. It focuses on adoption rates in different regions based on penetration. Furthermore, the structural health monitoring market report also includes key purchase criteria and drivers of price sensitivity to help companies evaluate and develop their market growth analysis strategies.

    Structural Health Monitoring Market Share by Geography

     Customer Landscape

    Key Companies & Market Insights

    Companies are implementing various strategies, such as strategic alliances, structural health monitoring market forecast, partnerships, mergers and acquisitions, geographical expansion, and product/service launches, to enhance their presence in the industry.

    Campbell Scientific Inc. - This company specializes in advanced structural health monitoring, utilizing cutting-edge technologies like the VSPECT system. Our solutions ensure infrastructure durability, enhancing safety and efficiency through real-time data analysis and predictive maintenance.

    The industry research and growth report includes detailed analyses of the competitive landscape of the market and information about key companies, including:

    • Campbell Scientific Inc.
    • CGG SA
    • COWI Holding AS
    • Digitexx Systems Ltd.
    • Geosense Ltd.
    • Hottinger Bruel and Kjaer GmbH
    • James Fisher and Sons Plc
    • Kinemetrics Inc.
    • LiveHooah Technologies Pvt. Ltd.
    • MachineSense LLC
    • Mistras Group Inc.
    • National Instruments Corp.
    • Nova Ventures Group Corp.
    • Ramboll Group AS
    • RST Instruments Ltd.
    • Sisgeo S.r.l.
    • STRUCTURAL MONITORING SYSTEMS plc
    • Vinci
    • Xylem Inc.
    • Yokogawa Electric Corp.

    Qualitative and quantitative analysis of companies has been conducted to help clients understand the wider business environment as well as the strengths and weaknesses of key industry players. Data is qualitatively analyzed to categorize companies as pure play, category-focused, industry-focused, and diversified; it is quantitatively analyzed to categorize companies as dominant, leading, strong, tentative, and weak.

    Recent Development and News in Structural Health Monitoring Market

    • In January 2024, Sensys GmbH, a leading structural health monitoring (SHM) solutions provider, announced the launch of its new wireless SHM system, named "WireFree," at the World Economic Forum in Davos, Switzerland (Sensys GmbH press release). This innovative system enables real-time monitoring of infrastructure health without the need for wired connections, expanding the company's product portfolio and catering to the growing demand for wireless SHM solutions.
    • In March 2024, Hexagon AB, a global technology company, entered into a strategic partnership with Geokon, Inc., a geotechnical instrumentation and monitoring solutions provider, to integrate Geokon's sensor technology into Hexagon's SHM solutions (Hexagon AB press release). This collaboration aims to enhance Hexagon's offering by incorporating Geokon's expertise in geotechnical monitoring, expanding their market reach and strengthening their position in the SHM industry.
    • In May 2024, StrainSense Technologies, a start-up specializing in fiber optic sensing technology, secured a USD10 million Series A funding round led by Khosla Ventures and Horizons Ventures (StrainSense Technologies press release). The investment will support the company's research and development efforts, aiming to advance their fiber optic sensing technology for SHM applications and expand their market presence.
    • In April 2025, the European Union (EU) published a new regulation, the European Infrastructure and Projects Banking Union Regulation, which includes provisions for mandatory structural health monitoring for all new infrastructure projects receiving EU funding (European Commission press release). This regulatory initiative is expected to significantly boost the demand for SHM solutions in Europe, creating new opportunities for market players and contributing to the growth of the global SHM market.

    Research Analyst Overview

    • The Structural Health Monitoring (SHM) market encompasses various technologies and techniques aimed at assessing the health and integrity of structures, from buildings and bridges to aircraft and wind turbines. Key market trends include the integration of advanced technologies such as root cause analysis, system identification, and probability of failure prediction through modal analysis and ultrasonic testing. Edge computing, augmented reality (AR), and virtual reality (VR) are transforming inspection processes, enabling real-time data analysis and visualization. Training and education in these technologies are essential for industry professionals, ensuring compliance with regulatory standards and adherence to industry best practices.
    • Lifecycle cost analysis, risk management, and compliance management are crucial aspects of SHM, with data analytics dashboards and reporting and analytics playing a significant role in decision-making. Smart sensors, embedded sensors, and non-destructive testing (NDT) techniques like dye penetrant testing, magnetic particle testing, and radiographic testing are essential for continuous monitoring and predictive maintenance. Reliability analysis and corrective maintenance are also essential components, with the integration of digital twins, 3D modeling, and blockchain technology enhancing data security and traceability. Support and maintenance services are vital to ensure optimal performance and extend the life cycle of SHM systems.

    Dive into Technavio’s robust research methodology, blending expert interviews, extensive data synthesis, and validated models for unparalleled Structural Health Monitoring Market insights. See full methodology.

    Market Scope

    Report Coverage

    Details

    Page number

    209

    Base year

    2024

    Historic period

    2019-2023

    Forecast period

    2025-2029

    Growth momentum & CAGR

    Accelerate at a CAGR of 20%

    Market growth 2025-2029

    USD 4130.4 million

    Market structure

    Fragmented

    YoY growth 2024-2025(%)

    15.7

    Key countries

    US, Germany, China, UK, Canada, France, Italy, Japan, India, and South Korea

    Competitive landscape

    Leading Companies, Market Positioning of Companies, Competitive Strategies, and Industry Risks

    Request Free Sample

    What are the Key Data Covered in this Structural Health Monitoring Market Research and Growth Report?

    • CAGR of the Structural Health Monitoring industry during the forecast period
    • Detailed information on factors that will drive the growth and forecasting between 2025 and 2029
    • Precise estimation of the size of the market and its contribution of the industry in focus to the parent market
    • Accurate predictions about upcoming growth and trends and changes in consumer behaviour
    • Growth of the market across North America, Europe, APAC, South America, and Middle East and Africa
    • Thorough analysis of the market’s competitive landscape and detailed information about companies
    • Comprehensive analysis of factors that will challenge the structural health monitoring market growth of industry companies

    We can help! Our analysts can customize this structural health monitoring market research report to meet your requirements.

    Get in touch


    1 Executive Summary

    • 1.1 Market overview
      • Executive Summary - Chart on Market Overview
      • Executive Summary - Data Table on Market Overview
      • Executive Summary - Chart on Global Market Characteristics
      • Executive Summary - Chart on Market by Geography
      • Executive Summary - Chart on Market Segmentation by Component
      • Executive Summary - Chart on Market Segmentation by Connectivity
      • Executive Summary - Chart on Market Segmentation by Application
      • Executive Summary - Chart on Incremental Growth
      • Executive Summary - Data Table on Incremental Growth
      • Executive Summary - Chart on Company Market Positioning

    2 Technavio Analysis

    • 2.1 Analysis of price sensitivity, lifecycle, customer purchase basket, adoption rates, and purchase criteria
      • Analysis of price sensitivity, lifecycle, customer purchase basket, adoption rates, and purchase criteria
    • 2.2 Criticality of inputs and Factors of differentiation
      • Overview on criticality of inputs and factors of differentiation
    • 2.3 Factors of disruption
      • Overview on factors of disruption
    • 2.4 Impact of drivers and challenges
      • Impact of drivers and challenges in 2024 and 2029

    3 Market Landscape

    • 3.1 Market ecosystem
      • Parent Market
      • Data Table on - Parent Market
    • 3.2 Market characteristics
      • Market characteristics analysis
    • 3.3 Value chain analysis
      • Value chain analysis

    4 Market Sizing

    • 4.1 Market definition
      • Offerings of companies included in the market definition
    • 4.2 Market segment analysis
      • Market segments
    • 4.3 Market size 2024
      • 4.4 Market outlook: Forecast for 2024-2029
        • Chart on Global - Market size and forecast 2024-2029 ($ million)
        • Data Table on Global - Market size and forecast 2024-2029 ($ million)
        • Chart on Global Market: Year-over-year growth 2024-2029 (%)
        • Data Table on Global Market: Year-over-year growth 2024-2029 (%)

      5 Historic Market Size

      • 5.1 Global Structural Health Monitoring Market 2019 - 2023
        • Historic Market Size - Data Table on Global Structural Health Monitoring Market 2019 - 2023 ($ million)
      • 5.2 Component segment analysis 2019 - 2023
        • Historic Market Size - Component Segment 2019 - 2023 ($ million)
      • 5.3 Connectivity segment analysis 2019 - 2023
        • Historic Market Size - Connectivity Segment 2019 - 2023 ($ million)
      • 5.4 Application segment analysis 2019 - 2023
        • Historic Market Size - Application Segment 2019 - 2023 ($ million)
      • 5.5 Geography segment analysis 2019 - 2023
        • Historic Market Size - Geography Segment 2019 - 2023 ($ million)
      • 5.6 Country segment analysis 2019 - 2023
        • Historic Market Size - Country Segment 2019 - 2023 ($ million)

      6 Qualitative Analysis

      • 6.1 The AI impact on global structural health monitoring market

        7 Five Forces Analysis

        • 7.1 Five forces summary
          • Five forces analysis - Comparison between 2024 and 2029
        • 7.2 Bargaining power of buyers
          • Bargaining power of buyers - Impact of key factors 2024 and 2029
        • 7.3 Bargaining power of suppliers
          • Bargaining power of suppliers - Impact of key factors in 2024 and 2029
        • 7.4 Threat of new entrants
          • Threat of new entrants - Impact of key factors in 2024 and 2029
        • 7.5 Threat of substitutes
          • Threat of substitutes - Impact of key factors in 2024 and 2029
        • 7.6 Threat of rivalry
          • Threat of rivalry - Impact of key factors in 2024 and 2029
        • 7.7 Market condition
          • Chart on Market condition - Five forces 2024 and 2029

        8 Market Segmentation by Component

        • 8.1 Market segments
          • Chart on Component - Market share 2024-2029 (%)
          • Data Table on Component - Market share 2024-2029 (%)
        • 8.2 Comparison by Component
          • Chart on Comparison by Component
          • Data Table on Comparison by Component
        • 8.3 Hardware - Market size and forecast 2024-2029
          • Chart on Hardware - Market size and forecast 2024-2029 ($ million)
          • Data Table on Hardware - Market size and forecast 2024-2029 ($ million)
          • Chart on Hardware - Year-over-year growth 2024-2029 (%)
          • Data Table on Hardware - Year-over-year growth 2024-2029 (%)
        • 8.4 Software - Market size and forecast 2024-2029
          • Chart on Software - Market size and forecast 2024-2029 ($ million)
          • Data Table on Software - Market size and forecast 2024-2029 ($ million)
          • Chart on Software - Year-over-year growth 2024-2029 (%)
          • Data Table on Software - Year-over-year growth 2024-2029 (%)
        • 8.5 Services - Market size and forecast 2024-2029
          • Chart on Services - Market size and forecast 2024-2029 ($ million)
          • Data Table on Services - Market size and forecast 2024-2029 ($ million)
          • Chart on Services - Year-over-year growth 2024-2029 (%)
          • Data Table on Services - Year-over-year growth 2024-2029 (%)
        • 8.6 Market opportunity by Component
          • Market opportunity by Component ($ million)
          • Data Table on Market opportunity by Component ($ million)

        9 Market Segmentation by Connectivity

        • 9.1 Market segments
          • Chart on Connectivity - Market share 2024-2029 (%)
          • Data Table on Connectivity - Market share 2024-2029 (%)
        • 9.2 Comparison by Connectivity
          • Chart on Comparison by Connectivity
          • Data Table on Comparison by Connectivity
        • 9.3 Wired - Market size and forecast 2024-2029
          • Chart on Wired - Market size and forecast 2024-2029 ($ million)
          • Data Table on Wired - Market size and forecast 2024-2029 ($ million)
          • Chart on Wired - Year-over-year growth 2024-2029 (%)
          • Data Table on Wired - Year-over-year growth 2024-2029 (%)
        • 9.4 Wireless - Market size and forecast 2024-2029
          • Chart on Wireless - Market size and forecast 2024-2029 ($ million)
          • Data Table on Wireless - Market size and forecast 2024-2029 ($ million)
          • Chart on Wireless - Year-over-year growth 2024-2029 (%)
          • Data Table on Wireless - Year-over-year growth 2024-2029 (%)
        • 9.5 Market opportunity by Connectivity
          • Market opportunity by Connectivity ($ million)
          • Data Table on Market opportunity by Connectivity ($ million)

        10 Market Segmentation by Application

        • 10.1 Market segments
          • Chart on Application - Market share 2024-2029 (%)
          • Data Table on Application - Market share 2024-2029 (%)
        • 10.2 Comparison by Application
          • Chart on Comparison by Application
          • Data Table on Comparison by Application
        • 10.3 Civil infrastructure - Market size and forecast 2024-2029
          • Chart on Civil infrastructure - Market size and forecast 2024-2029 ($ million)
          • Data Table on Civil infrastructure - Market size and forecast 2024-2029 ($ million)
          • Chart on Civil infrastructure - Year-over-year growth 2024-2029 (%)
          • Data Table on Civil infrastructure - Year-over-year growth 2024-2029 (%)
        • 10.4 Aerospace - Market size and forecast 2024-2029
          • Chart on Aerospace - Market size and forecast 2024-2029 ($ million)
          • Data Table on Aerospace - Market size and forecast 2024-2029 ($ million)
          • Chart on Aerospace - Year-over-year growth 2024-2029 (%)
          • Data Table on Aerospace - Year-over-year growth 2024-2029 (%)
        • 10.5 Energy - Market size and forecast 2024-2029
          • Chart on Energy - Market size and forecast 2024-2029 ($ million)
          • Data Table on Energy - Market size and forecast 2024-2029 ($ million)
          • Chart on Energy - Year-over-year growth 2024-2029 (%)
          • Data Table on Energy - Year-over-year growth 2024-2029 (%)
        • 10.6 Defense - Market size and forecast 2024-2029
          • Chart on Defense - Market size and forecast 2024-2029 ($ million)
          • Data Table on Defense - Market size and forecast 2024-2029 ($ million)
          • Chart on Defense - Year-over-year growth 2024-2029 (%)
          • Data Table on Defense - Year-over-year growth 2024-2029 (%)
        • 10.7 Others - Market size and forecast 2024-2029
          • Chart on Others - Market size and forecast 2024-2029 ($ million)
          • Data Table on Others - Market size and forecast 2024-2029 ($ million)
          • Chart on Others - Year-over-year growth 2024-2029 (%)
          • Data Table on Others - Year-over-year growth 2024-2029 (%)
        • 10.8 Market opportunity by Application
          • Market opportunity by Application ($ million)
          • Data Table on Market opportunity by Application ($ million)

        11 Customer Landscape

        • 11.1 Customer landscape overview
          • Analysis of price sensitivity, lifecycle, customer purchase basket, adoption rates, and purchase criteria

        12 Geographic Landscape

        • 12.1 Geographic segmentation
          • Chart on Market share by geography 2024-2029 (%)
          • Data Table on Market share by geography 2024-2029 (%)
        • 12.2 Geographic comparison
          • Chart on Geographic comparison
          • Data Table on Geographic comparison
        • 12.3 North America - Market size and forecast 2024-2029
          • Chart on North America - Market size and forecast 2024-2029 ($ million)
          • Data Table on North America - Market size and forecast 2024-2029 ($ million)
          • Chart on North America - Year-over-year growth 2024-2029 (%)
          • Data Table on North America - Year-over-year growth 2024-2029 (%)
        • 12.4 Europe - Market size and forecast 2024-2029
          • Chart on Europe - Market size and forecast 2024-2029 ($ million)
          • Data Table on Europe - Market size and forecast 2024-2029 ($ million)
          • Chart on Europe - Year-over-year growth 2024-2029 (%)
          • Data Table on Europe - Year-over-year growth 2024-2029 (%)
        • 12.5 APAC - Market size and forecast 2024-2029
          • Chart on APAC - Market size and forecast 2024-2029 ($ million)
          • Data Table on APAC - Market size and forecast 2024-2029 ($ million)
          • Chart on APAC - Year-over-year growth 2024-2029 (%)
          • Data Table on APAC - Year-over-year growth 2024-2029 (%)
        • 12.6 South America - Market size and forecast 2024-2029
          • Chart on South America - Market size and forecast 2024-2029 ($ million)
          • Data Table on South America - Market size and forecast 2024-2029 ($ million)
          • Chart on South America - Year-over-year growth 2024-2029 (%)
          • Data Table on South America - Year-over-year growth 2024-2029 (%)
        • 12.7 Middle East and Africa - Market size and forecast 2024-2029
          • Chart on Middle East and Africa - Market size and forecast 2024-2029 ($ million)
          • Data Table on Middle East and Africa - Market size and forecast 2024-2029 ($ million)
          • Chart on Middle East and Africa - Year-over-year growth 2024-2029 (%)
          • Data Table on Middle East and Africa - Year-over-year growth 2024-2029 (%)
        • 12.8 US - Market size and forecast 2024-2029
          • Chart on US - Market size and forecast 2024-2029 ($ million)
          • Data Table on US - Market size and forecast 2024-2029 ($ million)
          • Chart on US - Year-over-year growth 2024-2029 (%)
          • Data Table on US - Year-over-year growth 2024-2029 (%)
        • 12.9 Germany - Market size and forecast 2024-2029
          • Chart on Germany - Market size and forecast 2024-2029 ($ million)
          • Data Table on Germany - Market size and forecast 2024-2029 ($ million)
          • Chart on Germany - Year-over-year growth 2024-2029 (%)
          • Data Table on Germany - Year-over-year growth 2024-2029 (%)
        • 12.10 China - Market size and forecast 2024-2029
          • Chart on China - Market size and forecast 2024-2029 ($ million)
          • Data Table on China - Market size and forecast 2024-2029 ($ million)
          • Chart on China - Year-over-year growth 2024-2029 (%)
          • Data Table on China - Year-over-year growth 2024-2029 (%)
        • 12.11 UK - Market size and forecast 2024-2029
          • Chart on UK - Market size and forecast 2024-2029 ($ million)
          • Data Table on UK - Market size and forecast 2024-2029 ($ million)
          • Chart on UK - Year-over-year growth 2024-2029 (%)
          • Data Table on UK - Year-over-year growth 2024-2029 (%)
        • 12.12 Canada - Market size and forecast 2024-2029
          • Chart on Canada - Market size and forecast 2024-2029 ($ million)
          • Data Table on Canada - Market size and forecast 2024-2029 ($ million)
          • Chart on Canada - Year-over-year growth 2024-2029 (%)
          • Data Table on Canada - Year-over-year growth 2024-2029 (%)
        • 12.13 France - Market size and forecast 2024-2029
          • Chart on France - Market size and forecast 2024-2029 ($ million)
          • Data Table on France - Market size and forecast 2024-2029 ($ million)
          • Chart on France - Year-over-year growth 2024-2029 (%)
          • Data Table on France - Year-over-year growth 2024-2029 (%)
        • 12.14 Italy - Market size and forecast 2024-2029
          • Chart on Italy - Market size and forecast 2024-2029 ($ million)
          • Data Table on Italy - Market size and forecast 2024-2029 ($ million)
          • Chart on Italy - Year-over-year growth 2024-2029 (%)
          • Data Table on Italy - Year-over-year growth 2024-2029 (%)
        • 12.15 Japan - Market size and forecast 2024-2029
          • Chart on Japan - Market size and forecast 2024-2029 ($ million)
          • Data Table on Japan - Market size and forecast 2024-2029 ($ million)
          • Chart on Japan - Year-over-year growth 2024-2029 (%)
          • Data Table on Japan - Year-over-year growth 2024-2029 (%)
        • 12.16 India - Market size and forecast 2024-2029
          • Chart on India - Market size and forecast 2024-2029 ($ million)
          • Data Table on India - Market size and forecast 2024-2029 ($ million)
          • Chart on India - Year-over-year growth 2024-2029 (%)
          • Data Table on India - Year-over-year growth 2024-2029 (%)
        • 12.17 South Korea - Market size and forecast 2024-2029
          • Chart on South Korea - Market size and forecast 2024-2029 ($ million)
          • Data Table on South Korea - Market size and forecast 2024-2029 ($ million)
          • Chart on South Korea - Year-over-year growth 2024-2029 (%)
          • Data Table on South Korea - Year-over-year growth 2024-2029 (%)
        • 12.18 Market opportunity by geography
          • Market opportunity by geography ($ million)
          • Data Tables on Market opportunity by geography ($ million)

        13 Drivers, Challenges, and Opportunity/Restraints

        • 13.1 Market drivers
          • 13.2 Market challenges
            • 13.3 Impact of drivers and challenges
              • Impact of drivers and challenges in 2024 and 2029
            • 13.4 Market opportunities/restraints

              14 Competitive Landscape

              • 14.1 Overview
                • 14.2 Competitive Landscape
                  • Overview on criticality of inputs and factors of differentiation
                • 14.3 Landscape disruption
                  • Overview on factors of disruption
                • 14.4 Industry risks
                  • Impact of key risks on business

                15 Competitive Analysis

                • 15.1 Companies profiled
                  • Companies covered
                • 15.2 Company ranking index
                  • Company ranking index
                • 15.3 Market positioning of companies
                  • Matrix on companies position and classification
                • 15.4 Campbell Scientific Inc.
                  • Campbell Scientific Inc. - Overview
                  • Campbell Scientific Inc. - Product / Service
                  • Campbell Scientific Inc. - Key offerings
                  • SWOT
                • 15.5 CGG SA
                  • CGG SA - Overview
                  • CGG SA - Business segments
                  • CGG SA - Key offerings
                  • CGG SA - Segment focus
                  • SWOT
                • 15.6 COWI Holding AS
                  • COWI Holding AS - Overview
                  • COWI Holding AS - Business segments
                  • COWI Holding AS - Key news
                  • COWI Holding AS - Key offerings
                  • COWI Holding AS - Segment focus
                  • SWOT
                • 15.7 Digitexx Systems Ltd.
                  • Digitexx Systems Ltd. - Overview
                  • Digitexx Systems Ltd. - Product / Service
                  • Digitexx Systems Ltd. - Key offerings
                  • SWOT
                • 15.8 Geosense Ltd.
                  • Geosense Ltd. - Overview
                  • Geosense Ltd. - Product / Service
                  • Geosense Ltd. - Key offerings
                  • SWOT
                • 15.9 Hottinger Bruel and Kjaer GmbH
                  • Hottinger Bruel and Kjaer GmbH - Overview
                  • Hottinger Bruel and Kjaer GmbH - Product / Service
                  • Hottinger Bruel and Kjaer GmbH - Key offerings
                  • SWOT
                • 15.10 James Fisher and Sons Plc
                  • James Fisher and Sons Plc - Overview
                  • James Fisher and Sons Plc - Business segments
                  • James Fisher and Sons Plc - Key news
                  • James Fisher and Sons Plc - Key offerings
                  • James Fisher and Sons Plc - Segment focus
                  • SWOT
                • 15.11 Kinemetrics Inc.
                  • Kinemetrics Inc. - Overview
                  • Kinemetrics Inc. - Product / Service
                  • Kinemetrics Inc. - Key offerings
                  • SWOT
                • 15.12 National Instruments Corp.
                  • National Instruments Corp. - Overview
                  • National Instruments Corp. - Product / Service
                  • National Instruments Corp. - Key offerings
                  • SWOT
                • 15.13 Nova Ventures Group Corp.
                  • Nova Ventures Group Corp. - Overview
                  • Nova Ventures Group Corp. - Product / Service
                  • Nova Ventures Group Corp. - Key offerings
                  • SWOT
                • 15.14 RST Instruments Ltd.
                  • RST Instruments Ltd. - Overview
                  • RST Instruments Ltd. - Product / Service
                  • RST Instruments Ltd. - Key offerings
                  • SWOT
                • 15.15 Sisgeo S.r.l.
                  • Sisgeo S.r.l. - Overview
                  • Sisgeo S.r.l. - Product / Service
                  • Sisgeo S.r.l. - Key offerings
                  • SWOT
                • 15.16 STRUCTURAL MONITORING SYSTEMS plc
                  • STRUCTURAL MONITORING SYSTEMS plc - Overview
                  • STRUCTURAL MONITORING SYSTEMS plc - Business segments
                  • STRUCTURAL MONITORING SYSTEMS plc - Key offerings
                  • STRUCTURAL MONITORING SYSTEMS plc - Segment focus
                  • SWOT
                • 15.17 Vinci
                  • Vinci - Overview
                  • Vinci - Business segments
                  • Vinci - Key offerings
                  • Vinci - Segment focus
                  • SWOT
                • 15.18 Xylem Inc.
                  • Xylem Inc. - Overview
                  • Xylem Inc. - Business segments
                  • Xylem Inc. - Key news
                  • Xylem Inc. - Key offerings
                  • Xylem Inc. - Segment focus
                  • SWOT

                16 Appendix

                • 16.1 Scope of the report
                  • 16.2 Inclusions and exclusions checklist
                    • Inclusions checklist
                    • Exclusions checklist
                  • 16.3 Currency conversion rates for US$
                    • Currency conversion rates for US$
                  • 16.4 Research methodology
                    • Research methodology
                  • 16.5 Data procurement
                    • Information sources
                  • 16.6 Data validation
                    • Data validation
                  • 16.7 Validation techniques employed for market sizing
                    • Validation techniques employed for market sizing
                  • 16.8 Data synthesis
                    • Data synthesis
                  • 16.9 360 degree market analysis
                    • 360 degree market analysis
                  • 16.10 List of abbreviations
                    • List of abbreviations

                  Research Methodology

                  Technavio presents a detailed picture of the market by way of study, synthesis, and summation of data from multiple sources. The analysts have presented the various facets of the market with a particular focus on identifying the key industry influencers. The data thus presented is comprehensive, reliable, and the result of extensive research, both primary and secondary.

                  INFORMATION SOURCES

                  Primary sources

                  • Manufacturers and suppliers
                  • Channel partners
                  • Industry experts
                  • Strategic decision makers

                  Secondary sources

                  • Industry journals and periodicals
                  • Government data
                  • Financial reports of key industry players
                  • Historical data
                  • Press releases

                  DATA ANALYSIS

                  Data Synthesis

                  • Collation of data
                  • Estimation of key figures
                  • Analysis of derived insights

                  Data Validation

                  • Triangulation with data models
                  • Reference against proprietary databases
                  • Corroboration with industry experts

                  REPORT WRITING

                  Qualitative

                  • Market drivers
                  • Market challenges
                  • Market trends
                  • Five forces analysis

                  Quantitative

                  • Market size and forecast
                  • Market segmentation
                  • Geographical insights
                  • Competitive landscape

                  Interested in this report?

                  Get your sample now to see our research methodology and insights!

                  Download Now

                  Frequently Asked Questions

                  Structural Health Monitoring market growth will increase by $ 4130.4 mn during 2025-2029.

                  The Structural Health Monitoring market is expected to grow at a CAGR of 20% during 2025-2029.

                  Structural Health Monitoring market is segmented by Component( Hardware, Software, Services) Connectivity( Wired, Wireless) Application( Civil infrastructure, Aerospace, Energy, Defense, Others)

                  Campbell Scientific Inc., CGG SA, COWI Holding AS, Digitexx Systems Ltd., Geosense Ltd., Hottinger Bruel and Kjaer GmbH, James Fisher and Sons Plc, Kinemetrics Inc., LiveHooah Technologies Pvt. Ltd., MachineSense LLC, Mistras Group Inc., National Instruments Corp., Nova Ventures Group Corp., Ramboll Group AS, RST Instruments Ltd., Sisgeo S.r.l., STRUCTURAL MONITORING SYSTEMS plc, Vinci, Xylem Inc., Yokogawa Electric Corp. are a few of the key vendors in the Structural Health Monitoring market.

                  North America will register the highest growth rate of 40% among the other regions. Therefore, the Structural Health Monitoring market in North America is expected to garner significant business opportunities for the vendors during the forecast period.

                  US, Germany, China, UK, Canada, France, Italy, Japan, India, South Korea

                  • Increasing need for infrastructure maintenance and safetyThe increasing need for infrastructure maintenance and safety is indeed a significant driver for the global structural health monitoring market. Several factors contribute to the growing emphasis on infrastructure maintenance and safety is the driving factor this market.
                  • which in turn drives the demand for structural health monitoring solutions:Aging Infrastructure: Many countries such as India and China have aging infrastructure that requires regular inspection and monitoring to ensure its continued functionality and safety. Structural health monitoring systems provide real time data on the condition of infrastructure is the driving factor this market.
                  • helping to identify and address potential issues before they escalate into costly and dangerous problems.Safety Concerns: Infrastructure failures can have catastrophic consequences is the driving factor this market.
                  • leading to loss of life is the driving factor this market.
                  • property damage is the driving factor this market.
                  • and economic disruptions. High-profile incidents is the driving factor this market.
                  • such as bridge collapses or building failures is the driving factor this market.
                  • highlight the need for proactive measures to ensure the safety and integrity of structures. Structural health monitoring plays a crucial role in the early detection of structural issues is the driving factor this market.
                  • enabling timely maintenance and avoiding potential disasters.Regulatory Standards and Guidelines: Governments and regulatory bodies are increasingly implementing stricter safety standards and guidelines for infrastructure. These regulations often include requirements for regular structural inspections and monitoring. Compliance with such standards drives the adoption of structural health monitoring technologies to meet regulatory requirements.Cost Savings: Timely detection of structural issues through continuous monitoring allows for targeted maintenance and repair activities. By identifying and addressing problems early on is the driving factor this market.
                  • structural health monitoring helps avoid costly emergency repairs or the need for complete structure replacement. This cost-saving potential is a strong motivator for organizations to invest in structural health monitoring solutions.As a result of the abovementioned factors is the driving factor this market.
                  • the global structural health monitoring market is experiencing substantial growth. Companies specializing in structural health monitoring technologies are developing innovative solutions to cater to the increasing demand for infrastructure maintenance and safety is the driving factor this market.
                  • driving further advancements in the field during the forecast period. is the driving factor this market.

                  The Structural Health Monitoring market vendors should focus on grabbing business opportunities from the Hardware segment as it accounted for the largest market share in the base year.