Starch Polymer Market Analysis, Size, and Forecast 2026-2030: Europe (Germany, France, and UK), APAC (China, India, and Japan), North America (US, Canada, and Mexico), South America (Brazil and Argentina), Middle East and Africa (UAE, Saudi Arabia, and South Africa), and Rest of World (ROW)

Starch Polymer Market Analysis, Size, and Forecast 2026-2030:
Europe (Germany, France, and UK), APAC (China, India, and Japan), North America (US, Canada, and Mexico), South America (Brazil and Argentina), Middle East and Africa (UAE, Saudi Arabia, and South Africa), and Rest of World (ROW)

Published: Jan 2026 298 Pages SKU: IRTNTR74146

Market Overview at a Glance

$372.3 Mn
Market Opportunity
4.6%
CAGR 2025 - 2030
44.7%
Europe Growth
$682.4 Mn
Packaging segment 2024

Starch Polymer Market Size 2026-2030

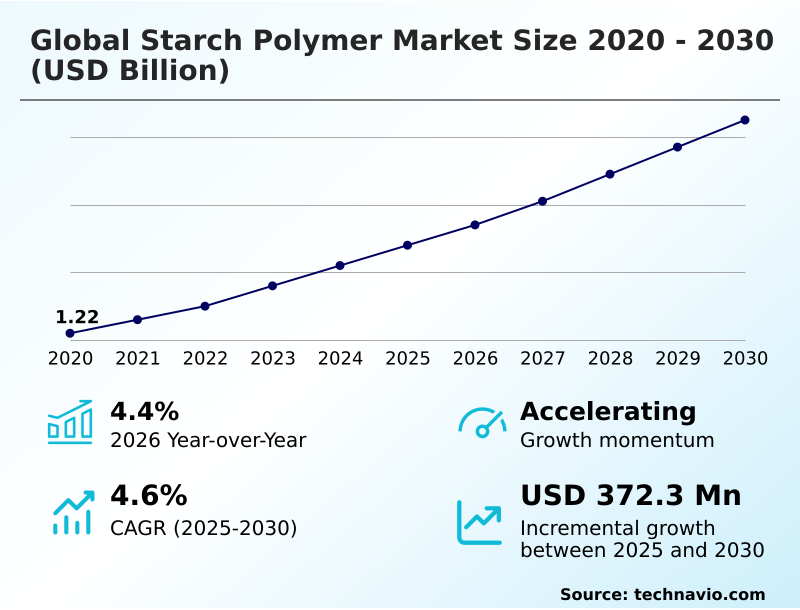
The starch polymer market size is valued to increase by USD 372.3 million, at a CAGR of 4.6% from 2025 to 2030. Escalating regulatory mandates and legislative bans on conventional plastics will drive the starch polymer market.

Major Market Trends & Insights

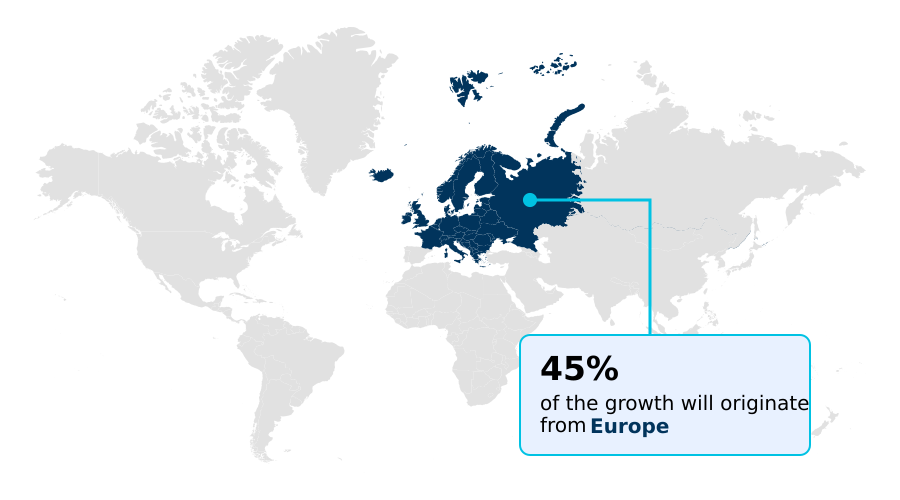
  • Europe dominated the market and accounted for a 44.7% growth during the forecast period.
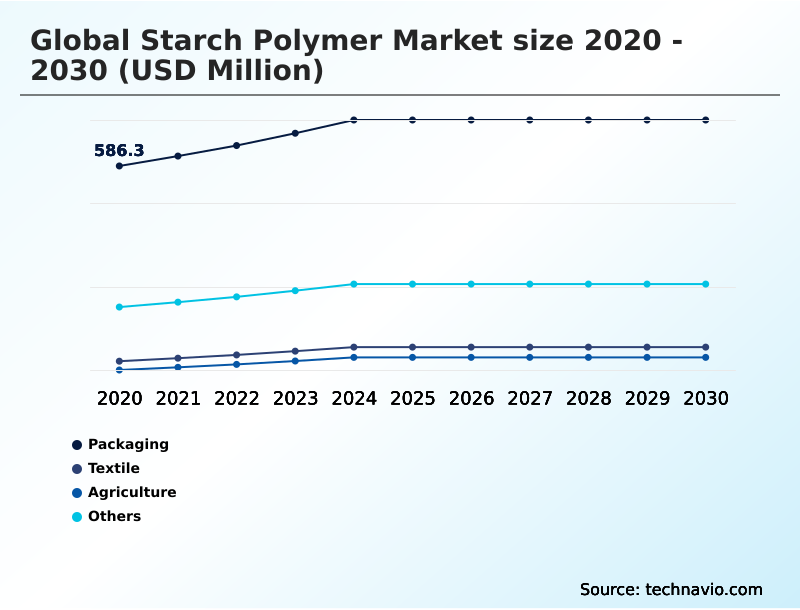
  • By End-user - Packaging segment was valued at USD 682.4 million in 2024
  • By Source - Corn starch segment accounted for the largest market revenue share in 2024

Market Size & Forecast

  • Market Opportunities: USD 633.9 million
  • Market Future Opportunities: USD 372.3 million
  • CAGR from 2025 to 2030 : 4.6%

Market Summary

  • The starch polymer market is undergoing a significant transformation, driven by the escalating need for sustainable alternatives to petroleum-based plastics. Innovations in starch modification techniques are creating high-performance bio-based polymers suitable for a wide range of uses, from compostable packaging materials to biodegradable mulch films.
  • A key trend is the development of biopolymer composites that offer enhanced moisture barrier properties and greater tensile strength, addressing historical limitations. However, the industry faces challenges related to the biopolymer supply chain, where volatility in agricultural feedstock prices can impact manufacturing costs.
  • For instance, a food packaging company transitioning to starch-based bioplastics must balance the benefits of a lower carbon footprint against potential supply inconsistencies, requiring sophisticated sourcing strategies to maintain production stability and competitive pricing for their sustainable packaging solutions.

What will be the Size of the Starch Polymer Market during the forecast period?

Get Key Insights on Market Forecast (PDF) Request Free Sample

How is the Starch Polymer Market Segmented?

The starch polymer industry research report provides comprehensive data (region-wise segment analysis), with forecasts and estimates in "USD million" for the period 2026-2030, as well as historical data from 2020-2024 for the following segments.

  • End-user
    • Packaging
    • Textile
    • Agriculture
    • Others
  • Source
    • Corn starch
    • Cassava starch
    • Potato starch
    • Wheat starch
  • Type
    • Bio-degradable
    • Durable
  • Geography
    • Europe
      • Germany
      • France
      • UK
    • APAC
      • China
      • India
      • Japan
    • North America
      • US
      • Canada
      • Mexico
    • South America
      • Brazil
      • Argentina
    • Middle East and Africa
      • UAE
      • Saudi Arabia
      • South Africa
    • Rest of World (ROW)

By End-user Insights

The packaging segment is estimated to witness significant growth during the forecast period.

The packaging segment dominates starch polymer applications, driven by the shift toward sustainable materials and advances in bio-based material science. Demand for certified compostable products, particularly in food service and retail, is accelerating the adoption of renewable polymer technology.

This transition is supported by a growing focus on agricultural bioplastics for applications like mulch films. For instance, optimized material formulations have improved processing efficiency by over 15%, reducing waste.

As companies prioritize sustainable material sourcing, starch-based solutions are becoming integral to corporate environmental strategies, moving from niche alternatives to mainstream packaging components that meet both performance and ecological standards.

Request Free Sample

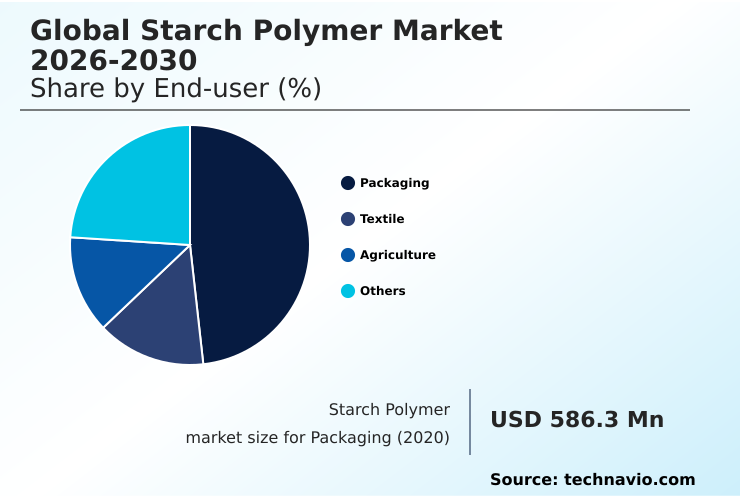
The Packaging segment was valued at USD 682.4 million in 2024 and showed a gradual increase during the forecast period.

Request Free Sample

Regional Analysis

Europe is estimated to contribute 44.7% to the growth of the global market during the forecast period.Technavio’s analysts have elaborately explained the regional trends and drivers that shape the market during the forecast period.

See How Starch Polymer Market Demand is Rising in Europe Request Free Sample

The geographic landscape is characterized by varying adoption rates influenced by regional regulatory frameworks and industrial capabilities. Europe leads in starch polymer research and deployment, with an incremental growth opportunity of nearly 45%.

Its focus on eco-friendly packaging materials has created a robust market for food-grade bioplastics. In contrast, North America and APAC are rapidly scaling capabilities in bioplastic injection molding and refining starch blend formulations.

These regions leverage deep knowledge of thermoplastic starch properties to expand into non-packaging sectors, contributing significantly to market diversification and the global supply chain.

Market Dynamics

Our researchers analyzed the data with 2025 as the base year, along with the key drivers, trends, and challenges. A holistic analysis of drivers will help companies refine their marketing strategies to gain a competitive advantage.

  • Strategic decision-making in the starch polymer market requires a deep understanding of material performance and manufacturing processes. A key consideration involves the starch polymer vs pla performance comparison, where factors like tensile strength and thermal properties are critical.
  • For packaging applications, improving moisture barrier in starch films is a primary research focus, directly impacting the shelf life of starch-based food packaging. The development and application of starch-based nanocomposites are enabling new functionalities, though balancing the cost-effectiveness of thermoplastic starch remains essential. The regulatory landscape, especially the specific regulations for compostable food packaging, dictates design and end-of-life pathways.
  • In agriculture, the use of starch polymer for agricultural mulch films offers a sustainable alternative to conventional plastics. The biodegradable cutlery manufacturing process is being optimized using advanced injection molding with starch biopolymers. For flexible film applications, creating a durable starch blend for flexible packaging film is paramount.
  • This involves enhancing the tensile strength of bioplastics and understanding the thermal properties of thermoplastic starch. Firms successfully blending starch with other biopolymers report processing cycle times reduced by over 10%. Overcoming the challenges of starch polymer production, including sourcing corn starch for bioplastics, is crucial for scalability.
  • This also involves exploring diverse feedstocks, with significant interest in potato starch in biodegradable packaging and unique cassava starch based biopolymer uses. Similarly, the role of wheat starch in sustainable materials is expanding. Innovations are even extending to niche areas, with firms developing certified home compostable starch plastics and using starch polymer in 3d printing filaments, showcasing the material's versatility.

What are the key market drivers leading to the rise in the adoption of Starch Polymer Industry?

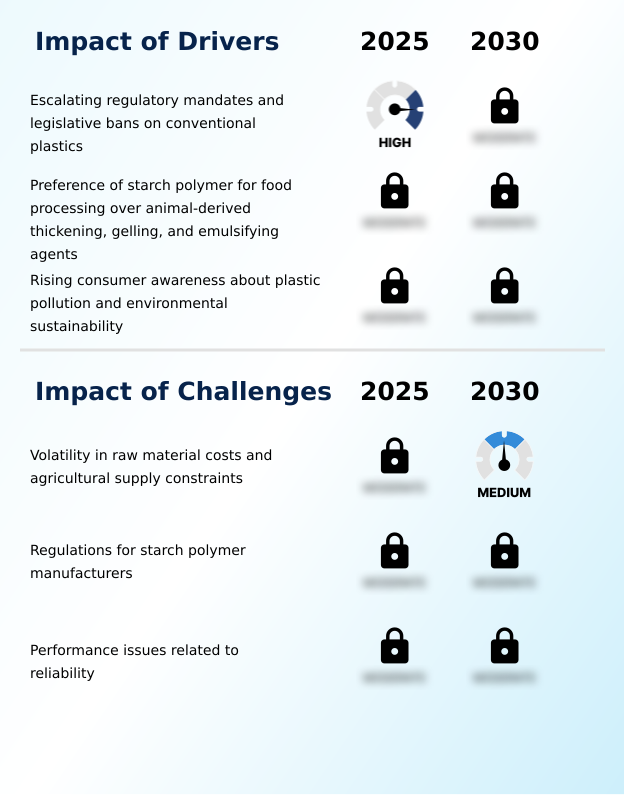
  • The market's growth is primarily driven by escalating regulatory mandates and widespread legislative bans on conventional plastics, which accelerates the adoption of bio-based alternatives.

  • Growth is accelerated by stringent regulations on single-use plastics and a global push for reducing plastic pollution. This creates significant demand for circular economy materials and pushes companies toward sustainable material sourcing.
  • Starch as a renewable feedstock is central to this transition, offering one of the most viable biodegradable plastic alternatives.
  • Despite some challenges in bioplastic adoption, regulatory pressures are forcing industries to innovate, with regions enforcing bans showing adoption rates over 40% higher than those without.

What are the market trends shaping the Starch Polymer Industry?

  • The market is witnessing a key trend toward the integration of advanced biopolymer blends and nanotechnology. This is driven by the need to enhance the barrier properties of starch-based materials for demanding applications.

  • The market is defined by rapid plant-based packaging innovation, where the focus is on developing advanced biocomposite materials. These materials offer enhanced performance, including the creation of heat-resistant bioplastics suitable for more demanding uses. A key area of development involves improving bioplastic durability, with new formulations increasing material longevity by over 30%.
  • Advances in green polymer chemistry are enabling the production of high-barrier bioplastic films that extend product shelf life by up to 20%, shaping the future of sustainable plastics.

What challenges does the Starch Polymer Industry face during its growth?

  • A primary challenge affecting industry growth is the inherent volatility in raw material costs and supply chain constraints associated with key agricultural feedstocks.

  • Navigating the starch-based resin market requires overcoming key hurdles. A primary concern is the inherent moisture sensitivity of bioplastics, which can limit applications without advanced formulation. The biopolymer supply chain is also subject to agricultural volatility, impacting the overall cost of biodegradable plastics and creating price fluctuations of up to 15%.
  • Continuous bioplastic performance enhancement is necessary to compete with conventional polymers, driving investment in biodegradable polymer manufacturing technologies to improve process efficiency by at least 10%.

Exclusive Technavio Analysis on Customer Landscape

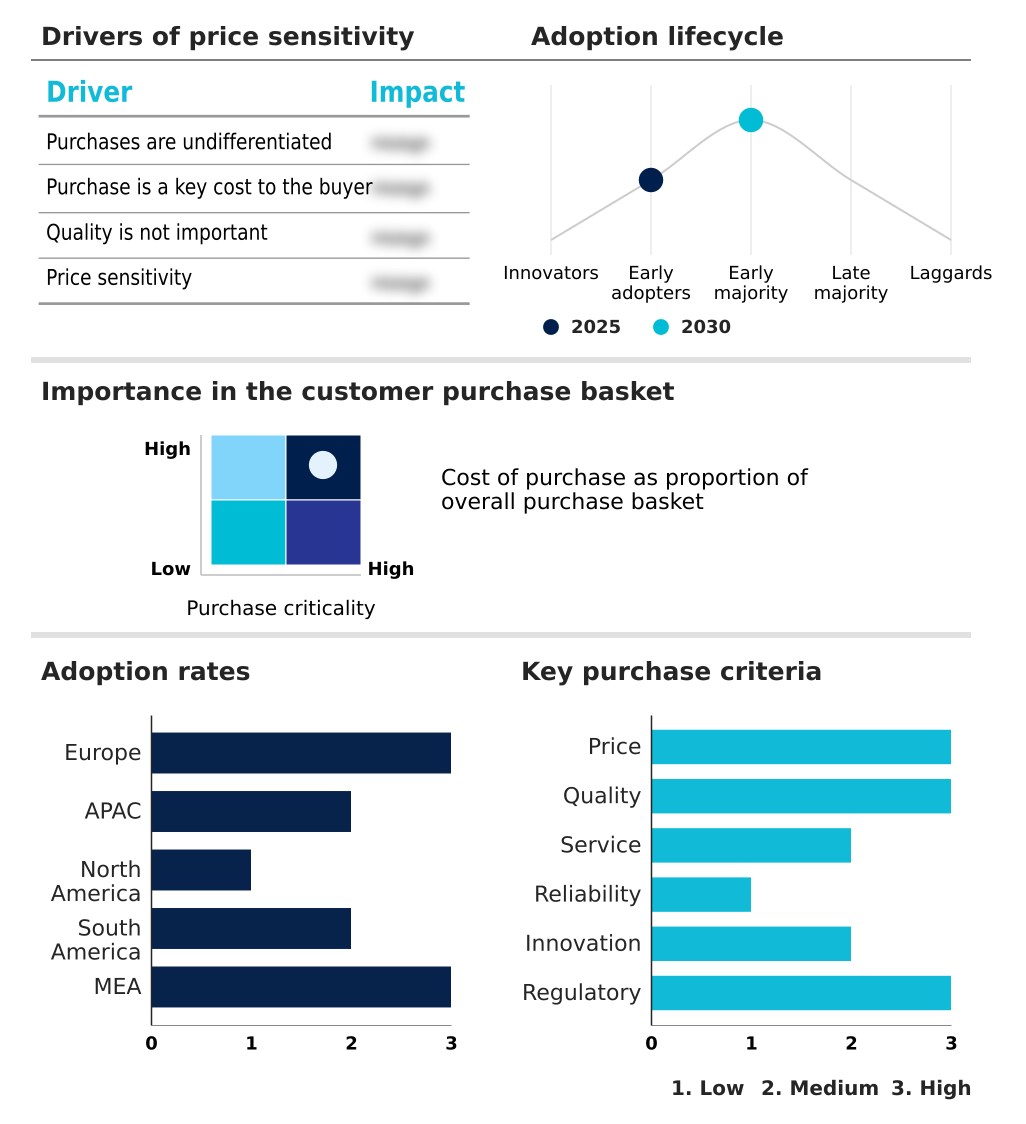
The starch polymer market forecasting report includes the adoption lifecycle of the market, covering from the innovator’s stage to the laggard’s stage. It focuses on adoption rates in different regions based on penetration. Furthermore, the starch polymer market report also includes key purchase criteria and drivers of price sensitivity to help companies evaluate and develop their market growth analysis strategies.

Customer Landscape of Starch Polymer Industry

Competitive Landscape

Companies are implementing various strategies, such as strategic alliances, starch polymer market forecast, partnerships, mergers and acquisitions, geographical expansion, and product/service launches, to enhance their presence in the industry.

AGRANA Beteiligungs AG - Offerings include biodegradable starch-based polymers engineered for high-performance packaging and agricultural film applications, aligning with sustainability mandates and functional requirements.

The industry research and growth report includes detailed analyses of the competitive landscape of the market and information about key companies, including:

  • AGRANA Beteiligungs AG
  • Biome Bioplastics Ltd.
  • Biotec GmbH Co. and KG
  • Braskem SA
  • Corbion N.V.
  • DuPont de Nemours Inc.
  • Fkur Kunststoff GmbH
  • Green Dot Bioplastics Inc.
  • JAPAN CORN STARCH CO., LTD.
  • KURARAY Co. Ltd.
  • Mitsubishi Chemical Corp.
  • NatureWorks LLC
  • Novamont S.p.A.
  • SPAC Starch Products Ltd.
  • Toray Industries Inc.

Qualitative and quantitative analysis of companies has been conducted to help clients understand the wider business environment as well as the strengths and weaknesses of key industry players. Data is qualitatively analyzed to categorize companies as pure play, category-focused, industry-focused, and diversified; it is quantitatively analyzed to categorize companies as dominant, leading, strong, tentative, and weak.

Recent Development and News in Starch polymer market

  • In August 2024, Roquette announced the expansion of its line of functional starches designed for the biopolymer industry, aiming to improve water resistance and mechanical properties.
  • In January 2025, TotalEnergies Corbion unveiled a collaborative project with a major retail organization to implement starch-polylactic acid blends in reusable shopping bags to enhance durability.
  • In March 2025, NatureWorks LLC announced a collaboration with a biotechnology laboratory to integrate starch-derived nanofibers into their high-performance Ingeo biopolymer line for enhanced heat resistance.
  • In May 2025, Cargill entered into a strategic agreement with a biotechnology firm to develop next-generation starch-based resins for high-value applications in the electronics industry.

Dive into Technavio’s robust research methodology, blending expert interviews, extensive data synthesis, and validated models for unparalleled Starch Polymer Market insights. See full methodology.

Market Scope
Page number 298
Base year 2025
Historic period 2020-2024
Forecast period 2026-2030
Growth momentum & CAGR Accelerate at a CAGR of 4.6%
Market growth 2026-2030 USD 372.3 million
Market structure Fragmented
YoY growth 2025-2026(%) 4.4%
Key countries Germany, France, UK, Italy, Spain, The Netherlands, China, India, Japan, South Korea, Australia, Indonesia, US, Canada, Mexico, Brazil, Argentina, Chile, UAE, Saudi Arabia, South Africa, Egypt and Kenya
Competitive landscape Leading Companies, Market Positioning of Companies, Competitive Strategies, and Industry Risks

Request Free Sample

Research Analyst Overview

  • The starch polymer market is shaped by advances in sustainable polymer science, focusing on bio-based polymers to meet decarbonization goals. A key area is the development of thermoplastic starch (tps) and other starch-based bioplastics, driven by demand for sustainable packaging solutions. Innovations in starch modification techniques and the reactive extrusion process are enhancing material properties.
  • For example, controlling the amylose and amylopectin ratio and the starch gelatinization process improves retrogradation resistance. This allows for superior biopolymer composites and starch-nanocomposites with improved moisture barrier properties and thermal stability of biopolymers. The focus on high-amylose starch enables the creation of high-performance bio-based films.
  • Boardroom decisions are now heavily influenced by the need to increase renewable material content, with some firms achieving a 30% improvement in material efficiency. Bioplastic resin manufacturing is scaling up, producing injection molding grade starch and extrusion grade biopolymer for applications like flexible film packaging and rigid bioplastic containers.
  • Products such as biodegradable mulch films and biodegradable cutlery must meet stringent compostability standards. The development of biodegradable polymer blends and certified compostable polymer materials with enhanced gas barrier films is critical. This includes engineering water-soluble polymers and understanding plasticizer effects on starch to improve the tensile strength of bioplastics, ultimately contributing to carbon footprint reduction with each bio-based resin.

What are the Key Data Covered in this Starch Polymer Market Research and Growth Report?

  • What is the expected growth of the Starch Polymer Market between 2026 and 2030?

    • USD 372.3 million, at a CAGR of 4.6%

  • What segmentation does the market report cover?

    • The report is segmented by End-user (Packaging, Textile, Agriculture, and Others), Source (Corn starch, Cassava starch, Potato starch, and Wheat starch), Type (Bio-degradable, and Durable) and Geography (Europe, APAC, North America, South America, Middle East and Africa)

  • Which regions are analyzed in the report?

    • Europe, APAC, North America, South America and Middle East and Africa

  • What are the key growth drivers and market challenges?

    • Escalating regulatory mandates and legislative bans on conventional plastics, Volatility in raw material costs and agricultural supply constraints

  • Who are the major players in the Starch Polymer Market?

    • AGRANA Beteiligungs AG, Biome Bioplastics Ltd., Biotec GmbH Co. and KG, Braskem SA, Corbion N.V., DuPont de Nemours Inc., Fkur Kunststoff GmbH, Green Dot Bioplastics Inc., JAPAN CORN STARCH CO., LTD., KURARAY Co. Ltd., Mitsubishi Chemical Corp., NatureWorks LLC, Novamont S.p.A., SPAC Starch Products Ltd. and Toray Industries Inc.

Market Research Insights

  • The market is evolving beyond simple substitution, driven by intensive starch polymer research aimed at tangible bioplastic performance enhancement. The push for compostable food packaging, for example, has led to new formulations that improve material strength by 20% while maintaining certified biodegradability.
  • Companies that integrate these circular economy materials into their supply chains report a reduction in end-of-life management costs by up to 30%. These advancements demonstrate a shift toward creating high-value, functional bioplastics that meet both sustainability mandates and rigorous industrial standards.

We can help! Our analysts can customize this starch polymer market research report to meet your requirements.

Get in touch

1. Executive Summary

1.1 Market overview

Executive Summary - Chart on Market Overview
Executive Summary - Data Table on Market Overview
Executive Summary - Chart on Global Market Characteristics
Executive Summary - Chart on Market by Geography
Executive Summary - Chart on Market Segmentation by End-user
Executive Summary - Chart on Market Segmentation by Source
Executive Summary - Chart on Market Segmentation by Type
Executive Summary - Chart on Incremental Growth
Executive Summary - Data Table on Incremental Growth
Executive Summary - Chart on Company Market Positioning

2. Technavio Analysis

2.1 Analysis of price sensitivity, lifecycle, customer purchase basket, adoption rates, and purchase criteria

2.2 Criticality of inputs and Factors of differentiation

Chart on Overview on criticality of inputs and factors of differentiation

2.3 Factors of disruption

Chart on Overview on factors of disruption

2.4 Impact of drivers and challenges

Chart on Impact of drivers and challenges in 2025 and 2030

3. Market Landscape

3.1 Market ecosystem

Chart on Parent Market
Data Table on - Parent Market

3.2 Market characteristics

Chart on Market characteristics analysis

3.3 Value chain analysis

Chart on Value chain analysis

4. Market Sizing

4.1 Market definition

Data Table on Offerings of companies included in the market definition

4.2 Market segment analysis

Market segments

4.3 Market size 2025

4.4 Market outlook: Forecast for 2025-2030

Chart on Global - Market size and forecast 2025-2030 ($ million)
Data Table on Global - Market size and forecast 2025-2030 ($ million)
Chart on Global Market: Year-over-year growth 2025-2030 (%)
Data Table on Global Market: Year-over-year growth 2025-2030 (%)

5. Historic Market Size

5.1 Global Starch Polymer Market 2020 - 2024

Historic Market Size - Data Table on Global Starch Polymer Market 2020 - 2024 ($ million)

5.2 End-user segment analysis 2020 - 2024

Historic Market Size - End-user Segment 2020 - 2024 ($ million)

5.3 Source segment analysis 2020 - 2024

Historic Market Size - Source Segment 2020 - 2024 ($ million)

5.4 Type segment analysis 2020 - 2024

Historic Market Size - Type Segment 2020 - 2024 ($ million)

5.5 Geography segment analysis 2020 - 2024

Historic Market Size - Geography Segment 2020 - 2024 ($ million)

5.6 Country segment analysis 2020 - 2024

Historic Market Size - Country Segment 2020 - 2024 ($ million)

6. Qualitative Analysis

6.1 Impact of AI on Global Starch Polymer Market

7. Five Forces Analysis

7.1 Five forces summary

Five forces analysis - Comparison between 2025 and 2030

7.2 Bargaining power of buyers

Bargaining power of buyers - Impact of key factors 2025 and 2030

7.3 Bargaining power of suppliers

Bargaining power of suppliers - Impact of key factors in 2025 and 2030

7.4 Threat of new entrants

Threat of new entrants - Impact of key factors in 2025 and 2030

7.5 Threat of substitutes

Threat of substitutes - Impact of key factors in 2025 and 2030

7.6 Threat of rivalry

Threat of rivalry - Impact of key factors in 2025 and 2030

7.7 Market condition

Chart on Market condition - Five forces 2025 and 2030

8. Market Segmentation by End-user

8.1 Market segments

Chart on End-user - Market share 2025-2030 (%)
Data Table on End-user - Market share 2025-2030 (%)

8.2 Comparison by End-user

Chart on Comparison by End-user
Data Table on Comparison by End-user

8.3 Packaging - Market size and forecast 2025-2030

Chart on Packaging - Market size and forecast 2025-2030 ($ million)
Data Table on Packaging - Market size and forecast 2025-2030 ($ million)
Chart on Packaging - Year-over-year growth 2025-2030 (%)
Data Table on Packaging - Year-over-year growth 2025-2030 (%)

8.4 Textile - Market size and forecast 2025-2030

Chart on Textile - Market size and forecast 2025-2030 ($ million)
Data Table on Textile - Market size and forecast 2025-2030 ($ million)
Chart on Textile - Year-over-year growth 2025-2030 (%)
Data Table on Textile - Year-over-year growth 2025-2030 (%)

8.5 Agriculture - Market size and forecast 2025-2030

Chart on Agriculture - Market size and forecast 2025-2030 ($ million)
Data Table on Agriculture - Market size and forecast 2025-2030 ($ million)
Chart on Agriculture - Year-over-year growth 2025-2030 (%)
Data Table on Agriculture - Year-over-year growth 2025-2030 (%)

8.6 Others - Market size and forecast 2025-2030

Chart on Others - Market size and forecast 2025-2030 ($ million)
Data Table on Others - Market size and forecast 2025-2030 ($ million)
Chart on Others - Year-over-year growth 2025-2030 (%)
Data Table on Others - Year-over-year growth 2025-2030 (%)

8.7 Market opportunity by End-user

Market opportunity by End-user ($ million)
Data Table on Market opportunity by End-user ($ million)

9. Market Segmentation by Source

9.1 Market segments

Chart on Source - Market share 2025-2030 (%)
Data Table on Source - Market share 2025-2030 (%)

9.2 Comparison by Source

Chart on Comparison by Source
Data Table on Comparison by Source

9.3 Corn starch - Market size and forecast 2025-2030

Chart on Corn starch - Market size and forecast 2025-2030 ($ million)
Data Table on Corn starch - Market size and forecast 2025-2030 ($ million)
Chart on Corn starch - Year-over-year growth 2025-2030 (%)
Data Table on Corn starch - Year-over-year growth 2025-2030 (%)

9.4 Cassava starch - Market size and forecast 2025-2030

Chart on Cassava starch - Market size and forecast 2025-2030 ($ million)
Data Table on Cassava starch - Market size and forecast 2025-2030 ($ million)
Chart on Cassava starch - Year-over-year growth 2025-2030 (%)
Data Table on Cassava starch - Year-over-year growth 2025-2030 (%)

9.5 Potato starch - Market size and forecast 2025-2030

Chart on Potato starch - Market size and forecast 2025-2030 ($ million)
Data Table on Potato starch - Market size and forecast 2025-2030 ($ million)
Chart on Potato starch - Year-over-year growth 2025-2030 (%)
Data Table on Potato starch - Year-over-year growth 2025-2030 (%)

9.6 Wheat starch - Market size and forecast 2025-2030

Chart on Wheat starch - Market size and forecast 2025-2030 ($ million)
Data Table on Wheat starch - Market size and forecast 2025-2030 ($ million)
Chart on Wheat starch - Year-over-year growth 2025-2030 (%)
Data Table on Wheat starch - Year-over-year growth 2025-2030 (%)

9.7 Market opportunity by Source

Market opportunity by Source ($ million)
Data Table on Market opportunity by Source ($ million)

10. Market Segmentation by Type

10.1 Market segments

Chart on Type - Market share 2025-2030 (%)
Data Table on Type - Market share 2025-2030 (%)

10.2 Comparison by Type

Chart on Comparison by Type
Data Table on Comparison by Type

10.3 Bio-degradable - Market size and forecast 2025-2030

Chart on Bio-degradable - Market size and forecast 2025-2030 ($ million)
Data Table on Bio-degradable - Market size and forecast 2025-2030 ($ million)
Chart on Bio-degradable - Year-over-year growth 2025-2030 (%)
Data Table on Bio-degradable - Year-over-year growth 2025-2030 (%)

10.4 Durable - Market size and forecast 2025-2030

Chart on Durable - Market size and forecast 2025-2030 ($ million)
Data Table on Durable - Market size and forecast 2025-2030 ($ million)
Chart on Durable - Year-over-year growth 2025-2030 (%)
Data Table on Durable - Year-over-year growth 2025-2030 (%)

10.5 Market opportunity by Type

Market opportunity by Type ($ million)
Data Table on Market opportunity by Type ($ million)

11. Customer Landscape

11.1 Customer landscape overview

Analysis of price sensitivity, lifecycle, customer purchase basket, adoption rates, and purchase criteria

12. Geographic Landscape

12.1 Geographic segmentation

Chart on Market share by geography 2025-2030 (%)
Data Table on Market share by geography 2025-2030 (%)

12.2 Geographic comparison

Chart on Geographic comparison
Data Table on Geographic comparison

12.3 Europe - Market size and forecast 2025-2030

Chart on Europe - Market size and forecast 2025-2030 ($ million)
Data Table on Europe - Market size and forecast 2025-2030 ($ million)
Chart on Europe - Year-over-year growth 2025-2030 (%)
Data Table on Europe - Year-over-year growth 2025-2030 (%)
Chart on Regional Comparison - Europe
Data Table on Regional Comparison - Europe

12.3.1 Germany - Market size and forecast 2025-2030

Chart on Germany - Market size and forecast 2025-2030 ($ million)
Data Table on Germany - Market size and forecast 2025-2030 ($ million)
Chart on Germany - Year-over-year growth 2025-2030 (%)
Data Table on Germany - Year-over-year growth 2025-2030 (%)

12.3.2 France - Market size and forecast 2025-2030

Chart on France - Market size and forecast 2025-2030 ($ million)
Data Table on France - Market size and forecast 2025-2030 ($ million)
Chart on France - Year-over-year growth 2025-2030 (%)
Data Table on France - Year-over-year growth 2025-2030 (%)

12.3.3 UK - Market size and forecast 2025-2030

Chart on UK - Market size and forecast 2025-2030 ($ million)
Data Table on UK - Market size and forecast 2025-2030 ($ million)
Chart on UK - Year-over-year growth 2025-2030 (%)
Data Table on UK - Year-over-year growth 2025-2030 (%)

12.3.4 Italy - Market size and forecast 2025-2030

Chart on Italy - Market size and forecast 2025-2030 ($ million)
Data Table on Italy - Market size and forecast 2025-2030 ($ million)
Chart on Italy - Year-over-year growth 2025-2030 (%)
Data Table on Italy - Year-over-year growth 2025-2030 (%)

12.3.5 Spain - Market size and forecast 2025-2030

Chart on Spain - Market size and forecast 2025-2030 ($ million)
Data Table on Spain - Market size and forecast 2025-2030 ($ million)
Chart on Spain - Year-over-year growth 2025-2030 (%)
Data Table on Spain - Year-over-year growth 2025-2030 (%)

12.3.6 The Netherlands - Market size and forecast 2025-2030

Chart on The Netherlands - Market size and forecast 2025-2030 ($ million)
Data Table on The Netherlands - Market size and forecast 2025-2030 ($ million)
Chart on The Netherlands - Year-over-year growth 2025-2030 (%)
Data Table on The Netherlands - Year-over-year growth 2025-2030 (%)

12.4 APAC - Market size and forecast 2025-2030

Chart on APAC - Market size and forecast 2025-2030 ($ million)
Data Table on APAC - Market size and forecast 2025-2030 ($ million)
Chart on APAC - Year-over-year growth 2025-2030 (%)
Data Table on APAC - Year-over-year growth 2025-2030 (%)
Chart on Regional Comparison - APAC
Data Table on Regional Comparison - APAC

12.4.1 China - Market size and forecast 2025-2030

Chart on China - Market size and forecast 2025-2030 ($ million)
Data Table on China - Market size and forecast 2025-2030 ($ million)
Chart on China - Year-over-year growth 2025-2030 (%)
Data Table on China - Year-over-year growth 2025-2030 (%)

12.4.2 India - Market size and forecast 2025-2030

Chart on India - Market size and forecast 2025-2030 ($ million)
Data Table on India - Market size and forecast 2025-2030 ($ million)
Chart on India - Year-over-year growth 2025-2030 (%)
Data Table on India - Year-over-year growth 2025-2030 (%)

12.4.3 Japan - Market size and forecast 2025-2030

Chart on Japan - Market size and forecast 2025-2030 ($ million)
Data Table on Japan - Market size and forecast 2025-2030 ($ million)
Chart on Japan - Year-over-year growth 2025-2030 (%)
Data Table on Japan - Year-over-year growth 2025-2030 (%)

12.4.4 South Korea - Market size and forecast 2025-2030

Chart on South Korea - Market size and forecast 2025-2030 ($ million)
Data Table on South Korea - Market size and forecast 2025-2030 ($ million)
Chart on South Korea - Year-over-year growth 2025-2030 (%)
Data Table on South Korea - Year-over-year growth 2025-2030 (%)

12.4.5 Australia - Market size and forecast 2025-2030

Chart on Australia - Market size and forecast 2025-2030 ($ million)
Data Table on Australia - Market size and forecast 2025-2030 ($ million)
Chart on Australia - Year-over-year growth 2025-2030 (%)
Data Table on Australia - Year-over-year growth 2025-2030 (%)

12.4.6 Indonesia - Market size and forecast 2025-2030

Chart on Indonesia - Market size and forecast 2025-2030 ($ million)
Data Table on Indonesia - Market size and forecast 2025-2030 ($ million)
Chart on Indonesia - Year-over-year growth 2025-2030 (%)
Data Table on Indonesia - Year-over-year growth 2025-2030 (%)

12.5 North America - Market size and forecast 2025-2030

Chart on North America - Market size and forecast 2025-2030 ($ million)
Data Table on North America - Market size and forecast 2025-2030 ($ million)
Chart on North America - Year-over-year growth 2025-2030 (%)
Data Table on North America - Year-over-year growth 2025-2030 (%)
Chart on Regional Comparison - North America
Data Table on Regional Comparison - North America

12.5.1 US - Market size and forecast 2025-2030

Chart on US - Market size and forecast 2025-2030 ($ million)
Data Table on US - Market size and forecast 2025-2030 ($ million)
Chart on US - Year-over-year growth 2025-2030 (%)
Data Table on US - Year-over-year growth 2025-2030 (%)

12.5.2 Canada - Market size and forecast 2025-2030

Chart on Canada - Market size and forecast 2025-2030 ($ million)
Data Table on Canada - Market size and forecast 2025-2030 ($ million)
Chart on Canada - Year-over-year growth 2025-2030 (%)
Data Table on Canada - Year-over-year growth 2025-2030 (%)

12.5.3 Mexico - Market size and forecast 2025-2030

Chart on Mexico - Market size and forecast 2025-2030 ($ million)
Data Table on Mexico - Market size and forecast 2025-2030 ($ million)
Chart on Mexico - Year-over-year growth 2025-2030 (%)
Data Table on Mexico - Year-over-year growth 2025-2030 (%)

12.6 South America - Market size and forecast 2025-2030

Chart on South America - Market size and forecast 2025-2030 ($ million)
Data Table on South America - Market size and forecast 2025-2030 ($ million)
Chart on South America - Year-over-year growth 2025-2030 (%)
Data Table on South America - Year-over-year growth 2025-2030 (%)
Chart on Regional Comparison - South America
Data Table on Regional Comparison - South America

12.6.1 Brazil - Market size and forecast 2025-2030

Chart on Brazil - Market size and forecast 2025-2030 ($ million)
Data Table on Brazil - Market size and forecast 2025-2030 ($ million)
Chart on Brazil - Year-over-year growth 2025-2030 (%)
Data Table on Brazil - Year-over-year growth 2025-2030 (%)

12.6.2 Argentina - Market size and forecast 2025-2030

Chart on Argentina - Market size and forecast 2025-2030 ($ million)
Data Table on Argentina - Market size and forecast 2025-2030 ($ million)
Chart on Argentina - Year-over-year growth 2025-2030 (%)
Data Table on Argentina - Year-over-year growth 2025-2030 (%)

12.6.3 Chile - Market size and forecast 2025-2030

Chart on Chile - Market size and forecast 2025-2030 ($ million)
Data Table on Chile - Market size and forecast 2025-2030 ($ million)
Chart on Chile - Year-over-year growth 2025-2030 (%)
Data Table on Chile - Year-over-year growth 2025-2030 (%)

12.7 Middle East and Africa - Market size and forecast 2025-2030

Chart on Middle East and Africa - Market size and forecast 2025-2030 ($ million)
Data Table on Middle East and Africa - Market size and forecast 2025-2030 ($ million)
Chart on Middle East and Africa - Year-over-year growth 2025-2030 (%)
Data Table on Middle East and Africa - Year-over-year growth 2025-2030 (%)
Chart on Regional Comparison - Middle East and Africa
Data Table on Regional Comparison - Middle East and Africa

12.7.1 UAE - Market size and forecast 2025-2030

Chart on UAE - Market size and forecast 2025-2030 ($ million)
Data Table on UAE - Market size and forecast 2025-2030 ($ million)
Chart on UAE - Year-over-year growth 2025-2030 (%)
Data Table on UAE - Year-over-year growth 2025-2030 (%)

12.7.2 Saudi Arabia - Market size and forecast 2025-2030

Chart on Saudi Arabia - Market size and forecast 2025-2030 ($ million)
Data Table on Saudi Arabia - Market size and forecast 2025-2030 ($ million)
Chart on Saudi Arabia - Year-over-year growth 2025-2030 (%)
Data Table on Saudi Arabia - Year-over-year growth 2025-2030 (%)

12.7.3 South Africa - Market size and forecast 2025-2030

Chart on South Africa - Market size and forecast 2025-2030 ($ million)
Data Table on South Africa - Market size and forecast 2025-2030 ($ million)
Chart on South Africa - Year-over-year growth 2025-2030 (%)
Data Table on South Africa - Year-over-year growth 2025-2030 (%)

12.7.4 Egypt - Market size and forecast 2025-2030

Chart on Egypt - Market size and forecast 2025-2030 ($ million)
Data Table on Egypt - Market size and forecast 2025-2030 ($ million)
Chart on Egypt - Year-over-year growth 2025-2030 (%)
Data Table on Egypt - Year-over-year growth 2025-2030 (%)

12.7.5 Kenya - Market size and forecast 2025-2030

Chart on Kenya - Market size and forecast 2025-2030 ($ million)
Data Table on Kenya - Market size and forecast 2025-2030 ($ million)
Chart on Kenya - Year-over-year growth 2025-2030 (%)
Data Table on Kenya - Year-over-year growth 2025-2030 (%)

12.8 Market opportunity by geography

Market opportunity by geography ($ million)
Data Tables on Market opportunity by geography ($ million)

13. Drivers, Challenges, and Opportunity

13.1 Market drivers

Escalating regulatory mandates and legislative bans on conventional plastics
Preference of starch polymer for food processing over animal-derived thickening, gelling, and emulsifying agents
Rising consumer awareness about plastic pollution and environmental sustainability

13.2 Market challenges

Volatility in raw material costs and agricultural supply constraints
Regulations for starch polymer manufacturers
Performance issues related to reliability

13.3 Impact of drivers and challenges

Impact of drivers and challenges in 2025 and 2030

13.4 Market opportunities

Integration of advanced biopolymer blends and nanotechnology for enhanced barrier properties
Rise in availability of renewable feedstock
Growing purchasing power and greater economic growth in APAC

14. Competitive Landscape

14.1 Overview

14.2

Overview on criticality of inputs and factors of differentiation

14.3 Landscape disruption

Overview on factors of disruption

14.4 Industry risks

Impact of key risks on business

15. Competitive Analysis

15.1 Companies profiled

Companies covered

15.2 Company ranking index

15.3 Market positioning of companies

Matrix on companies position and classification

15.4 AGRANA Beteiligungs AG

AGRANA Beteiligungs AG - Overview
AGRANA Beteiligungs AG - Business segments
AGRANA Beteiligungs AG - Key news
AGRANA Beteiligungs AG - Key offerings
AGRANA Beteiligungs AG - Segment focus
SWOT

15.5 Biome Bioplastics Ltd.

Biome Bioplastics Ltd. - Overview
Biome Bioplastics Ltd. - Product / Service
Biome Bioplastics Ltd. - Key offerings
SWOT

15.6 Biotec GmbH Co. and KG

Biotec GmbH Co. and KG - Overview
Biotec GmbH Co. and KG - Product / Service
Biotec GmbH Co. and KG - Key offerings
SWOT

15.7 Braskem SA

Braskem SA - Overview
Braskem SA - Business segments
Braskem SA - Key offerings
Braskem SA - Segment focus
SWOT

15.8 Corbion N.V.

Corbion N.V. - Overview
Corbion N.V. - Business segments
Corbion N.V. - Key news
Corbion N.V. - Key offerings
Corbion N.V. - Segment focus
SWOT

15.9 DuPont de Nemours Inc.

DuPont de Nemours Inc. - Overview
DuPont de Nemours Inc. - Business segments
DuPont de Nemours Inc. - Key news
DuPont de Nemours Inc. - Key offerings
DuPont de Nemours Inc. - Segment focus
SWOT

15.10 Fkur Kunststoff GmbH

Fkur Kunststoff GmbH - Overview
Fkur Kunststoff GmbH - Product / Service
Fkur Kunststoff GmbH - Key offerings
SWOT

15.11 Green Dot Bioplastics Inc.

Green Dot Bioplastics Inc. - Overview
Green Dot Bioplastics Inc. - Product / Service
Green Dot Bioplastics Inc. - Key offerings
SWOT

15.12 JAPAN CORN STARCH CO., LTD.

JAPAN CORN STARCH CO., LTD. - Overview
JAPAN CORN STARCH CO., LTD. - Product / Service
JAPAN CORN STARCH CO., LTD. - Key offerings
SWOT

15.13 KURARAY Co. Ltd.

KURARAY Co. Ltd. - Overview
KURARAY Co. Ltd. - Business segments
KURARAY Co. Ltd. - Key news
KURARAY Co. Ltd. - Key offerings
KURARAY Co. Ltd. - Segment focus
SWOT

15.14 Mitsubishi Chemical Corp.

Mitsubishi Chemical Corp. - Overview
Mitsubishi Chemical Corp. - Business segments
Mitsubishi Chemical Corp. - Key offerings
Mitsubishi Chemical Corp. - Segment focus
SWOT

15.15 NatureWorks LLC

NatureWorks LLC - Overview
NatureWorks LLC - Product / Service
NatureWorks LLC - Key offerings
SWOT

15.16 Novamont S.p.A.

Novamont S.p.A. - Overview
Novamont S.p.A. - Product / Service
Novamont S.p.A. - Key offerings
SWOT

15.17 SPAC Starch Products Ltd.

SPAC Starch Products Ltd. - Overview
SPAC Starch Products Ltd. - Product / Service
SPAC Starch Products Ltd. - Key offerings
SWOT

15.18 Toray Industries Inc.

Toray Industries Inc. - Overview
Toray Industries Inc. - Business segments
Toray Industries Inc. - Key news
Toray Industries Inc. - Key offerings
Toray Industries Inc. - Segment focus
SWOT

16. Appendix

16.1 Scope of the report

Market definition
Objectives
Notes and caveats

16.2 Inclusions and exclusions checklist

Inclusions checklist
Exclusions checklist

16.3 Currency conversion rates for US$

16.4 Research methodology

16.5 Data procurement

Information sources

16.6 Data validation

16.7 Validation techniques employed for market sizing

16.8 Data synthesis

16.9 360 degree market analysis

16.10 List of abbreviations

Research Methodology

Technavio presents a detailed picture of the market by way of study, synthesis, and summation of data from multiple sources. The analysts have presented the various facets of the market with a particular focus on identifying the key industry influencers. The data thus presented is comprehensive, reliable, and the result of extensive research, both primary and secondary.

INFORMATION SOURCES

Primary sources

  • Manufacturers and suppliers
  • Channel partners
  • Industry experts
  • Strategic decision makers

Secondary sources

  • Industry journals and periodicals
  • Government data
  • Financial reports of key industry players
  • Historical data
  • Press releases

DATA ANALYSIS

Data Synthesis

  • Collation of data
  • Estimation of key figures
  • Analysis of derived insights

Data Validation

  • Triangulation with data models
  • Reference against proprietary databases
  • Corroboration with industry experts

REPORT WRITING

Qualitative

  • Market drivers
  • Market challenges
  • Market trends
  • Five forces analysis

Quantitative

  • Market size and forecast
  • Market segmentation
  • Geographical insights
  • Competitive landscape

Interested in this report?

Get your sample now to see our research methodology and insights!

Download Now

Frequently Asked Questions

Starch Polymer market growth will increase by USD 372.3 million during 2026-2030.

The Starch Polymer market is expected to grow at a CAGR of 4.6% during 2026-2030.

Starch Polymer market is segmented by End-user (Packaging, Textile, Agriculture, Others) Source (Corn starch, Cassava starch, Potato starch, Wheat starch) Type (Bio-degradable, Durable)

AGRANA Beteiligungs AG, Biome Bioplastics Ltd., Biotec GmbH Co. and KG, Braskem SA, Corbion N.V., DuPont de Nemours Inc., Fkur Kunststoff GmbH, Green Dot Bioplastics Inc., JAPAN CORN STARCH CO., LTD., KURARAY Co. Ltd., Mitsubishi Chemical Corp., NatureWorks LLC, Novamont S.p.A., SPAC Starch Products Ltd., Toray Industries Inc. are a few of the key vendors in the Starch Polymer market.

Europe will register the highest growth rate of 44.7% among the other regions. Therefore, the Starch Polymer market in Europe is expected to garner significant business opportunities for the vendors during the forecast period.

Germany, France, UK, Italy, Spain, The Netherlands, China, India, Japan, South Korea, Australia, Indonesia, US, Canada, Mexico, Brazil, Argentina, Chile, UAE, Saudi Arabia, South Africa, Egypt, Kenya

  • Escalating regulatory mandates and legislative bans on conventional plastics is the driving factor this market.

The Starch Polymer market vendors should focus on grabbing business opportunities from the End-user segment as it accounted for the largest market share in the base year.