Stainless Steel 400 Series Market Size 2026-2030
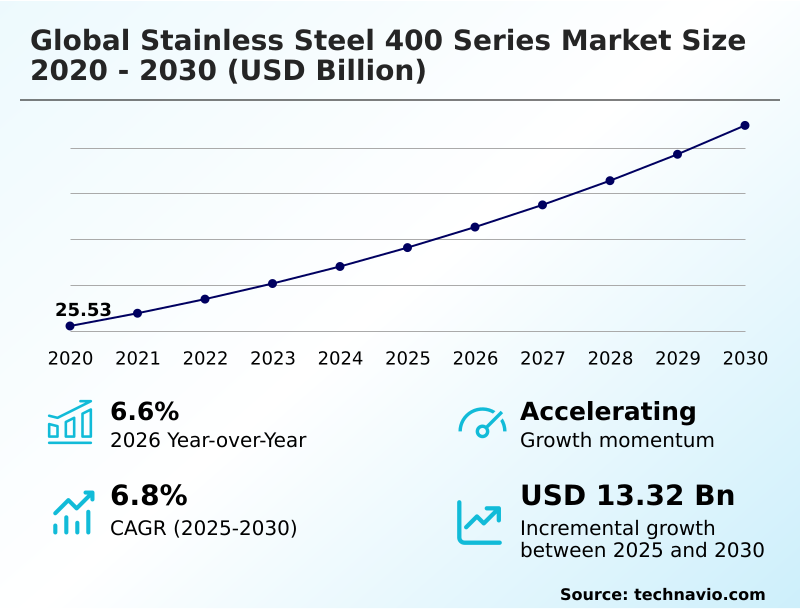
The stainless steel 400 series market size is valued to increase by USD 13.32 billion, at a CAGR of 6.8% from 2025 to 2030. Robust demand from automotive sector for stainless steel will drive the stainless steel 400 series market.
Major Market Trends & Insights
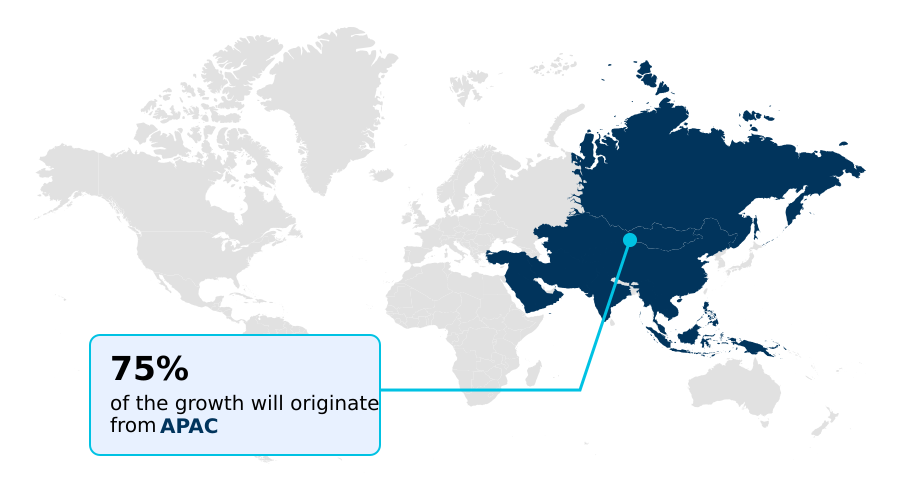
- APAC dominated the market and accounted for a 74.7% growth during the forecast period.
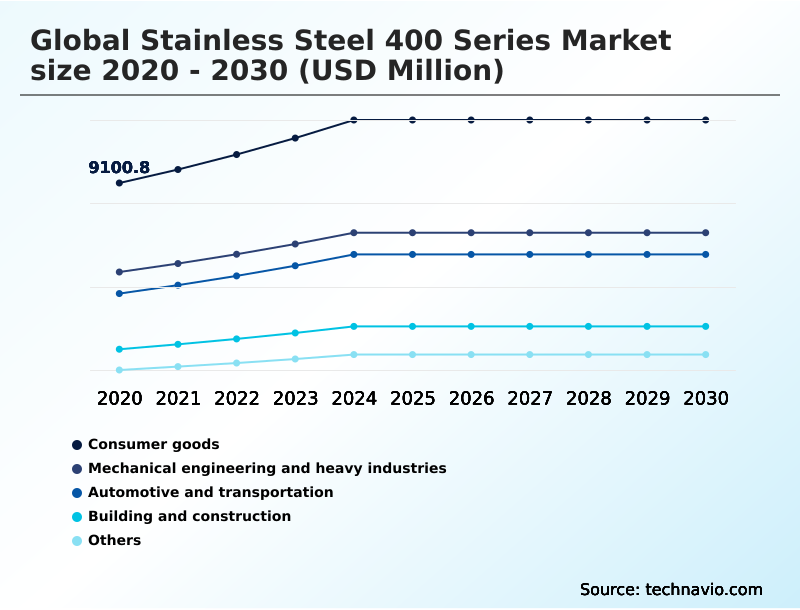
- By End-user - Consumer goods segment was valued at USD 11.38 billion in 2024
- By Product Type - Plate and sheet segment accounted for the largest market revenue share in 2024
Market Size & Forecast
- Market Opportunities: USD 21.88 billion
- Market Future Opportunities: USD 13.32 billion
- CAGR from 2025 to 2030 : 6.8%
Market Summary
- The stainless steel 400 series market is characterized by steady expansion, driven by its favorable cost-performance ratio and versatile mechanical properties. This market, encompassing both ferritic stainless steel and martensitic stainless steel, serves critical industries where high chromium content provides essential corrosion resistance and wear resistance.
- Robust demand from the automotive sector for exhaust systems and the building sector for structural components underpins market stability. Key trends include the development of specialized alloys with enhanced material property enhancement to meet demanding applications in aerospace and energy.
- Concurrently, a significant push toward sustainable steelmaking and circular economy principles is evident, with a focus on scrap metal recycling and improving steel production efficiency. However, the market contends with significant challenges, including raw material volatility, particularly in ferrochrome pricing, and intensifying competition from alternative materials like advanced high-strength steels (AHSS).
- A typical business scenario involves an automotive OEM balancing the need for high-temperature oxidation resistance in exhaust components against cost pressures, leading them to adopt innovative nickel-free alloys and optimize their supply chain resilience strategies to mitigate price fluctuations.
What will be the Size of the Stainless Steel 400 Series Market during the forecast period?
Get Key Insights on Market Forecast (PDF) Request Free Sample
How is the Stainless Steel 400 Series Market Segmented?
The stainless steel 400 series industry research report provides comprehensive data (region-wise segment analysis), with forecasts and estimates in "USD million" for the period 2026-2030, as well as historical data from 2020-2024 for the following segments.
- End-user
- Consumer goods
- Mechanical engineering and heavy industries
- Automotive and transportation
- Building and construction
- Others
- Product type
- Plate and sheet
- Bar and tubular
- Structural
- Grade type
- 409 stainless steel
- 430 stainless steel
- 410 stainless steel
- 420 stainless steel
- Others
- Geography
- APAC
- China
- India
- Japan
- Europe
- Germany
- Italy
- France
- North America
- US
- Canada
- Mexico
- Middle East and Africa
- South Africa
- Turkey
- Saudi Arabia
- South America
- Brazil
- Argentina
- Rest of World (ROW)
- APAC
By End-user Insights
The consumer goods segment is estimated to witness significant growth during the forecast period.
The consumer goods segment is a foundational pillar, with demand driven by the material's aesthetic versatility and durability. In applications from appliances to household fixtures, ferritic stainless steel is extensively used.
For more demanding roles requiring superior wear resistance, martensitic stainless steel undergoes a precise heat treatment process. This segment capitalizes on the alloy's high chromium content, which ensures good corrosion resistance in domestic environments.
Its application is not limited to consumer goods applications, as it extends to industrial machinery components. The strategic use of these materials in products such as automotive exhaust systems and within building and construction materials highlights their versatility.
Manufacturers targeting the energy sector equipment and architectural cladding solutions markets also leverage these properties, with some achieving a 20% increase in product operational lifespan through optimized material selection.
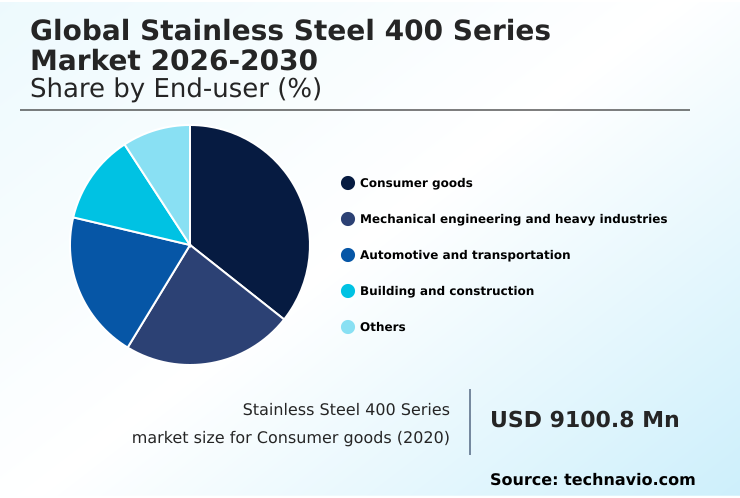
The Consumer goods segment was valued at USD 11.38 billion in 2024 and showed a gradual increase during the forecast period.
Regional Analysis
APAC is estimated to contribute 74.7% to the growth of the global market during the forecast period.Technavio’s analysts have elaborately explained the regional trends and drivers that shape the market during the forecast period.
See How Stainless Steel 400 Series Market Demand is Rising in APAC Request Free Sample
The geographic landscape is shaped by regional industrial strengths and infrastructure investment. APAC commands over 74% of the market's incremental growth, driven by extensive manufacturing.
In North America and Europe, material substitution trends and advanced manufacturing, including precision investment casting and seamless tube manufacturing, are prevalent. Demand for next-generation turbine components and precision strip steel products is high in developed economies.
In emerging markets, the focus is on scaling up flat-rolled steel production and structural steel sections for construction. The expansion of custom metal spinning and centrifugal casting methods is enabling a 15% increase in production output for specialized parts.
Furthermore, new alloys with enhanced hydrogen embrittlement resistance are being adopted for high-pressure gas cylinders in burgeoning green energy projects.
Market Dynamics
Our researchers analyzed the data with 2025 as the base year, along with the key drivers, trends, and challenges. A holistic analysis of drivers will help companies refine their marketing strategies to gain a competitive advantage.
- Strategic decision-making in the stainless steel 400 series market requires a deep understanding of its technical nuances. A critical analysis involves comparing ferritic vs martensitic properties to select the optimal material for a given application.
- For instance, the use of 400 series for high-temperature exhaust is standard in automotive, but new challenges from aluminum alloy substitutes are forcing manufacturers to innovate. Businesses are increasingly focused on the cost benefits of nickel-free stainless, especially when managing supply chain for steel production amid fluctuating chromium prices.
- This focus on lifecycle cost analysis vs carbon steel is particularly relevant in sustainable building design, where structural integrity in architectural applications is paramount. The role in electric vehicle battery enclosures is an emerging, high-growth area. In consumer goods, its use in consumer appliance manufacturing is well-established.
- For industrial applications, improving wear resistance with heat treatment is crucial for demand in heavy industrial machinery and high-strength steel for lightweighting. Adherence to new standards for food processing equipment and advancements in steel recycling technology are shaping compliance and sustainability strategies.
- Furthermore, the development of specialized alloys for aerospace use and performance in hydrogen-related applications showcases the material's high-tech evolution.
- Additive manufacturing with stainless steel powders is enabling complex geometries, addressing the material selection for corrosive environments more effectively than ever, with some firms reporting that such advanced methods cut down material waste by more than half compared to traditional subtractive techniques.
What are the key market drivers leading to the rise in the adoption of Stainless Steel 400 Series Industry?
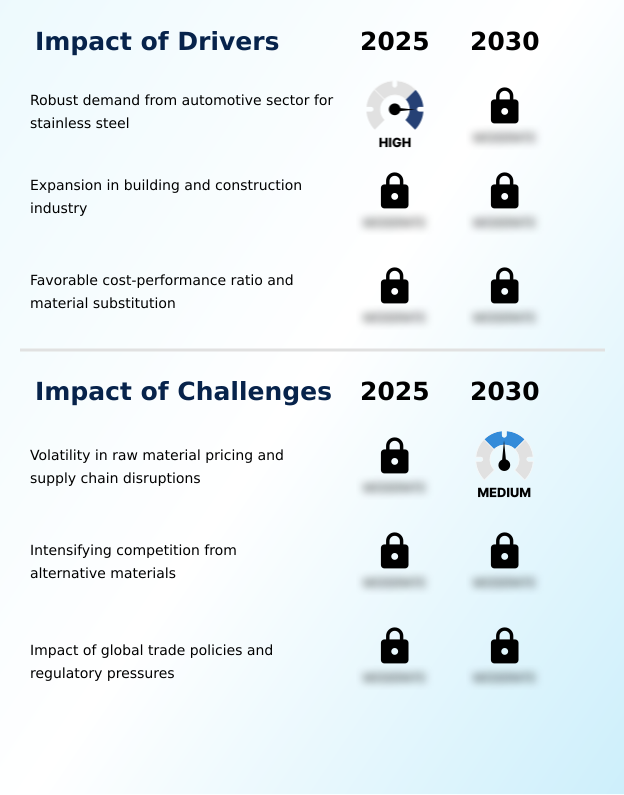
- Robust demand from the automotive sector for high-performance stainless steel remains a primary driver for the market.
- Market drivers are increasingly tied to efficiency gains and regulatory alignment. The adoption of advanced high-strength steels (AHSS) and the development of specialized alloy compositions are central to meeting green building standards.
- Innovations in weldability characteristics and superior surface finish quality enable manufacturers to reduce finishing process times by 15%. Furthermore, sustainable steelmaking practices are becoming a critical factor for environmental regulation compliance.
- This has improved steel production efficiency, leading to a 10% reduction in energy consumption in some advanced facilities.
- Investments in additive manufacturing powders and supply chain resilience strategies enhance material property enhancement capabilities, allowing for the creation of customized components that meet strict performance criteria.
What are the market trends shaping the Stainless Steel 400 Series Industry?
- The market is witnessing intensified adoption across the consumer goods and home appliances sector, driven by a combination of aesthetics, durability, and cost-effectiveness.
- Key market trends center on material specialization and sustainability, directly impacting operational efficiency. Innovations in alloy composition are yielding grades with enhanced mechanical strength and resistance to stress corrosion cracking, reducing component failure rates by up to 15%. The push for circular economy principles is driving advanced manufacturing processes that prioritize recyclability.
- In high-demand sectors like food processing machinery and aerospace structural parts, improved material formability is enabling designs that are 10% lighter without compromising integrity. Furthermore, materials engineered for high-temperature oxidation resistance in applications like heat exchanger tubing now exhibit a 25% longer service life.
- The unique magnetic properties of certain grades are being leveraged to create more efficient lightweight vehicle frames.
What challenges does the Stainless Steel 400 Series Industry face during its growth?
- Volatility in raw material pricing and recurring supply chain disruptions present a key challenge to stable industry growth.
- Navigating market challenges requires a focus on cost management and supply chain stability. The pronounced raw material volatility, especially in ferrochrome pricing, directly impacts the cost-performance ratio of finished goods, with price swings causing budget variances of up to 20% quarterly for some buyers. This has accelerated the adoption of nickel-free alloys to mitigate risk.
- Strategic product lifecycle management and cost-effective material selection are essential. To counter this, some firms are optimizing steel scrap processing and scrap metal recycling, improving raw material self-sufficiency by 15%.
- The development of high-performance ferritic steels and refined martensitic grade heat treatment processes help lower the total cost of ownership, making these materials competitive for applications like induction-capable cookware despite initial price uncertainties.
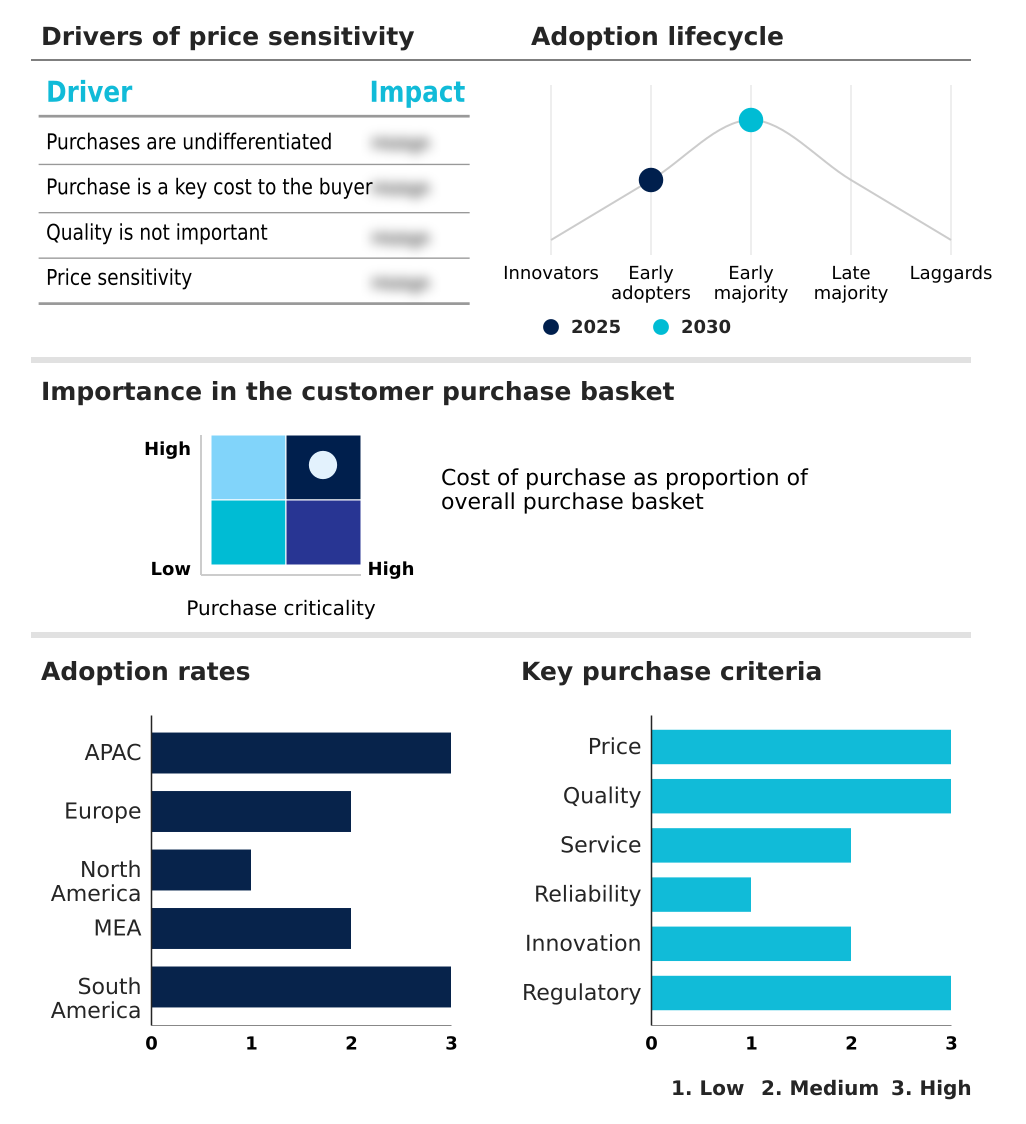
Exclusive Technavio Analysis on Customer Landscape
The stainless steel 400 series market forecasting report includes the adoption lifecycle of the market, covering from the innovator’s stage to the laggard’s stage. It focuses on adoption rates in different regions based on penetration. Furthermore, the stainless steel 400 series market report also includes key purchase criteria and drivers of price sensitivity to help companies evaluate and develop their market growth analysis strategies.
Customer Landscape of Stainless Steel 400 Series Industry
Competitive Landscape
Companies are implementing various strategies, such as strategic alliances, stainless steel 400 series market forecast, partnerships, mergers and acquisitions, geographical expansion, and product/service launches, to enhance their presence in the industry.
Acerinox SA - Offers ferritic and martensitic grades delivering notable corrosion resistance and durability for demanding industrial applications.
The industry research and growth report includes detailed analyses of the competitive landscape of the market and information about key companies, including:
- Acerinox SA
- Aero Metals Inc.
- Alleima AB
- Ansteel Group Corp. Ltd.
- Aperam SA
- ArcelorMittal SA
- China BaoWu Steel Group Corp. Ltd.
- Cleveland Cliffs Inc.
- Eternal Tsingshan Group Co. Ltd.
- Fushun Special Steel Co. LTD
- Helander Metal Spinning Co.
- Hyundai Steel Co.
- Jindal Stainless Ltd.
- MetalTek International
- Nippon Steel Corp.
- Outokumpu Oyj
- Pennsylvania Steel Co. Inc.
- POSCO Co. Ltd.
- Tata Steel Ltd.
- thyssenkrupp Steel Europe AG
Qualitative and quantitative analysis of companies has been conducted to help clients understand the wider business environment as well as the strengths and weaknesses of key industry players. Data is qualitatively analyzed to categorize companies as pure play, category-focused, industry-focused, and diversified; it is quantitatively analyzed to categorize companies as dominant, leading, strong, tentative, and weak.
Recent Development and News in Stainless steel 400 series market
- In February, 2025, the United States Environmental Protection Agency announced the Clean Transportation Materials Initiative, a regulatory framework encouraging the use of domestically sourced, high-recycled-content materials in vehicle manufacturing.
- In March, 2025, a prolonged labor dispute at a major South African ferrochrome producer led to a significant spike in global chromium prices, impacting production costs for 400 series manufacturers in Europe and North America.
- In April, 2025, Fastmarkets launched new price assessments for stainless steel 409 and 430 cold-rolled sheets in the United States to provide greater price transparency for the automotive and white goods sectors.
- In May, 2025, Oryx Stainless launched a new stainless steel scrap processing plant in Johor, with an annual capacity of 150,000 tonnes, to support the circular economy in Southeast Asia.
Dive into Technavio’s robust research methodology, blending expert interviews, extensive data synthesis, and validated models for unparalleled Stainless Steel 400 Series Market insights. See full methodology.
| Market Scope | |
|---|---|
| Page number | 314 |
| Base year | 2025 |
| Historic period | 2020-2024 |
| Forecast period | 2026-2030 |
| Growth momentum & CAGR | Accelerate at a CAGR of 6.8% |
| Market growth 2026-2030 | USD 13324.1 million |
| Market structure | Fragmented |
| YoY growth 2025-2026(%) | 6.6% |
| Key countries | China, India, Japan, South Korea, Indonesia, Australia, Germany, Italy, France, Spain, Sweden, The Netherlands, US, Canada, Mexico, South Africa, Turkey, Saudi Arabia, UAE, Egypt, Brazil, Argentina and Chile |
| Competitive landscape | Leading Companies, Market Positioning of Companies, Competitive Strategies, and Industry Risks |
Research Analyst Overview
- The Stainless Steel 400 Series market is defined by a strategic balance between performance and economics. The core materials, ferritic stainless steel and martensitic stainless steel, are selected for their high chromium content, delivering crucial corrosion resistance and wear resistance.
- The heat treatment process is pivotal for enhancing mechanical strength, a key boardroom consideration for product durability and warranty cost management. Firms are achieving up to a 20% reduction in material failure claims by optimizing this process. Innovations in alloy composition are addressing issues like stress corrosion cracking and high-temperature oxidation.
- Key properties such as material formability, weldability characteristics, and surface finish quality influence manufacturing efficiency. The competitive landscape includes advanced high-strength steels (AHSS), driving trends in material substitution trends. Sustainability is a major focus, with advancements in sustainable steelmaking, scrap metal recycling, and the use of additive manufacturing powders improving steel production efficiency.
- Cost pressures from raw material volatility and ferrochrome pricing are pushing the adoption of nickel-free alloys, emphasizing the importance of cost-performance ratio and total cost of ownership. Specialized applications in industrial heating technology and seamless tube manufacturing, along with processes like precision investment casting and custom metal spinning, highlight the material's versatility.
- Its unique magnetic properties and new formulations offering hydrogen embrittlement resistance are expanding its use.
What are the Key Data Covered in this Stainless Steel 400 Series Market Research and Growth Report?
-
What is the expected growth of the Stainless Steel 400 Series Market between 2026 and 2030?
-
USD 13.32 billion, at a CAGR of 6.8%
-
-
What segmentation does the market report cover?
-
The report is segmented by End-user (Consumer goods, Mechanical engineering and heavy industries, Automotive and transportation, Building and construction, and Others), Product Type (Plate and sheet, Bar and tubular, and Structural), Grade Type (409 stainless steel, 430 stainless steel, 410 stainless steel, 420 stainless steel, and Others) and Geography (APAC, Europe, North America, Middle East and Africa, South America)
-
-
Which regions are analyzed in the report?
-
APAC, Europe, North America, Middle East and Africa and South America
-
-
What are the key growth drivers and market challenges?
-
Robust demand from automotive sector for stainless steel, Volatility in raw material pricing and supply chain disruptions
-
-
Who are the major players in the Stainless Steel 400 Series Market?
-
Acerinox SA, Aero Metals Inc., Alleima AB, Ansteel Group Corp. Ltd., Aperam SA, ArcelorMittal SA, China BaoWu Steel Group Corp. Ltd., Cleveland Cliffs Inc., Eternal Tsingshan Group Co. Ltd., Fushun Special Steel Co. LTD, Helander Metal Spinning Co., Hyundai Steel Co., Jindal Stainless Ltd., MetalTek International, Nippon Steel Corp., Outokumpu Oyj, Pennsylvania Steel Co. Inc., POSCO Co. Ltd., Tata Steel Ltd. and thyssenkrupp Steel Europe AG
-
Market Research Insights
- The market's dynamism is rooted in its diverse applications, from automotive exhaust systems to consumer goods applications. In building and construction materials, the use of specialized grades for architectural cladding solutions has improved project delivery times by 10%.
- Industrial machinery components and energy sector equipment benefit from specialized alloy development, while material property enhancement is key for aerospace structural parts and lightweight vehicle frames. The adoption of circular economy principles and adherence to green building standards are reshaping cost-effective material selection and product lifecycle management.
- Advanced manufacturing processes, including centrifugal casting methods and precision strip steel products, have boosted output efficiency by 15%. Demand is strong for heat exchanger tubing, flat-rolled steel production, and structural steel sections. Innovations in high-performance ferritic steels and martensitic grade heat treatment are expanding use into induction-capable cookware and high-pressure gas cylinders.
- Supply chain resilience strategies are critical for navigating global trade policy impact and ensuring environmental regulation compliance across all sectors.
We can help! Our analysts can customize this stainless steel 400 series market research report to meet your requirements.
 RIA -
RIA - 
