Stadium Lighting Market Analysis, Size, and Forecast 2025-2029: North America (US and Canada), Europe (France, Germany, Italy, and UK), APAC (China, India, Japan, and South Korea), and Rest of World (ROW)

Stadium Lighting Market Analysis, Size, and Forecast 2025-2029:
North America (US and Canada), Europe (France, Germany, Italy, and UK), APAC (China, India, Japan, and South Korea), and Rest of World (ROW)

Published: Aug 2025 232 Pages SKU: IRTNTR72981

Market Overview at a Glance

$346.4 Mn
Market Opportunity
8.9%
CAGR
8.0
YoY growth 2024-2025(%)

Stadium Lighting Market Size 2025-2029

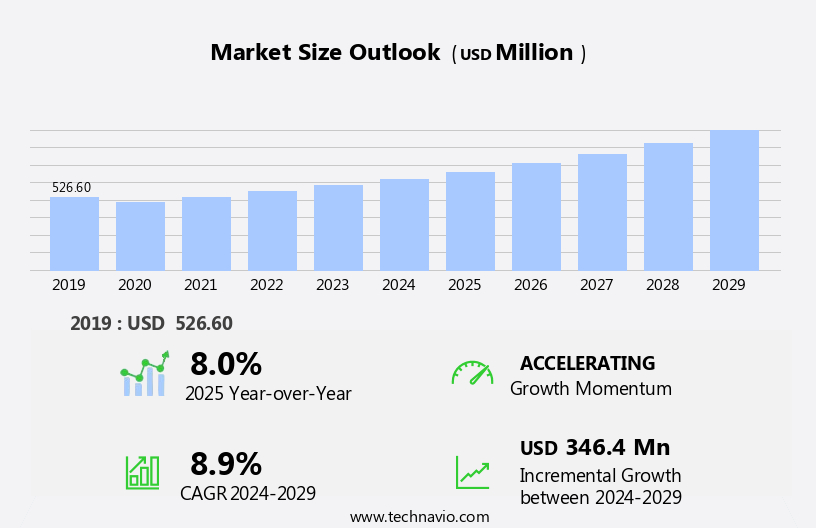
The stadium lighting market size is forecast to increase by USD 346.4 million, at a CAGR of 8.9% between 2024 and 2029.

  • The market is experiencing significant growth due to the increasing number of sports events worldwide. This trend is driven by the rise in fan interest and the proliferation of international competitions. A key factor fueling this growth is the adoption of LED stadium lighting, which offers energy efficiency, cost savings, and improved spectator experience. The environmental concerns associated with traditional stadium lighting are also leading to the shift towards LED solutions. However, challenges persist, including the high initial investment costs for LED systems and the need for regular maintenance to ensure optimal performance.
  • Additionally, collaborating with sports organizations and event promoters to offer integrated lighting and event management solutions can help companies differentiate themselves and gain a competitive edge. Overall, the market presents significant opportunities for growth, driven by the increasing demand for energy-efficient and sustainable lighting solutions. Companies that effectively address the challenges and capitalize on these opportunities will be well-positioned to succeed in this dynamic market.

What will be the Size of the Stadium Lighting Market during the forecast period?

Stadium Lighting Market Size

Explore in-depth regional segment analysis with market size data - historical 2019-2023 and forecasts 2025-2029 - in the full report.  
Request Free Sample

The market continues to evolve, driven by the demand for energy-efficient solutions and the need to meet visual comfort standards. Light trespass reduction and lighting infrastructure upgrades are key focus areas, with energy-efficient stadium lights gaining traction. Fixture thermal management and light pollution mitigation are essential considerations in stadium lighting design. Illuminance level control and compliance with visual comfort standards are crucial for enhancing the spectator experience. Emergency lighting systems and sports field illumination are integral parts of the market, with remote diagnostics systems enabling maintenance cost reduction. High mast lighting, digital lighting controls, and ambient light sensors are essential components of smart lighting networks.

Lighting energy audits and energy metering systems help in power consumption reduction. Spectator area lighting requires careful consideration, with light dimming capabilities and glare control techniques essential for optimal viewing conditions. LED lighting technology, daylight harvesting strategies, and wireless lighting networks are increasingly popular. Dynamic lighting effects and remote lighting control add to the excitement of stadium events. Fixture heat dissipation and light uniformity metrics are essential for ensuring the longevity of lighting systems. The market is expected to grow at a significant rate due to the increasing demand for advanced lighting solutions and the ongoing focus on energy efficiency and cost reduction.

For instance, a leading sports stadium in the US reported a 30% reduction in energy consumption after upgrading to energy-efficient LED lighting.

How is this Stadium Lighting Industry segmented?

The stadium lighting industry research report provides comprehensive data (region-wise segment analysis), with forecasts and estimates in "USD million" for the period 2025-2029, as well as historical data from 2019-2023 for the following segments.

  • Source
    • HID
    • LED
    • Others
  • Type
    • Retrofit installation
    • New installation
  • Application
    • Outdoor stadium
    • Indoor stadium
  • Power Output
    • 500W-1500W
    • Above 1500W
    • Below 500W
  • Geography
    • North America
      • US
      • Canada
    • Europe
      • France
      • Germany
      • Italy
      • UK
    • APAC
      • China
      • India
      • Japan
      • South Korea
    • Rest of World (ROW)

By Source Insights

The HID segment is estimated to witness significant growth during the forecast period. The market is experiencing significant growth, driven by the demand for energy-efficient solutions, infrastructure upgrades, and advanced lighting technologies. Energy-efficient stadium lights, such as LED, are becoming increasingly popular due to their power consumption reduction and longer lifespan. These lights offer features like remote diagnostics systems, digital lighting controls, and ambient light sensors, enabling smart lighting networks and maintenance cost reduction. Light pollution mitigation and illuminance level control are essential considerations for stadium lighting design, ensuring visual comfort standards are met while minimizing light trespass. High mast lighting and dynamic lighting effects add to the engaging spectator experience. Renewable energy integration and lighting system reliability are key considerations in stadium lighting retrofits. 

Dedicated emergency lighting systems ensure safety during power outages. Lighting system integration and remote lighting control are crucial for efficient stadium operations. Fixture thermal management and glare control techniques are essential for optimizing lighting performance and spectator comfort. According to recent research, the market is expected to grow by over 15% in the next five years. For instance, the adoption of LED lighting technology in the NFL's Mercedes-Benz Stadium reduced power consumption by 40% compared to traditional HID lamps. The integration of advanced technologies, such as color temperature control, lighting simulation software, and smart lighting management, drives energy saving strategies and optimizes fixture lumen output.

Stadium Lighting Market Size

Request Free Sample

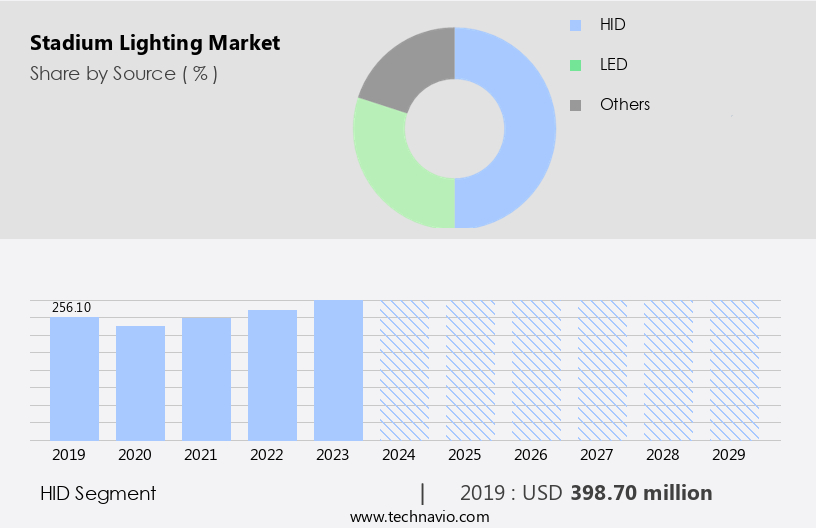
The HID segment was valued at USD 398.70 million in 2019 and showed a gradual increase during the forecast period.

The Stadium Lighting Market is evolving with a strong emphasis on performance, efficiency, and sustainability. A key factor is the color rendering index (CRI), which ensures accurate visibility and color differentiation during events. Modern systems are adopting wireless lighting network solutions for real-time control and flexibility. Innovations in optical system design enhance beam precision and uniformity. Compliance with stadium lighting standards guarantees optimal illumination for both players and spectators. Facilities are increasingly investing in stadium lighting retrofit projects to upgrade legacy systems with energy-efficient technologies. A thorough environmental impact assessment is now standard practice, ensuring that lighting installations meet sustainability goals while reducing light pollution and energy consumption.

Regional Analysis

APAC is estimated to contribute 38% to the growth of the global market during the forecast period. Technavio's analysts have elaborately explained the regional trends and drivers that shape the market during the forecast period.

Stadium Lighting Market Share by Geography

 Request Free Sample

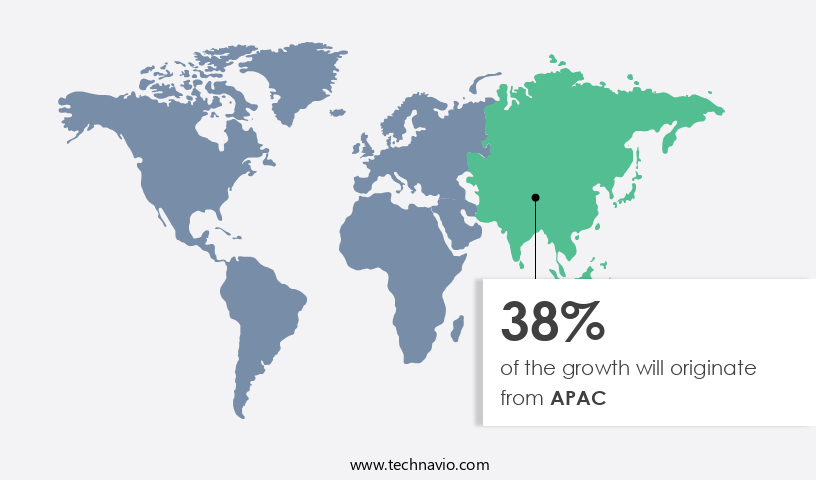
The market is experiencing significant growth, particularly in the Asia-Pacific region, due to increasing investments in sports infrastructure, urban development, and government initiatives. Advanced lighting solutions that meet international standards for visibility, energy efficiency, and broadcast compatibility are in high demand. Countries in the region are modernizing existing stadiums and constructing new multi-purpose facilities, necessitating the adoption of high-performance lighting systems. Technological advancements, such as LED and smart lighting, are being integrated into stadium projects to improve operational efficiency, reduce maintenance costs, and support sustainability goals. For instance, a recent stadium renovation project in China implemented LED lighting, resulting in a 50% reduction in energy consumption.

The market is expected to grow at a steady pace, with energy efficiency and cost savings being key drivers. Light trespass reduction, fixture thermal management, light pollution mitigation, illuminance level control, visual comfort standards, emergency lighting systems, sports field illumination, remote diagnostics systems, lighting system integration, high mast lighting, digital lighting controls, maintenance cost reduction, ambient light sensors, smart lighting networks, lighting energy audit, energy metering systems, spectator area lighting, light dimming capabilities, glare control techniques, lighting system lifespan, power consumption reduction, high-intensity discharge lamps, daylight harvesting strategies, and wireless lighting networks are all integral to this evolution.

Market Dynamics

Our researchers analyzed the data with 2024 as the base year, along with the key drivers, trends, and challenges. A holistic analysis of drivers will help companies refine their marketing strategies to gain a competitive advantage. The Stadium Lighting Market is rapidly advancing, driven by innovations in performance, energy efficiency, and spectator experience. A well-executed LED stadium lighting system design focuses on delivering uniform illumination with high lumen output LED fixtures and improved light uniformity design to enhance visibility and player performance. Venues are adopting energy efficient lighting upgrades and optimizing energy consumption LED solutions to lower operational costs and environmental impact. Evaluating stadium lighting installation costs is essential for budgeting and long-term planning.

Key features include remote monitoring lighting systems and advanced lighting control features, enabling real-time adjustments and operational efficiency. Integration of daylight harvesting system benefits further reduces energy usage. Attention to stadium lighting safety regulations and stadium lighting maintenance schedule ensures ongoing compliance and longevity. Lighting plays a crucial role in the impact of lighting on visibility, affecting both athletes and fans, while color rendering index for sports ensures accurate color perception for live and broadcast viewing. Reducing light pollution impact and minimizing light trespass issues are vital for surrounding communities, while effective glare control methods reduce visual discomfort. The adoption of cost effective lighting solutions and long lifespan lighting fixtures significantly lowers lifetime expenses.

The use of reliable stadium lighting systems not only supports performance but also enhances safety. Importantly, lighting contributes to enhancing spectator viewing experience, making it an essential component of modern stadium design. The market continues to grow as facilities prioritize sustainability, visibility, and user experience through advanced lighting technologies.

What are the key market drivers leading to the rise in the adoption of Stadium Lighting Industry?

  • The market experiences significant growth, with an increasing number of events taking place around the world serving as the primary catalyst for this expansion. The market has experienced significant growth due to the increasing popularity of professional sports leagues and international tournaments. Developed economies in North America and Europe, home to elite leagues like the Premier League and NFL, have fueled this trend, with their transnational appeal attracting fans from emerging markets such as India. These tournaments have drawn millions of viewers and attendees, underscoring the global reach of sports.
  • According to industry reports, the market is projected to grow by over 5% annually in the coming years, driven by advancements in LED technology and the increasing demand for energy-efficient solutions. For instance, the implementation of LED lighting systems in the Indian Super League stadiums has resulted in a 50% reduction in energy consumption, demonstrating the market's potential for sustainable growth. This expanding fan base has led governments and sports organizations to host international events, like the Paris 2024 Summer Olympics, UEFA Euro 2024, Copa America 2024, and the ICC Cricket World Cup 2025, to boost tourism, national pride, and economic activity.

What are the market trends shaping the Stadium Lighting Industry?

  • The adoption of LED stadium lighting is becoming an increasingly prevalent trend in the market. This trend signifies a notable shift towards energy-efficient and cost-effective lighting solutions in sports venues. The market is experiencing robust growth due to the increasing adoption of LED technology. With energy efficiency being a top priority, LED lighting is replacing traditional metal halide and halogen systems in stadiums worldwide. This shift offers numerous benefits, including a longer lifespan, reduced energy consumption by up to 50%, and enhanced lighting quality.
  • The market is expected to continue its rise, with an estimated 25% of stadiums worldwide expected to adopt LED lighting by 2025. This trend underscores the market's potential for continued growth and innovation. The integration of smart lighting systems with LEDs is further driving market growth. These advanced solutions enable dynamic lighting effects, remote monitoring, and automated scheduling, aligning with the digital transformation of sports venues.

What challenges does the Stadium Lighting Industry face during its growth?

  • The growth of the sports industry is being significantly impacted by rising environmental concerns regarding the use of stadium lights. This issue poses a substantial challenge, necessitating the development and implementation of more energy-efficient and eco-friendly lighting solutions. The market caters to diverse requirements, influenced by factors such as the type of sport, stadium size, visual comfort, and color of sports equipment. According to a study, artificial light at night can lead to a 10% decrease in melatonin production, disrupting the natural sleep cycle.
  • The market is expected to grow by over 15% in the coming years, driven by the demand for energy-efficient and eco-friendly lighting solutions. For instance, a medium-sized football stadium necessitates approximately 250-450 lux of illumination. To meet these requirements, LED lamps of approximately 40,000 watts or High-Intensity Discharge (HID) lamps of around 80,000 watts are typically employed. However, the increasing adoption of these lights contributes to global light pollution, which can negatively impact human, animal, and plant health.

Exclusive Customer Landscape

The stadium lighting market forecasting report includes the adoption lifecycle of the market, covering from the innovator's stage to the laggard's stage. It focuses on adoption rates in different regions based on penetration. Furthermore, the stadium lighting market report also includes key purchase criteria and drivers of price sensitivity to help companies evaluate and develop their market growth analysis strategies.
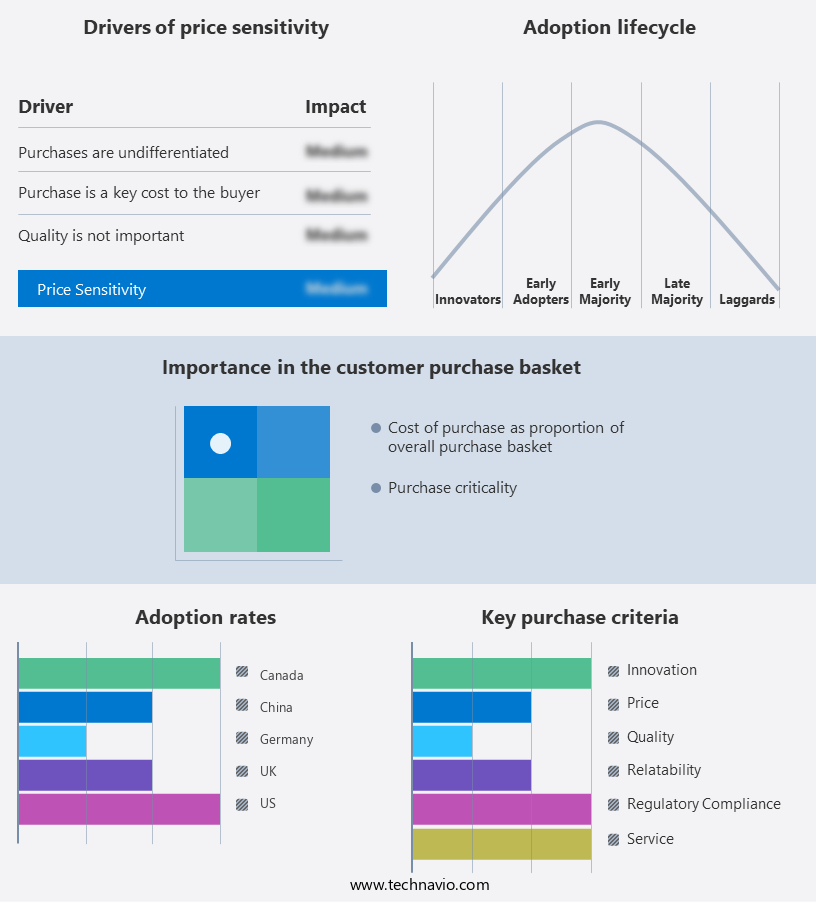
Stadium Lighting Market Share by Geography

 Customer Landscape

Key Companies & Market Insights

Companies are implementing various strategies, such as strategic alliances, stadium lighting market forecast, partnerships, mergers and acquisitions, geographical expansion, and product/service launches, to enhance their presence in the industry.

Acuity Brands Inc. - The company specializes in providing advanced stadium lighting solutions, including High Lumen Flood Size 2, High Lumen Flood Size 1, and Floods ACP1 LED.

The industry research and growth report includes detailed analyses of the competitive landscape of the market and information about key companies, including:

  • Acuity Brands Inc.
  • ams OSRAM AG
  • Bajaj Electricals Ltd.
  • Canara Lighting Industries Pvt. Ltd.
  • Eaton Corp. plc
  • Fagerhult Group AB
  • Glamox AS
  • GS LIGHT
  • Hubbell Inc.
  • KCL Engineering
  • Musco Sports Lighting LLC
  • Nila Inc.
  • Panasonic Holdings Corp.
  • Qualite Sports Lighting LLC
  • SAVANT TECHNOLOGIES LLC.
  • Signify NV
  • SMART Global Holdings Inc.
  • Techline Sports Lighting
  • Wipro Ltd.
  • Zumtobel Group AG

Qualitative and quantitative analysis of companies has been conducted to help clients understand the wider business environment as well as the strengths and weaknesses of key industry players. Data is qualitatively analyzed to categorize companies as pure play, category-focused, industry-focused, and diversified; it is quantitatively analyzed to categorize companies as dominant, leading, strong, tentative, and weak.

Recent Development and News in Stadium Lighting Market

  • In January 2024, Philips Hue, a leading lighting solutions provider, announced the launch of its new line of stadium-grade LED lights, called the Hue ArenaSystem. This innovative product line is designed to deliver superior brightness and energy efficiency for large-scale outdoor applications like sports venues (Philips Hue Press Release, 2024).
  • In March 2024, Osram, a global lighting technology company, entered into a strategic partnership with the National Football League (NFL) to provide energy-efficient LED lighting solutions for select NFL stadiums. This collaboration aimed to reduce energy consumption and enhance the fan experience through improved lighting conditions (Osram Press Release, 2024).
  • In April 2025, Cree, Inc., a leading manufacturer of lighting products, completed the acquisition of LEDVANCE, a global leader in the production and sale of LED lighting solutions. This strategic move expanded Cree's product portfolio and strengthened its presence in the market (Cree, Inc. SEC Filing, 2025).
  • In May 2025, the European Union (EU) announced the approval of new regulations for energy-efficient public lighting, including stadiums. The new regulations set minimum energy efficiency standards and incentivize the adoption of LED lighting technologies, expected to drive market growth in the region (European Commission Press Release, 2025).

Research Analyst Overview

The market demonstrates continuous evolution, with applications spanning various sectors, including sports, entertainment, and public infrastructure. Operational cost analysis, lux level measurements, and lighting compliance codes are essential components of stadium lighting maintenance. LED lighting fixtures, with their superior light distribution patterns and energy efficiency, are increasingly preferred. Lighting design software, environmental impact assessments, and lighting project management are crucial for effective lighting system upgrades.

Lighting efficiency improvements, lighting system monitoring, and lighting safety regulations are ongoing priorities. Outdoor lighting standards, light level calculations, and lighting control systems are integral to ensuring optimal performance. Lighting installation services and sports lighting solutions employ advanced lighting controls, light source selection, and lighting power factor optimization. According to industry reports, The market is expected to grow by over 5% annually, driven by these evolving trends. For instance, a recent stadium retrofit project achieved a 60% energy savings through the implementation of advanced lighting technologies.

Dive into Technavio's robust research methodology, blending expert interviews, extensive data synthesis, and validated models for unparalleled Stadium Lighting Market insights. See full methodology.

Market Scope

Report Coverage

Details

Page number

232

Base year

2024

Historic period

2019-2023

Forecast period

2025-2029

Growth momentum & CAGR

Accelerate at a CAGR of 8.9%

Market growth 2025-2029

USD 346.4 million

Market structure

Fragmented

YoY growth 2024-2025(%)

8.0

Key countries

US, China, Germany, India, Japan, UK, France, Canada, South Korea, and Italy

Competitive landscape

Leading Companies, Market Positioning of Companies, Competitive Strategies, and Industry Risks

Request Free Sample

What are the Key Data Covered in this Stadium Lighting Market Research and Growth Report?

  • CAGR of the Stadium Lighting industry during the forecast period
  • Detailed information on factors that will drive the growth and forecasting between 2025 and 2029
  • Precise estimation of the size of the market and its contribution of the industry in focus to the parent market
  • Accurate predictions about upcoming growth and trends and changes in consumer behaviour
  • Growth of the market across APAC, Europe, North America, Middle East and Africa, and South America
  • Thorough analysis of the market's competitive landscape and detailed information about companies
  • Comprehensive analysis of factors that will challenge the stadium lighting market growth of industry companies

We can help! Our analysts can customize this stadium lighting market research report to meet your requirements.

Get in touch

1 Executive Summary

  • 1.1 Market overview
    • Executive Summary - Chart on Market Overview
    • Executive Summary - Data Table on Market Overview
    • Executive Summary - Chart on Global Market Characteristics
    • Executive Summary - Chart on Market by Geography
    • Executive Summary - Chart on Market Segmentation by Source
    • Executive Summary - Chart on Market Segmentation by Type
    • Executive Summary - Chart on Market Segmentation by Application
    • Executive Summary - Chart on Market Segmentation by Power Output
    • Executive Summary - Chart on Incremental Growth
    • Executive Summary - Data Table on Incremental Growth
    • Executive Summary - Chart on Company Market Positioning

2 Technavio Analysis

  • 2.1 Analysis of price sensitivity, lifecycle, customer purchase basket, adoption rates, and purchase criteria
    • Analysis of price sensitivity, lifecycle, customer purchase basket, adoption rates, and purchase criteria
  • 2.2 Criticality of inputs and Factors of differentiation
    • Overview on criticality of inputs and factors of differentiation
  • 2.3 Factors of disruption
    • Overview on factors of disruption
  • 2.4 Impact of drivers and challenges
    • Impact of drivers and challenges in 2024 and 2029

3 Market Landscape

  • 3.1 Market ecosystem
    • Parent Market
    • Data Table on - Parent Market
  • 3.2 Market characteristics
    • Market characteristics analysis
  • 3.3 Value chain analysis
    • Value chain analysis

4 Market Sizing

  • 4.1 Market definition
    • Offerings of companies included in the market definition
  • 4.2 Market segment analysis
    • Market segments
  • 4.3 Market size 2024
    • 4.4 Market outlook: Forecast for 2024-2029
      • Chart on Global - Market size and forecast 2024-2029 ($ million)
      • Data Table on Global - Market size and forecast 2024-2029 ($ million)
      • Chart on Global Market: Year-over-year growth 2024-2029 (%)
      • Data Table on Global Market: Year-over-year growth 2024-2029 (%)

    5 Historic Market Size

    • 5.1 Global Stadium Lighting Market 2019 - 2023
      • Historic Market Size - Data Table on Global Stadium Lighting Market 2019 - 2023 ($ million)
    • 5.2 Source segment analysis 2019 - 2023
      • Historic Market Size - Source Segment 2019 - 2023 ($ million)
    • 5.3 Type segment analysis 2019 - 2023
      • Historic Market Size - Type Segment 2019 - 2023 ($ million)
    • 5.4 Application segment analysis 2019 - 2023
      • Historic Market Size - Application Segment 2019 - 2023 ($ million)
    • 5.5 Power Output segment analysis 2019 - 2023
      • Historic Market Size - Power Output Segment 2019 - 2023 ($ million)
    • 5.6 Geography segment analysis 2019 - 2023
      • Historic Market Size - Geography Segment 2019 - 2023 ($ million)
    • 5.7 Country segment analysis 2019 - 2023
      • Historic Market Size - Country Segment 2019 - 2023 ($ million)

    6 Qualitative Analysis

    • 6.1 The AI impact on Global Stadium Lighting Market

      7 Five Forces Analysis

      • 7.1 Five forces summary
        • Five forces analysis - Comparison between 2024 and 2029
      • 7.2 Bargaining power of buyers
        • Bargaining power of buyers - Impact of key factors 2024 and 2029
      • 7.3 Bargaining power of suppliers
        • Bargaining power of suppliers - Impact of key factors in 2024 and 2029
      • 7.4 Threat of new entrants
        • Threat of new entrants - Impact of key factors in 2024 and 2029
      • 7.5 Threat of substitutes
        • Threat of substitutes - Impact of key factors in 2024 and 2029
      • 7.6 Threat of rivalry
        • Threat of rivalry - Impact of key factors in 2024 and 2029
      • 7.7 Market condition
        • Chart on Market condition - Five forces 2024 and 2029

      8 Market Segmentation by Source

      • 8.1 Market segments
        • Chart on Source - Market share 2024-2029 (%)
        • Data Table on Source - Market share 2024-2029 (%)
      • 8.2 Comparison by Source
        • Chart on Comparison by Source
        • Data Table on Comparison by Source
      • 8.3 HID - Market size and forecast 2024-2029
        • Chart on HID - Market size and forecast 2024-2029 ($ million)
        • Data Table on HID - Market size and forecast 2024-2029 ($ million)
        • Chart on HID - Year-over-year growth 2024-2029 (%)
        • Data Table on HID - Year-over-year growth 2024-2029 (%)
      • 8.4 LED - Market size and forecast 2024-2029
        • Chart on LED - Market size and forecast 2024-2029 ($ million)
        • Data Table on LED - Market size and forecast 2024-2029 ($ million)
        • Chart on LED - Year-over-year growth 2024-2029 (%)
        • Data Table on LED - Year-over-year growth 2024-2029 (%)
      • 8.5 Others - Market size and forecast 2024-2029
        • Chart on Others - Market size and forecast 2024-2029 ($ million)
        • Data Table on Others - Market size and forecast 2024-2029 ($ million)
        • Chart on Others - Year-over-year growth 2024-2029 (%)
        • Data Table on Others - Year-over-year growth 2024-2029 (%)
      • 8.6 Market opportunity by Source
        • Market opportunity by Source ($ million)
        • Data Table on Market opportunity by Source ($ million)

      9 Market Segmentation by Type

      • 9.1 Market segments
        • Chart on Type - Market share 2024-2029 (%)
        • Data Table on Type - Market share 2024-2029 (%)
      • 9.2 Comparison by Type
        • Chart on Comparison by Type
        • Data Table on Comparison by Type
      • 9.3 Retrofit installation - Market size and forecast 2024-2029
        • Chart on Retrofit installation - Market size and forecast 2024-2029 ($ million)
        • Data Table on Retrofit installation - Market size and forecast 2024-2029 ($ million)
        • Chart on Retrofit installation - Year-over-year growth 2024-2029 (%)
        • Data Table on Retrofit installation - Year-over-year growth 2024-2029 (%)
      • 9.4 New installation - Market size and forecast 2024-2029
        • Chart on New installation - Market size and forecast 2024-2029 ($ million)
        • Data Table on New installation - Market size and forecast 2024-2029 ($ million)
        • Chart on New installation - Year-over-year growth 2024-2029 (%)
        • Data Table on New installation - Year-over-year growth 2024-2029 (%)
      • 9.5 Market opportunity by Type
        • Market opportunity by Type ($ million)
        • Data Table on Market opportunity by Type ($ million)

      10 Market Segmentation by Application

      • 10.1 Market segments
        • Chart on Application - Market share 2024-2029 (%)
        • Data Table on Application - Market share 2024-2029 (%)
      • 10.2 Comparison by Application
        • Chart on Comparison by Application
        • Data Table on Comparison by Application
      • 10.3 Outdoor stadium - Market size and forecast 2024-2029
        • Chart on Outdoor stadium - Market size and forecast 2024-2029 ($ million)
        • Data Table on Outdoor stadium - Market size and forecast 2024-2029 ($ million)
        • Chart on Outdoor stadium - Year-over-year growth 2024-2029 (%)
        • Data Table on Outdoor stadium - Year-over-year growth 2024-2029 (%)
      • 10.4 Indoor stadium - Market size and forecast 2024-2029
        • Chart on Indoor stadium - Market size and forecast 2024-2029 ($ million)
        • Data Table on Indoor stadium - Market size and forecast 2024-2029 ($ million)
        • Chart on Indoor stadium - Year-over-year growth 2024-2029 (%)
        • Data Table on Indoor stadium - Year-over-year growth 2024-2029 (%)
      • 10.5 Market opportunity by Application
        • Market opportunity by Application ($ million)
        • Data Table on Market opportunity by Application ($ million)

      11 Market Segmentation by Power Output

      • 11.1 Market segments
        • Chart on Power Output - Market share 2024-2029 (%)
        • Data Table on Power Output - Market share 2024-2029 (%)
      • 11.2 Comparison by Power Output
        • Chart on Comparison by Power Output
        • Data Table on Comparison by Power Output
      • 500W-1500W - Market size and forecast 2024-2029
        • Chart on 500W-1500W - Market size and forecast 2024-2029 ($ million)
        • Data Table on 500W-1500W - Market size and forecast 2024-2029 ($ million)
        • Chart on 500W-1500W - Year-over-year growth 2024-2029 (%)
        • Data Table on 500W-1500W - Year-over-year growth 2024-2029 (%)
      • 11.4 Above 1500W - Market size and forecast 2024-2029
        • Chart on Above 1500W - Market size and forecast 2024-2029 ($ million)
        • Data Table on Above 1500W - Market size and forecast 2024-2029 ($ million)
        • Chart on Above 1500W - Year-over-year growth 2024-2029 (%)
        • Data Table on Above 1500W - Year-over-year growth 2024-2029 (%)
      • 11.5 Below 500W - Market size and forecast 2024-2029
        • Chart on Below 500W - Market size and forecast 2024-2029 ($ million)
        • Data Table on Below 500W - Market size and forecast 2024-2029 ($ million)
        • Chart on Below 500W - Year-over-year growth 2024-2029 (%)
        • Data Table on Below 500W - Year-over-year growth 2024-2029 (%)
      • 11.6 Market opportunity by Power Output
        • Market opportunity by Power Output ($ million)
        • Data Table on Market opportunity by Power Output ($ million)

      12 Customer Landscape

      • 12.1 Customer landscape overview
        • Analysis of price sensitivity, lifecycle, customer purchase basket, adoption rates, and purchase criteria

      13 Geographic Landscape

      • 13.1 Geographic segmentation
        • Chart on Market share by geography 2024-2029 (%)
        • Data Table on Market share by geography 2024-2029 (%)
      • 13.2 Geographic comparison
        • Chart on Geographic comparison
        • Data Table on Geographic comparison
      • 13.3 APAC - Market size and forecast 2024-2029
        • Chart on APAC - Market size and forecast 2024-2029 ($ million)
        • Data Table on APAC - Market size and forecast 2024-2029 ($ million)
        • Chart on APAC - Year-over-year growth 2024-2029 (%)
        • Data Table on APAC - Year-over-year growth 2024-2029 (%)
      • 13.4 Europe - Market size and forecast 2024-2029
        • Chart on Europe - Market size and forecast 2024-2029 ($ million)
        • Data Table on Europe - Market size and forecast 2024-2029 ($ million)
        • Chart on Europe - Year-over-year growth 2024-2029 (%)
        • Data Table on Europe - Year-over-year growth 2024-2029 (%)
      • 13.5 North America - Market size and forecast 2024-2029
        • Chart on North America - Market size and forecast 2024-2029 ($ million)
        • Data Table on North America - Market size and forecast 2024-2029 ($ million)
        • Chart on North America - Year-over-year growth 2024-2029 (%)
        • Data Table on North America - Year-over-year growth 2024-2029 (%)
      • 13.6 Middle East and Africa - Market size and forecast 2024-2029
        • Chart on Middle East and Africa - Market size and forecast 2024-2029 ($ million)
        • Data Table on Middle East and Africa - Market size and forecast 2024-2029 ($ million)
        • Chart on Middle East and Africa - Year-over-year growth 2024-2029 (%)
        • Data Table on Middle East and Africa - Year-over-year growth 2024-2029 (%)
      • 13.7 South America - Market size and forecast 2024-2029
        • Chart on South America - Market size and forecast 2024-2029 ($ million)
        • Data Table on South America - Market size and forecast 2024-2029 ($ million)
        • Chart on South America - Year-over-year growth 2024-2029 (%)
        • Data Table on South America - Year-over-year growth 2024-2029 (%)
      • 13.8 US - Market size and forecast 2024-2029
        • Chart on US - Market size and forecast 2024-2029 ($ million)
        • Data Table on US - Market size and forecast 2024-2029 ($ million)
        • Chart on US - Year-over-year growth 2024-2029 (%)
        • Data Table on US - Year-over-year growth 2024-2029 (%)
      • 13.9 China - Market size and forecast 2024-2029
        • Chart on China - Market size and forecast 2024-2029 ($ million)
        • Data Table on China - Market size and forecast 2024-2029 ($ million)
        • Chart on China - Year-over-year growth 2024-2029 (%)
        • Data Table on China - Year-over-year growth 2024-2029 (%)
      • 13.10 Germany - Market size and forecast 2024-2029
        • Chart on Germany - Market size and forecast 2024-2029 ($ million)
        • Data Table on Germany - Market size and forecast 2024-2029 ($ million)
        • Chart on Germany - Year-over-year growth 2024-2029 (%)
        • Data Table on Germany - Year-over-year growth 2024-2029 (%)
      • 13.11 India - Market size and forecast 2024-2029
        • Chart on India - Market size and forecast 2024-2029 ($ million)
        • Data Table on India - Market size and forecast 2024-2029 ($ million)
        • Chart on India - Year-over-year growth 2024-2029 (%)
        • Data Table on India - Year-over-year growth 2024-2029 (%)
      • 13.12 Japan - Market size and forecast 2024-2029
        • Chart on Japan - Market size and forecast 2024-2029 ($ million)
        • Data Table on Japan - Market size and forecast 2024-2029 ($ million)
        • Chart on Japan - Year-over-year growth 2024-2029 (%)
        • Data Table on Japan - Year-over-year growth 2024-2029 (%)
      • 13.13 UK - Market size and forecast 2024-2029
        • Chart on UK - Market size and forecast 2024-2029 ($ million)
        • Data Table on UK - Market size and forecast 2024-2029 ($ million)
        • Chart on UK - Year-over-year growth 2024-2029 (%)
        • Data Table on UK - Year-over-year growth 2024-2029 (%)
      • 13.14 France - Market size and forecast 2024-2029
        • Chart on France - Market size and forecast 2024-2029 ($ million)
        • Data Table on France - Market size and forecast 2024-2029 ($ million)
        • Chart on France - Year-over-year growth 2024-2029 (%)
        • Data Table on France - Year-over-year growth 2024-2029 (%)
      • 13.15 Canada - Market size and forecast 2024-2029
        • Chart on Canada - Market size and forecast 2024-2029 ($ million)
        • Data Table on Canada - Market size and forecast 2024-2029 ($ million)
        • Chart on Canada - Year-over-year growth 2024-2029 (%)
        • Data Table on Canada - Year-over-year growth 2024-2029 (%)
      • 13.16 South Korea - Market size and forecast 2024-2029
        • Chart on South Korea - Market size and forecast 2024-2029 ($ million)
        • Data Table on South Korea - Market size and forecast 2024-2029 ($ million)
        • Chart on South Korea - Year-over-year growth 2024-2029 (%)
        • Data Table on South Korea - Year-over-year growth 2024-2029 (%)
      • 13.17 Italy - Market size and forecast 2024-2029
        • Chart on Italy - Market size and forecast 2024-2029 ($ million)
        • Data Table on Italy - Market size and forecast 2024-2029 ($ million)
        • Chart on Italy - Year-over-year growth 2024-2029 (%)
        • Data Table on Italy - Year-over-year growth 2024-2029 (%)
      • 13.18 Market opportunity by geography
        • Market opportunity by geography ($ million)
        • Data Tables on Market opportunity by geography ($ million)

      14 Drivers, Challenges, and Opportunity/Restraints

      • 14.1 Market drivers
        • 14.2 Market challenges
          • 14.3 Impact of drivers and challenges
            • Impact of drivers and challenges in 2024 and 2029
          • 14.4 Market opportunities/restraints

            15 Competitive Landscape

            • 15.1 Overview
              • 15.2 Competitive Landscape
                • Overview on criticality of inputs and factors of differentiation
              • 15.3 Landscape disruption
                • Overview on factors of disruption
              • 15.4 Industry risks
                • Impact of key risks on business

              16 Competitive Analysis

              • 16.1 Companies profiled
                • Companies covered
              • 16.2 Company ranking index
                • Company ranking index
              • 16.3 Market positioning of companies
                • Matrix on companies position and classification
              • 16.4 Acuity Brands Inc.
                • Acuity Brands Inc. - Overview
                • Acuity Brands Inc. - Business segments
                • Acuity Brands Inc. - Key offerings
                • Acuity Brands Inc. - Segment focus
                • SWOT
              • 16.5 ams OSRAM AG
                • ams OSRAM AG - Overview
                • ams OSRAM AG - Business segments
                • ams OSRAM AG - Key news
                • ams OSRAM AG - Key offerings
                • ams OSRAM AG - Segment focus
                • SWOT
              • 16.6 Bajaj Electricals Ltd.
                • Bajaj Electricals Ltd. - Overview
                • Bajaj Electricals Ltd. - Business segments
                • Bajaj Electricals Ltd. - Key offerings
                • Bajaj Electricals Ltd. - Segment focus
                • SWOT
              • 16.7 Canara Lighting Industries Pvt. Ltd.
                • Canara Lighting Industries Pvt. Ltd. - Overview
                • Canara Lighting Industries Pvt. Ltd. - Product / Service
                • Canara Lighting Industries Pvt. Ltd. - Key offerings
                • SWOT
              • 16.8 Eaton Corp. plc
                • Eaton Corp. plc - Overview
                • Eaton Corp. plc - Business segments
                • Eaton Corp. plc - Key news
                • Eaton Corp. plc - Key offerings
                • Eaton Corp. plc - Segment focus
                • SWOT
              • 16.9 Fagerhult Group AB
                • Fagerhult Group AB - Overview
                • Fagerhult Group AB - Product / Service
                • Fagerhult Group AB - Key offerings
                • SWOT
              • 16.10 GS LIGHT
                • GS LIGHT  - Overview
                • GS LIGHT  - Product / Service
                • GS LIGHT  - Key offerings
                • SWOT
              • 16.11 Hubbell Inc.
                • Hubbell Inc. - Overview
                • Hubbell Inc. - Business segments
                • Hubbell Inc. - Key news
                • Hubbell Inc. - Key offerings
                • Hubbell Inc. - Segment focus
                • SWOT
              • 16.12 Musco Sports Lighting LLC
                • Musco Sports Lighting LLC - Overview
                • Musco Sports Lighting LLC - Product / Service
                • Musco Sports Lighting LLC - Key offerings
                • SWOT
              • 16.13 Nila Inc.
                • Nila Inc. - Overview
                • Nila Inc. - Product / Service
                • Nila Inc. - Key offerings
                • SWOT
              • 16.14 Panasonic Holdings Corp.
                • Panasonic Holdings Corp. - Overview
                • Panasonic Holdings Corp. - Business segments
                • Panasonic Holdings Corp. - Key news
                • Panasonic Holdings Corp. - Key offerings
                • Panasonic Holdings Corp. - Segment focus
                • SWOT
              • 16.15 SAVANT TECHNOLOGIES LLC.
                • SAVANT TECHNOLOGIES LLC. - Overview
                • SAVANT TECHNOLOGIES LLC. - Product / Service
                • SAVANT TECHNOLOGIES LLC. - Key offerings
                • SWOT
              • 16.16 Signify NV
                • Signify NV - Overview
                • Signify NV - Business segments
                • Signify NV - Key news
                • Signify NV - Key offerings
                • Signify NV - Segment focus
                • SWOT
              • 16.17 Wipro Ltd.
                • Wipro Ltd. - Overview
                • Wipro Ltd. - Business segments
                • Wipro Ltd. - Key news
                • Wipro Ltd. - Key offerings
                • Wipro Ltd. - Segment focus
                • SWOT
              • 16.18 Zumtobel Group AG
                • Zumtobel Group AG - Overview
                • Zumtobel Group AG - Business segments
                • Zumtobel Group AG - Key offerings
                • Zumtobel Group AG - Segment focus
                • SWOT

              17 Appendix

              • 17.1 Scope of the report
                • 17.2 Inclusions and exclusions checklist
                  • Inclusions checklist
                  • Exclusions checklist
                • 17.3 Currency conversion rates for US$
                  • Currency conversion rates for US$
                • 17.4 Research methodology
                  • Research methodology
                • 17.5 Data procurement
                  • Information sources
                • 17.6 Data validation
                  • Data validation
                • 17.7 Validation techniques employed for market sizing
                  • Validation techniques employed for market sizing
                • 17.8 Data synthesis
                  • Data synthesis
                • 17.9 360 degree market analysis
                  • 360 degree market analysis
                • 17.10 List of abbreviations
                  • List of abbreviations

                Research Methodology

                Technavio presents a detailed picture of the market by way of study, synthesis, and summation of data from multiple sources. The analysts have presented the various facets of the market with a particular focus on identifying the key industry influencers. The data thus presented is comprehensive, reliable, and the result of extensive research, both primary and secondary.

                INFORMATION SOURCES

                Primary sources

                • Manufacturers and suppliers
                • Channel partners
                • Industry experts
                • Strategic decision makers

                Secondary sources

                • Industry journals and periodicals
                • Government data
                • Financial reports of key industry players
                • Historical data
                • Press releases

                DATA ANALYSIS

                Data Synthesis

                • Collation of data
                • Estimation of key figures
                • Analysis of derived insights

                Data Validation

                • Triangulation with data models
                • Reference against proprietary databases
                • Corroboration with industry experts

                REPORT WRITING

                Qualitative

                • Market drivers
                • Market challenges
                • Market trends
                • Five forces analysis

                Quantitative

                • Market size and forecast
                • Market segmentation
                • Geographical insights
                • Competitive landscape

                Interested in this report?

                Get your sample now to see our research methodology and insights!

                Download Now

                Frequently Asked Questions

                Stadium Lighting market growth will increase by $ 346.4 mn during 2025-2029.

                The Stadium Lighting market is expected to grow at a CAGR of 8.9% during 2025-2029.

                Stadium Lighting market is segmented by Source( HID, LED, Others) Type( Retrofit installation, New installation, North America, Middle East and Africa, South America) Application( Outdoor stadium, Indoor stadium, North America, Middle East and Africa, South America)

                Acuity Brands Inc., ams OSRAM AG, Bajaj Electricals Ltd., Canara Lighting Industries Pvt. Ltd., Eaton Corp. plc, Fagerhult Group AB, Glamox AS, GS LIGHT, Hubbell Inc., KCL Engineering, Musco Sports Lighting LLC, Nila Inc., Panasonic Holdings Corp., Qualite Sports Lighting LLC, SAVANT TECHNOLOGIES LLC., Signify NV, SMART Global Holdings Inc., Techline Sports Lighting, Wipro Ltd., Zumtobel Group AG are a few of the key vendors in the Stadium Lighting market.

                APAC will register the highest growth rate of 38% among the other regions. Therefore, the Stadium Lighting market in APAC is expected to garner significant business opportunities for the vendors during the forecast period.

                US, China, Germany, India, Japan, UK, France, Canada, South Korea, Italy

                • Growth in sports events globallyDeveloped economies in North America and Europe have played a pivotal role in shaping the global sports industry is the driving factor this market.
                • with elite leagues such as the Premier League and NFL captivating massive international audiences is the driving factor this market.
                • including fans from emerging markets like India. This transnational appeal has spurred the creation of domestic leagues such as the Indian Super League is the driving factor this market.
                • reflecting a growing appetite for professional sports at home. As fan bases expanded across borders is the driving factor this market.
                • governments and sports organizations worldwide became increasingly proactive in hosting international tournaments to boost tourism is the driving factor this market.
                • national pride is the driving factor this market.
                • and economic activity. Recent major events like the Paris 2024 Summer Olympics is the driving factor this market.
                • UEFA Euro 2024 in Germany is the driving factor this market.
                • Copa America 2024 in Ecuador is the driving factor this market.
                • and the ICC Cricket World Cup 2025 in India have drawn millions of viewers and attendees is the driving factor this market.
                • showcasing the global reach of sports. The upcoming Rugby World Cup 2025 in Australia further underscores this trend. This surge in international sporting events has significantly driven demand for advanced infrastructure is the driving factor this market.
                • particularly in stadium lighting is the driving factor this market.
                • which is crucial for broadcasting is the driving factor this market.
                • safety is the driving factor this market.
                • and enhancing the spectator experience. As a result is the driving factor this market.
                • the global stadium lighting market has witnessed substantial growth during the forecast period is the driving factor this market.
                • fueled by technological innovation is the driving factor this market.
                • sustainability goals is the driving factor this market.
                • and the increasing frequency of high-profile tournaments across continents. is the driving factor this market.

                The Stadium Lighting market vendors should focus on grabbing business opportunities from the HID segment as it accounted for the largest market share in the base year.