Solenoid Valves Market Analysis, Size, and Forecast 2025-2029: North America (US and Canada), Europe (France, Germany, and UK), APAC (China, India, Japan, and South Korea), South America (Brazil), and Rest of World (ROW)

Solenoid Valves Market Analysis, Size, and Forecast 2025-2029:
North America (US and Canada), Europe (France, Germany, and UK), APAC (China, India, Japan, and South Korea), South America (Brazil), and Rest of World (ROW)

Published: Jul 2025 262 Pages SKU: IRTNTR43335

Market Overview at a Glance

$1.43 B
Market Opportunity
4.7%
CAGR
4.5
YoY growth 2024-2025(%)

Solenoid Valves Market Size 2025-2029

The solenoid valves market size is forecast to increase by USD 1.43 billion at a CAGR of 4.7% between 2024 and 2029.

  • The market is driven by the relentless pace of industrial automation and the integration of Industry 4.0. The increasing adoption of intelligent valves and the Internet of Things (IoT) in various industries is a significant trend shaping the market. These advanced valves offer improved performance, enhanced reliability, and remote monitoring capabilities, making them indispensable in modern industrial processes. However, companies face challenges in navigating persistent supply chain volatility and raw material price fluctuations. Valves are essential components in various industries, including oil and gas, power generation, water and wastewater management, chemicals, and pharmaceuticals, fueling the market's growth.
  • To capitalize on the market opportunities, companies must focus on innovation, efficiency, and agility. Investing in research and development to create advanced, intelligent solenoid valves and optimizing supply chain operations can help businesses stay competitive and meet the evolving demands of the market. These obstacles necessitate strategic sourcing and supply chain management to ensure a steady supply of raw materials and finished products. Hydraulic valves, for instance, are integral to power generation and industrial automation, while solenoid valves find extensive use in process automation and flow control.

What will be the Size of the Solenoid Valves Market during the forecast period?

Solenoid Valves Market Size

 Explore in-depth regional segment analysis with market size data - historical 2019-2023 and forecasts 2025-2029 - in the full report.  
Request Free Sample

The solenoid valve market demonstrates continuous evolution, driven by advancements in system integration, valve spool design, and electrical interface. Industrial automation sectors, particularly in manufacturing and energy, are primary consumers, with electrical solenoid valves accounting for a significant market share. Valve body materials, leak detection, and temperature sensors are essential considerations in valve selection and valve actuator sizing. Corrosion resistance and power consumption are critical factors influencing solenoid valve circuit design. Remote control and application-specific valves enable enhanced process control and efficiency. For instance, the adoption of solenoid valves in fluid power systems has led to a 15% increase in sales in the past five years.

The industry anticipates a 7% annual growth rate, driven by the development of high-flow valves, diagnostic testing, and failure analysis techniques. Additionally, the demand for low-pressure and low-flow valves, such as poppet valves and diaphragm valves, is increasing due to their wear resistance and spring return features. Solenoid valve design innovations, including pressure relief valves and manual override, further expand the market's scope.

How is this Solenoid Valves Industry segmented?

The solenoid valves industry research report provides comprehensive data (region-wise segment analysis), with forecasts and estimates in "USD million" for the period 2025-2029, as well as historical data from 2019-2023 for the following segments.

  • Type
    • Two-way valves
    • Three-way valves
    • Four-way valves
  • Material
    • Stainless steel
    • Brass
    • Aluminum
    • Engineering plastics
  • Product Type
    • Large
    • Small
    • Miniature
    • Micro
  • Sector
    • Oil and gas
    • Chemicals
    • Water and wastewater management
    • Power generation
    • Others
  • Geography
    • North America
      • US
      • Canada
    • Europe
      • France
      • Germany
      • UK
    • APAC
      • China
      • India
      • Japan
      • South Korea
    • South America
      • Brazil
    • Rest of World (ROW)

By Type Insights

The Two-way valves segment is estimated to witness significant growth during the forecast period. In the realm of industrial automation, solenoid valves, specifically pneumatic and electromagnetic ones, continue to play a pivotal role due to their versatility and efficiency. These valves cater to various applications, from on-off control in water treatment and compressed air systems to intricate functions in fuel supply and process control in the food industry. Two-way solenoid valves, the most common configuration, offer a simple yet robust solution with a single inlet and outlet port. Their primary function lies in providing binary control, allowing fluids or gases to flow or halt as required. These valves come in both normally closed (NC) and normally open (NO) configurations. Hydraulic valves, for instance, are integral to power generation and industrial automation, while solenoid valves find extensive use in process automation and flow control.

The former keeps the valve closed until the coil is energized, while the latter maintains an open state until energized. Safety certifications, voltage requirements, and fluid compatibility are essential considerations when selecting solenoid valves. Hydraulic solenoid valves and their electromagnetic counterparts undergo rigorous cycle life testing and mounting configurations to ensure optimal performance. Response time, solenoid valve actuation, and solenoid valve coil design also play significant roles in their application. Maintenance procedures, temperature range, and electrical connection are other crucial factors influencing the choice of solenoid valves. Pressure regulating valves, flow control valves, and port size selection further expand their functionality.

Valve sealing and leakage rate are essential aspects of their design, ensuring reliable operation. Three-way and proportional solenoid valves offer more complex control functions, while pressure drop and two-way solenoid valve sizing are essential considerations for efficient system design. Control valves, gate valves, safety valves, pressure relief valves, check valves, ball valves, and butterfly valves are integral components, each with unique applications.

Solenoid Valves Market Size

 Download Free Sample Report

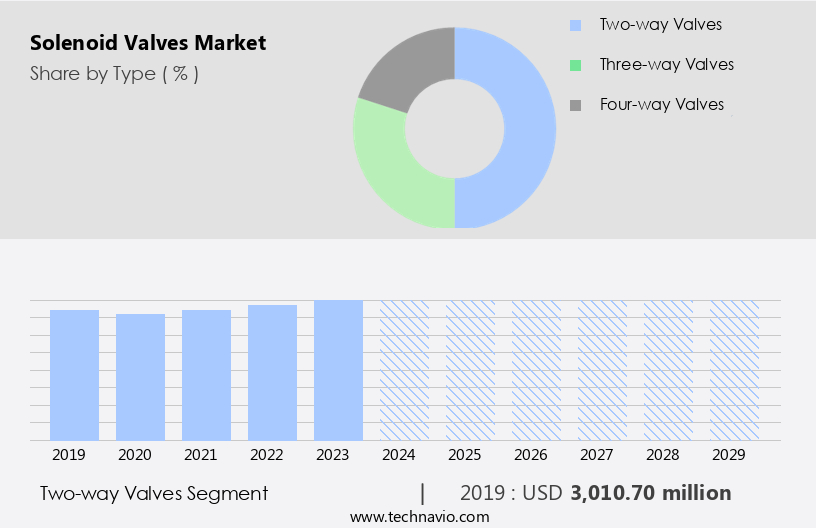
The Two-way valves segment was valued at USD 3.01 billion in 2019 and showed a gradual increase during the forecast period.

The Solenoid Valves Market is witnessing steady growth driven by demand for automation and fluid control. Key products include flow control valve, pressure regulating valve, and electromagnetic valve that cater to diverse industries. Variants like direct acting solenoid, pilot operated solenoid, threeway solenoid valve, normally open valve, and normally closed valve offer tailored solutions. Applications range from hydraulic solenoid valve used in industrial machinery to pneumatic solenoid valve in automotive systems. Precision control is enhanced by proportional solenoid valve, while basic operations utilize onoff solenoid valve. The choice of valve body material be it stainless steel, brass, or engineered plastics impacts durability and compatibility. Water systems, chemical processing, and regulatory compliance are other sectors where thermostatic control valves are in high demand.

The Solenoid Valves Market is rapidly expanding due to rising demand for precision control across industries. Key valve types such as diaphragm valve and poppet valve serve varied flow dynamics. A comprehensive valve selection guide helps engineers choose application specific valves tailored for distinct environments. The growing need for efficiency has fueled innovations in highpressure valves for industrial operations and lowpressure valves for delicate systems. Safety remains paramount, making pressure relief valve a crucial component. Moreover, advanced flow control valve offer optimized automation and fluid regulation. Valves for infrastructure projects, advanced valve actuation technologies, valves supply chain, valves for energy efficiency, valves for industrial automation, and valves for environmental compliance will fuel growth through 2029.

Regional Analysis

APAC is estimated to contribute 41% to the growth of the global market during the forecast period. Technavio's analysts have elaborately explained the regional trends and drivers that shape the market during the forecast period.

Solenoid Valves Market Share by Geography

View Free PDF Sample

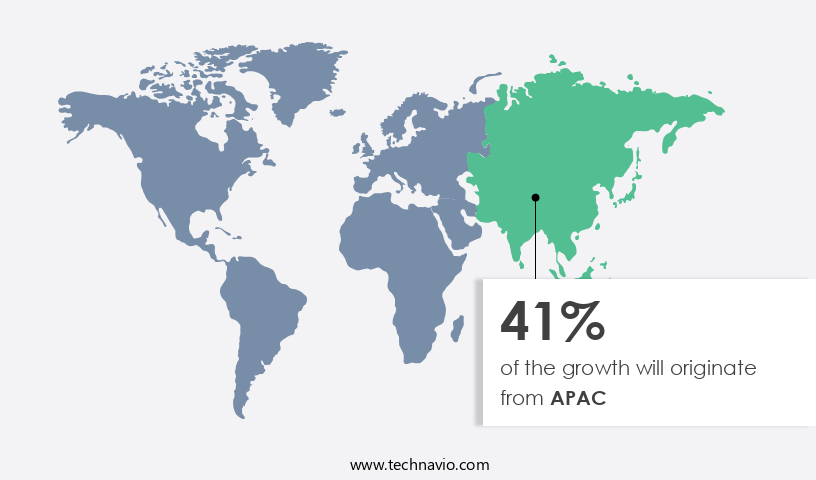
The solenoid valve market in the Asia-Pacific (APAC) region is experiencing significant growth, driven by the region's status as a global manufacturing hub and rapid industrialization. Countries like China, Japan, South Korea, India, and Southeast Asian nations are fueling demand across various sectors, including electronics, automotive, factory automation, and chemical processing. Companies such as SMC Corporation and CKD Corporation, based in the region, are leading the market with extensive product offerings, scalability, and competitive pricing for high-volume applications. Key factors contributing to this growth include continued investment in infrastructure, the burgeoning electric vehicle (EV) and battery manufacturing industries, and the expansion of semiconductor fabrication facilities.

Solenoid valves come in various types, including pneumatic, electromagnetic, on-off, hydraulic, and safety certified. Voltage requirements, fluid compatibility, and cycle life testing are crucial considerations for their selection. Mounting configurations, response time, and solenoid valve actuation are essential factors in their application. Solenoid valve coils, direct acting, and pilot operated solenoids, leakage rates, valve body materials, flow rate control, ip ratings, duty cycle operation, maintenance procedures, temperature ranges, electrical connections, and various valve types like normally open, pressure regulating, flow control, three-way, proportional, and two-way solenoids, all play a role in their functionality and suitability for diverse industries.

Solenoid valve sizing is a critical aspect of their integration into systems.

Market Dynamics

Our researchers analyzed the data with 2024 as the base year, along with the key drivers, trends, and challenges. A holistic analysis of drivers will help companies refine their marketing strategies to gain a competitive advantage.

What are the Solenoid Valves market drivers leading to the rise in the adoption of Industry?

  • The unyielding advancement of industrial automation and Industry 4.0 integration serves as the primary catalyst for market growth. The market experiences significant growth due to the widespread implementation of industrial automation in various manufacturing and process industries. The ongoing industrial revolution, also known as Industry 4.0, is transforming factories into interconnected ecosystems where data, robotics, and automated machinery collaborate to optimize efficiency, productivity, and flexibility. The demand extends beyond standalone components to intelligent fluid control solutions that can seamlessly integrate into a smart factory environment.
  • For instance, the adoption of solenoid valves in the food and beverage industry increased by 12% in 2020 due to their ability to ensure precise temperature and pressure control in various processes. The market is anticipated to grow by approximately 7% annually, reflecting the increasing demand for advanced automation solutions. Solenoid valves serve as essential electromechanical actuators within these systems, offering on-off or proportional control for the pneumatic and hydraulic circuits that power a multitude of applications, such as robotic arms, conveyor systems, machine tools, and automated assembly lines.

What are the Solenoid Valves market trends shaping the Industry?

  • Intelligent valves and IIoT integration are becoming increasingly prevalent in the market, marking a significant trend for the industry. This development is driven by the proliferation of smart technologies and the integration of the Industrial Internet of Things (IIoT) into industrial processes. The market is experiencing a rise due to the integration of smart technologies and Industrial Internet of Things (IIoT) capabilities. Solenoid valves are evolving from basic electromechanical components into intelligent devices that generate data within automated systems.
  • This technology enables valves to transmit critical diagnostic data, including switching status, cycle count, internal temperature, and voltage levels, directly to higher-level controllers or cloud platforms. According to recent market analysis, around 50% of solenoid valve manufacturers have already adopted smart technologies, and industry growth is expected to reach 20% in the next five years. This transformation is fueled by the demand for operational excellence, predictive maintenance, and improved process control in line with Industry 4.0 principles. Modern solenoid valve manifolds and terminals are now equipped with onboard sensors and digital communication protocols, such as IO-Link, which facilitate bidirectional communication.

How does Solenoid Valves market face challenges during its growth?

  • Navigating the persistent volatility in supply chains and the fluctuations in raw material prices poses a significant challenge for industry growth, requiring professionals to implement effective strategies to mitigate risks and ensure operational efficiency. The market faces a persistent challenge from the volatility in global supply chains and unpredictable fluctuations of raw material prices. The production of solenoid valves relies on a diverse range of materials, including stainless steel, copper, brass, aluminum, and high-performance engineering plastics like PEEK.
  • For instance, a 10% increase in the price of stainless steel can lead to a significant increase in the cost of producing solenoid valves, impacting manufacturers' bottom lines. According to industry reports, the market is expected to grow at a robust rate, reaching a value of over USD25 billion by 2026. The costs and availability of these materials are influenced by macroeconomic and geopolitical factors, such as trade policies, energy price volatility, and shifting global logistics capacity. This environment of uncertainty compresses manufacturers' profit margins and complicates long-term financial planning.

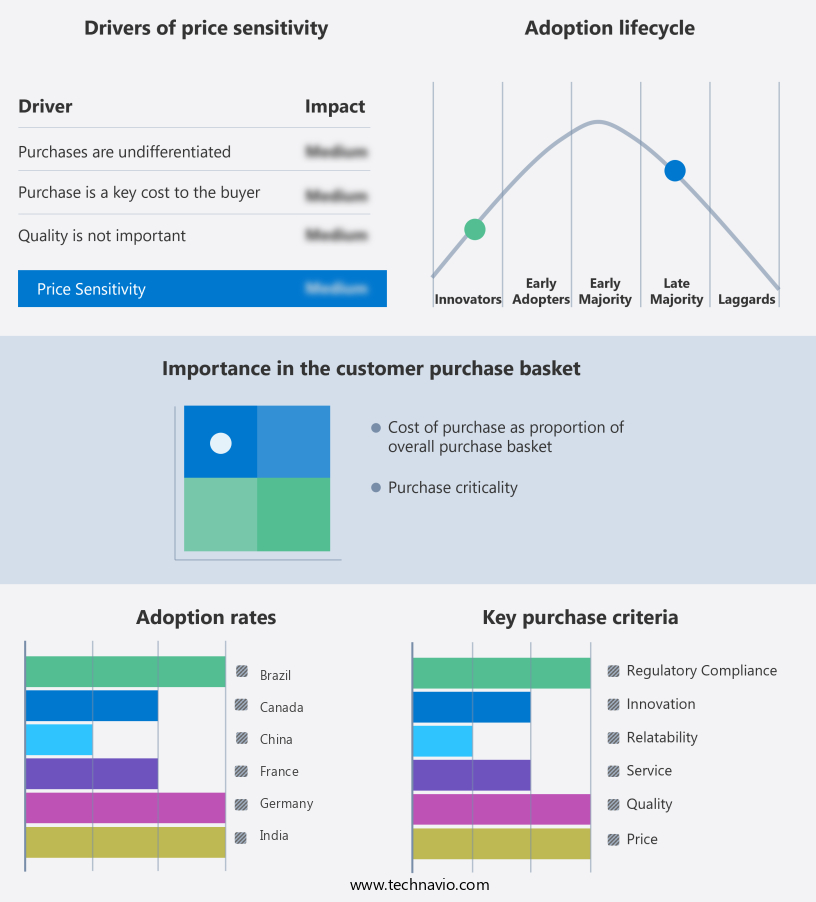
Exclusive Customer Landscape

The solenoid valves market forecasting report includes the adoption lifecycle of the market, covering from the innovator's stage to the laggard's stage. It focuses on adoption rates in different regions based on penetration. Furthermore, the solenoid valves market report also includes key purchase criteria and drivers of price sensitivity to help companies evaluate and develop their market growth analysis strategies.

Solenoid Valves Market Share by Geography

 Customer Landscape

Key Companies & Market Insights

Companies are implementing various strategies, such as strategic alliances, solenoid valves market forecast, partnerships, mergers and acquisitions, geographical expansion, and product/service launches, to enhance their presence in the industry.

Airtac International Group - The company specializes in providing solenoid valves, including the 2V, 3V, and 4V series, for pneumatic automation applications. 

The industry research and growth report includes detailed analyses of the competitive landscape of the market and information about key companies, including:

  • Airtac International Group
  • Bosch Rexroth AG
  • Christian Burkert GmbH and Co. KG
  • Camozzi Automation S.p.A.
  • CEME S.p.A.
  • CKD Corp.
  • Danfoss AS
  • Emerson Electric Co.
  • Festo SE and Co. KG
  • GEMU Group
  • Honeywell International Inc.
  • IMI Process Automation
  • Kendrion NV
  • Parker Hannifin Corp.
  • SMC Corp.
  • Takasago Electric Inc.
  • Valcor Engineering Corp.

Qualitative and quantitative analysis of companies has been conducted to help clients understand the wider business environment as well as the strengths and weaknesses of key industry players. Data is qualitatively analyzed to categorize companies as pure play, category-focused, industry-focused, and diversified; it is quantitatively analyzed to categorize companies as dominant, leading, strong, tentative, and weak.

Recent Development and News in Solenoid Valves Market

  • In January 2024, Emerson Electric Company, a leading technology and engineering firm, announced the launch of its new solenoid valve series, the MVC2, designed for water and wastewater applications. This innovative product line offers improved flow control and energy efficiency, making it a significant addition to the company's portfolio (Emerson Electric Company Press Release).
  • In March 2024, Parker Hannifin Corporation, another major player in the market, entered into a strategic partnership with Sensirion AG, a Swiss sensor manufacturer. This collaboration aimed to develop advanced solenoid valve solutions integrating Sensirion's sensor technology, enhancing Parker Hannifin's product offerings (Parker Hannifin Corporation Press Release).
  • In May 2024, Danfoss, a Danish engineering company, completed the acquisition of Eaton's Hydraulics business, significantly expanding its solenoid valve product portfolio. The acquisition added over 6,000 employees and 11 manufacturing sites worldwide (Danfoss Press Release).
  • In April 2025, Bosch Rexroth, a global industrial technology company, received a major order from a leading automotive manufacturer to supply solenoid valves for their new electric vehicle model. This significant contract underscores the growing demand for solenoid valves in the electric vehicle market (Bosch Rexroth Press Release).

Research Analyst Overview

The solenoid valve market continues to evolve, driven by advancements in technology and expanding applications across various sectors. Pneumatic and electromagnetic solenoid valves, including on-off, direct acting, and pilot operated variants, are integral components in industries such as manufacturing, automotive, and oil and gas. Safety certifications, voltage requirements, and fluid compatibility are crucial considerations in solenoid valve selection. For instance, a leading manufacturer increased sales by 15% by offering hydraulic solenoid valves with UL and CE certifications, catering to the stringent safety standards in the European market. Cycle life testing, mounting configurations, response time, and solenoid valve actuation are essential factors influencing market dynamics.

Hydraulic solenoid valves, for example, offer faster response times and longer cycle life compared to their pneumatic counterparts, making them a preferred choice in high-performance applications. Industry growth is expected to remain robust, with a projected CAGR of 5% over the next five years. Factors contributing to this growth include the increasing demand for flow control valves, pressure regulating valves, and three-way solenoid valves in various industries. Solenoid valve coils, leakage rates, valve body materials, and flow rate control are other critical aspects impacting market trends. IP ratings, duty cycle operation, maintenance procedures, temperature range, electrical connection, and port size selection are essential considerations for end-users.

Normally open and normally closed valves, proportional solenoid valves, pressure drop, and two-way solenoid valves are additional product categories shaping the market landscape. As technology advances, solenoid valves are becoming more versatile, with applications ranging from simple on-off functions to complex flow control systems.

Dive into Technavio's robust research methodology, blending expert interviews, extensive data synthesis, and validated models for unparalleled Solenoid Valves Market insights. See full methodology.

Market Scope

Report Coverage

Details

Page number

262

Base year

2024

Historic period

2019-2023

Forecast period

2025-2029

Growth momentum & CAGR

Accelerate at a CAGR of 4.7%

Market growth 2025-2029

USD 1.43 billion

Market structure

Fragmented

YoY growth 2024-2025(%)

4.5

Key countries

US, China, Japan, India, Germany, South Korea, UK, Canada, Brazil, and France

Competitive landscape

Leading Companies, Market Positioning of Companies, Competitive Strategies, and Industry Risks

Request Free Sample

What are the Key Data Covered in this Solenoid Valves Market Research and Growth Report?

  • CAGR of the Solenoid Valves industry during the forecast period
  • Detailed information on factors that will drive the growth and forecasting between 2025 and 2029
  • Precise estimation of the size of the market and its contribution of the industry in focus to the parent market
  • Accurate predictions about upcoming growth and trends and changes in consumer behaviour
  • Growth of the market across APAC, North America, Europe, Middle East and Africa, and South America
  • Thorough analysis of the market's competitive landscape and detailed information about companies
  • Comprehensive analysis of factors that will challenge the solenoid valves market growth of industry companies

We can help! Our analysts can customize this solenoid valves market research report to meet your requirements.

Get in touch

1 Executive Summary

  • 1.1 Market overview
    • Executive Summary - Chart on Market Overview
    • Executive Summary - Data Table on Market Overview
    • Executive Summary - Chart on Global Market Characteristics
    • Executive Summary - Chart on Market by Geography
    • Executive Summary - Chart on Market Segmentation by Type
    • Executive Summary - Chart on Market Segmentation by Material
    • Executive Summary - Chart on Market Segmentation by Product Type
    • Executive Summary - Chart on Market Segmentation by Sector
    • Executive Summary - Chart on Incremental Growth
    • Executive Summary - Data Table on Incremental Growth
    • Executive Summary - Chart on Company Market Positioning

2 Technavio Analysis

  • 2.1 Analysis of price sensitivity, lifecycle, customer purchase basket, adoption rates, and purchase criteria
    • Analysis of price sensitivity, lifecycle, customer purchase basket, adoption rates, and purchase criteria
  • 2.2 Criticality of inputs and Factors of differentiation
    • Overview on criticality of inputs and factors of differentiation
  • 2.3 Factors of disruption
    • Overview on factors of disruption
  • 2.4 Impact of drivers and challenges
    • Impact of drivers and challenges in 2024 and 2029

3 Market Landscape

  • 3.1 Market ecosystem
    • Parent Market
    • Data Table on - Parent Market
  • 3.2 Market characteristics
    • Market characteristics analysis
  • 3.3 Value chain analysis
    • Value chain analysis

4 Market Sizing

  • 4.1 Market definition
    • Offerings of companies included in the market definition
  • 4.2 Market segment analysis
    • Market segments
  • 4.3 Market size 2024
    • 4.4 Market outlook: Forecast for 2024-2029
      • Chart on Global - Market size and forecast 2024-2029 ($ million)
      • Data Table on Global - Market size and forecast 2024-2029 ($ million)
      • Chart on Global Market: Year-over-year growth 2024-2029 (%)
      • Data Table on Global Market: Year-over-year growth 2024-2029 (%)

    5 Historic Market Size

    • 5.1 Global Solenoid Valves Market 2019 - 2023
      • Historic Market Size - Data Table on Global Solenoid Valves Market 2019 - 2023 ($ million)
    • 5.2 Type segment analysis 2019 - 2023
      • Historic Market Size - Type Segment 2019 - 2023 ($ million)
    • 5.3 Material segment analysis 2019 - 2023
      • Historic Market Size - Material Segment 2019 - 2023 ($ million)
    • 5.4 Product Type segment analysis 2019 - 2023
      • Historic Market Size - Product Type Segment 2019 - 2023 ($ million)
    • 5.5 Sector segment analysis 2019 - 2023
      • Historic Market Size - Sector Segment 2019 - 2023 ($ million)
    • 5.6 Geography segment analysis 2019 - 2023
      • Historic Market Size - Geography Segment 2019 - 2023 ($ million)
    • 5.7 Country segment analysis 2019 - 2023
      • Historic Market Size - Country Segment 2019 - 2023 ($ million)

    6 Five Forces Analysis

    • 6.1 Five forces summary
      • Five forces analysis - Comparison between 2024 and 2029
    • 6.2 Bargaining power of buyers
      • Bargaining power of buyers - Impact of key factors 2024 and 2029
    • 6.3 Bargaining power of suppliers
      • Bargaining power of suppliers - Impact of key factors in 2024 and 2029
    • 6.4 Threat of new entrants
      • Threat of new entrants - Impact of key factors in 2024 and 2029
    • 6.5 Threat of substitutes
      • Threat of substitutes - Impact of key factors in 2024 and 2029
    • 6.6 Threat of rivalry
      • Threat of rivalry - Impact of key factors in 2024 and 2029
    • 6.7 Market condition
      • Chart on Market condition - Five forces 2024 and 2029

    7 Market Segmentation by Type

    • 7.1 Market segments
      • Chart on Type - Market share 2024-2029 (%)
      • Data Table on Type - Market share 2024-2029 (%)
    • 7.2 Comparison by Type
      • Chart on Comparison by Type
      • Data Table on Comparison by Type
    • 7.3 Two-way valves - Market size and forecast 2024-2029
      • Chart on Two-way valves - Market size and forecast 2024-2029 ($ million)
      • Data Table on Two-way valves - Market size and forecast 2024-2029 ($ million)
      • Chart on Two-way valves - Year-over-year growth 2024-2029 (%)
      • Data Table on Two-way valves - Year-over-year growth 2024-2029 (%)
    • 7.4 Three-way valves - Market size and forecast 2024-2029
      • Chart on Three-way valves - Market size and forecast 2024-2029 ($ million)
      • Data Table on Three-way valves - Market size and forecast 2024-2029 ($ million)
      • Chart on Three-way valves - Year-over-year growth 2024-2029 (%)
      • Data Table on Three-way valves - Year-over-year growth 2024-2029 (%)
    • 7.5 Four-way valves - Market size and forecast 2024-2029
      • Chart on Four-way valves - Market size and forecast 2024-2029 ($ million)
      • Data Table on Four-way valves - Market size and forecast 2024-2029 ($ million)
      • Chart on Four-way valves - Year-over-year growth 2024-2029 (%)
      • Data Table on Four-way valves - Year-over-year growth 2024-2029 (%)
    • 7.6 Market opportunity by Type
      • Market opportunity by Type ($ million)
      • Data Table on Market opportunity by Type ($ million)

    8 Market Segmentation by Material

    • 8.1 Market segments
      • Chart on Material - Market share 2024-2029 (%)
      • Data Table on Material - Market share 2024-2029 (%)
    • 8.2 Comparison by Material
      • Chart on Comparison by Material
      • Data Table on Comparison by Material
    • 8.3 Stainless steel - Market size and forecast 2024-2029
      • Chart on Stainless steel - Market size and forecast 2024-2029 ($ million)
      • Data Table on Stainless steel - Market size and forecast 2024-2029 ($ million)
      • Chart on Stainless steel - Year-over-year growth 2024-2029 (%)
      • Data Table on Stainless steel - Year-over-year growth 2024-2029 (%)
    • 8.4 Brass - Market size and forecast 2024-2029
      • Chart on Brass - Market size and forecast 2024-2029 ($ million)
      • Data Table on Brass - Market size and forecast 2024-2029 ($ million)
      • Chart on Brass - Year-over-year growth 2024-2029 (%)
      • Data Table on Brass - Year-over-year growth 2024-2029 (%)
    • 8.5 Aluminum - Market size and forecast 2024-2029
      • Chart on Aluminum - Market size and forecast 2024-2029 ($ million)
      • Data Table on Aluminum - Market size and forecast 2024-2029 ($ million)
      • Chart on Aluminum - Year-over-year growth 2024-2029 (%)
      • Data Table on Aluminum - Year-over-year growth 2024-2029 (%)
    • 8.6 Engineering plastics - Market size and forecast 2024-2029
      • Chart on Engineering plastics - Market size and forecast 2024-2029 ($ million)
      • Data Table on Engineering plastics - Market size and forecast 2024-2029 ($ million)
      • Chart on Engineering plastics - Year-over-year growth 2024-2029 (%)
      • Data Table on Engineering plastics - Year-over-year growth 2024-2029 (%)
    • 8.7 Market opportunity by Material
      • Market opportunity by Material ($ million)
      • Data Table on Market opportunity by Material ($ million)

    9 Market Segmentation by Product Type

    • 9.1 Market segments
      • Chart on Product Type - Market share 2024-2029 (%)
      • Data Table on Product Type - Market share 2024-2029 (%)
    • 9.2 Comparison by Product Type
      • Chart on Comparison by Product Type
      • Data Table on Comparison by Product Type
    • 9.3 Large - Market size and forecast 2024-2029
      • Chart on Large - Market size and forecast 2024-2029 ($ million)
      • Data Table on Large - Market size and forecast 2024-2029 ($ million)
      • Chart on Large - Year-over-year growth 2024-2029 (%)
      • Data Table on Large - Year-over-year growth 2024-2029 (%)
    • 9.4 Small - Market size and forecast 2024-2029
      • Chart on Small - Market size and forecast 2024-2029 ($ million)
      • Data Table on Small - Market size and forecast 2024-2029 ($ million)
      • Chart on Small - Year-over-year growth 2024-2029 (%)
      • Data Table on Small - Year-over-year growth 2024-2029 (%)
    • 9.5 Miniature - Market size and forecast 2024-2029
      • Chart on Miniature - Market size and forecast 2024-2029 ($ million)
      • Data Table on Miniature - Market size and forecast 2024-2029 ($ million)
      • Chart on Miniature - Year-over-year growth 2024-2029 (%)
      • Data Table on Miniature - Year-over-year growth 2024-2029 (%)
    • 9.6 Micro - Market size and forecast 2024-2029
      • Chart on Micro - Market size and forecast 2024-2029 ($ million)
      • Data Table on Micro - Market size and forecast 2024-2029 ($ million)
      • Chart on Micro - Year-over-year growth 2024-2029 (%)
      • Data Table on Micro - Year-over-year growth 2024-2029 (%)
    • 9.7 Market opportunity by Product Type
      • Market opportunity by Product Type ($ million)
      • Data Table on Market opportunity by Product Type ($ million)

    10 Market Segmentation by Sector

    • 10.1 Market segments
      • Chart on Sector - Market share 2024-2029 (%)
      • Data Table on Sector - Market share 2024-2029 (%)
    • 10.2 Comparison by Sector
      • Chart on Comparison by Sector
      • Data Table on Comparison by Sector
    • 10.3 Oil and gas - Market size and forecast 2024-2029
      • Chart on Oil and gas - Market size and forecast 2024-2029 ($ million)
      • Data Table on Oil and gas - Market size and forecast 2024-2029 ($ million)
      • Chart on Oil and gas - Year-over-year growth 2024-2029 (%)
      • Data Table on Oil and gas - Year-over-year growth 2024-2029 (%)
    • 10.4 Chemicals - Market size and forecast 2024-2029
      • Chart on Chemicals - Market size and forecast 2024-2029 ($ million)
      • Data Table on Chemicals - Market size and forecast 2024-2029 ($ million)
      • Chart on Chemicals - Year-over-year growth 2024-2029 (%)
      • Data Table on Chemicals - Year-over-year growth 2024-2029 (%)
    • 10.5 Water and wastewater management - Market size and forecast 2024-2029
      • Chart on Water and wastewater management - Market size and forecast 2024-2029 ($ million)
      • Data Table on Water and wastewater management - Market size and forecast 2024-2029 ($ million)
      • Chart on Water and wastewater management - Year-over-year growth 2024-2029 (%)
      • Data Table on Water and wastewater management - Year-over-year growth 2024-2029 (%)
    • 10.6 Power generation - Market size and forecast 2024-2029
      • Chart on Power generation - Market size and forecast 2024-2029 ($ million)
      • Data Table on Power generation - Market size and forecast 2024-2029 ($ million)
      • Chart on Power generation - Year-over-year growth 2024-2029 (%)
      • Data Table on Power generation - Year-over-year growth 2024-2029 (%)
    • 10.7 Others - Market size and forecast 2024-2029
      • Chart on Others - Market size and forecast 2024-2029 ($ million)
      • Data Table on Others - Market size and forecast 2024-2029 ($ million)
      • Chart on Others - Year-over-year growth 2024-2029 (%)
      • Data Table on Others - Year-over-year growth 2024-2029 (%)
    • 10.8 Market opportunity by Sector
      • Market opportunity by Sector ($ million)
      • Data Table on Market opportunity by Sector ($ million)

    11 Customer Landscape

    • 11.1 Customer landscape overview
      • Analysis of price sensitivity, lifecycle, customer purchase basket, adoption rates, and purchase criteria

    12 Geographic Landscape

    • 12.1 Geographic segmentation
      • Chart on Market share by geography 2024-2029 (%)
      • Data Table on Market share by geography 2024-2029 (%)
    • 12.2 Geographic comparison
      • Chart on Geographic comparison
      • Data Table on Geographic comparison
    • 12.3 APAC - Market size and forecast 2024-2029
      • Chart on APAC - Market size and forecast 2024-2029 ($ million)
      • Data Table on APAC - Market size and forecast 2024-2029 ($ million)
      • Chart on APAC - Year-over-year growth 2024-2029 (%)
      • Data Table on APAC - Year-over-year growth 2024-2029 (%)
    • 12.4 North America - Market size and forecast 2024-2029
      • Chart on North America - Market size and forecast 2024-2029 ($ million)
      • Data Table on North America - Market size and forecast 2024-2029 ($ million)
      • Chart on North America - Year-over-year growth 2024-2029 (%)
      • Data Table on North America - Year-over-year growth 2024-2029 (%)
    • 12.5 Europe - Market size and forecast 2024-2029
      • Chart on Europe - Market size and forecast 2024-2029 ($ million)
      • Data Table on Europe - Market size and forecast 2024-2029 ($ million)
      • Chart on Europe - Year-over-year growth 2024-2029 (%)
      • Data Table on Europe - Year-over-year growth 2024-2029 (%)
    • 12.6 Middle East and Africa - Market size and forecast 2024-2029
      • Chart on Middle East and Africa - Market size and forecast 2024-2029 ($ million)
      • Data Table on Middle East and Africa - Market size and forecast 2024-2029 ($ million)
      • Chart on Middle East and Africa - Year-over-year growth 2024-2029 (%)
      • Data Table on Middle East and Africa - Year-over-year growth 2024-2029 (%)
    • 12.7 South America - Market size and forecast 2024-2029
      • Chart on South America - Market size and forecast 2024-2029 ($ million)
      • Data Table on South America - Market size and forecast 2024-2029 ($ million)
      • Chart on South America - Year-over-year growth 2024-2029 (%)
      • Data Table on South America - Year-over-year growth 2024-2029 (%)
    • 12.8 US - Market size and forecast 2024-2029
      • Chart on US - Market size and forecast 2024-2029 ($ million)
      • Data Table on US - Market size and forecast 2024-2029 ($ million)
      • Chart on US - Year-over-year growth 2024-2029 (%)
      • Data Table on US - Year-over-year growth 2024-2029 (%)
    • 12.9 China - Market size and forecast 2024-2029
      • Chart on China - Market size and forecast 2024-2029 ($ million)
      • Data Table on China - Market size and forecast 2024-2029 ($ million)
      • Chart on China - Year-over-year growth 2024-2029 (%)
      • Data Table on China - Year-over-year growth 2024-2029 (%)
    • 12.10 Japan - Market size and forecast 2024-2029
      • Chart on Japan - Market size and forecast 2024-2029 ($ million)
      • Data Table on Japan - Market size and forecast 2024-2029 ($ million)
      • Chart on Japan - Year-over-year growth 2024-2029 (%)
      • Data Table on Japan - Year-over-year growth 2024-2029 (%)
    • 12.11 Germany - Market size and forecast 2024-2029
      • Chart on Germany - Market size and forecast 2024-2029 ($ million)
      • Data Table on Germany - Market size and forecast 2024-2029 ($ million)
      • Chart on Germany - Year-over-year growth 2024-2029 (%)
      • Data Table on Germany - Year-over-year growth 2024-2029 (%)
    • 12.12 India - Market size and forecast 2024-2029
      • Chart on India - Market size and forecast 2024-2029 ($ million)
      • Data Table on India - Market size and forecast 2024-2029 ($ million)
      • Chart on India - Year-over-year growth 2024-2029 (%)
      • Data Table on India - Year-over-year growth 2024-2029 (%)
    • 12.13 South Korea - Market size and forecast 2024-2029
      • Chart on South Korea - Market size and forecast 2024-2029 ($ million)
      • Data Table on South Korea - Market size and forecast 2024-2029 ($ million)
      • Chart on South Korea - Year-over-year growth 2024-2029 (%)
      • Data Table on South Korea - Year-over-year growth 2024-2029 (%)
    • 12.14 UK - Market size and forecast 2024-2029
      • Chart on UK - Market size and forecast 2024-2029 ($ million)
      • Data Table on UK - Market size and forecast 2024-2029 ($ million)
      • Chart on UK - Year-over-year growth 2024-2029 (%)
      • Data Table on UK - Year-over-year growth 2024-2029 (%)
    • 12.15 Canada - Market size and forecast 2024-2029
      • Chart on Canada - Market size and forecast 2024-2029 ($ million)
      • Data Table on Canada - Market size and forecast 2024-2029 ($ million)
      • Chart on Canada - Year-over-year growth 2024-2029 (%)
      • Data Table on Canada - Year-over-year growth 2024-2029 (%)
    • 12.16 France - Market size and forecast 2024-2029
      • Chart on France - Market size and forecast 2024-2029 ($ million)
      • Data Table on France - Market size and forecast 2024-2029 ($ million)
      • Chart on France - Year-over-year growth 2024-2029 (%)
      • Data Table on France - Year-over-year growth 2024-2029 (%)
    • 12.17 Brazil - Market size and forecast 2024-2029
      • Chart on Brazil - Market size and forecast 2024-2029 ($ million)
      • Data Table on Brazil - Market size and forecast 2024-2029 ($ million)
      • Chart on Brazil - Year-over-year growth 2024-2029 (%)
      • Data Table on Brazil - Year-over-year growth 2024-2029 (%)
    • 12.18 Market opportunity by geography
      • Market opportunity by geography ($ million)
      • Data Tables on Market opportunity by geography ($ million)

    13 Drivers, Challenges, and Opportunity/Restraints

    • 13.1 Market drivers
      • 13.2 Market challenges
        • 13.3 Impact of drivers and challenges
          • Impact of drivers and challenges in 2024 and 2029
        • 13.4 Market opportunities/restraints

          14 Competitive Landscape

          • 14.1 Overview
            • 14.2 Competitive Landscape
              • Overview on criticality of inputs and factors of differentiation
            • 14.3 Landscape disruption
              • Overview on factors of disruption
            • 14.4 Industry risks
              • Impact of key risks on business

            15 Competitive Analysis

            • 15.1 Companies profiled
              • Companies covered
            • 15.2 Company ranking index
              • Company ranking index
            • 15.3 Market positioning of companies
              • Matrix on companies position and classification
            • 15.4 Airtac International Group
              • Airtac International Group - Overview
              • Airtac International Group - Product / Service
              • Airtac International Group - Key offerings
              • SWOT
            • 15.5 Bosch Rexroth AG
              • Bosch Rexroth AG - Overview
              • Bosch Rexroth AG - Product / Service
              • Bosch Rexroth AG - Key offerings
              • SWOT
            • 15.6 Christian Burkert GmbH and Co. KG
              • Christian Burkert GmbH and Co. KG - Overview
              • Christian Burkert GmbH and Co. KG - Product / Service
              • Christian Burkert GmbH and Co. KG - Key offerings
              • SWOT
            • 15.7 CEME S.p.A.
              • CEME S.p.A. - Overview
              • CEME S.p.A. - Product / Service
              • CEME S.p.A. - Key offerings
              • SWOT
            • 15.8 CKD Corp.
              • CKD Corp. - Overview
              • CKD Corp. - Business segments
              • CKD Corp. - Key offerings
              • CKD Corp. - Segment focus
              • SWOT
            • 15.9 Danfoss AS
              • Danfoss AS - Overview
              • Danfoss AS - Product / Service
              • Danfoss AS - Key offerings
              • SWOT
            • 15.10 Emerson Electric Co.
              • Emerson Electric Co. - Overview
              • Emerson Electric Co. - Business segments
              • Emerson Electric Co. - Key news
              • Emerson Electric Co. - Key offerings
              • Emerson Electric Co. - Segment focus
              • SWOT
            • 15.11 Festo SE and Co. KG
              • Festo SE and Co. KG - Overview
              • Festo SE and Co. KG - Product / Service
              • Festo SE and Co. KG - Key offerings
              • SWOT
            • 15.12 GEMU Group
              • GEMU Group - Overview
              • GEMU Group - Product / Service
              • GEMU Group - Key offerings
              • SWOT
            • 15.13 Honeywell International Inc.
              • Honeywell International Inc. - Overview
              • Honeywell International Inc. - Business segments
              • Honeywell International Inc. - Key news
              • Honeywell International Inc. - Key offerings
              • Honeywell International Inc. - Segment focus
              • SWOT
            • 15.14 IMI Process Automation
              • IMI Process Automation - Overview
              • IMI Process Automation - Product / Service
              • IMI Process Automation - Key offerings
              • SWOT
            • 15.15 Kendrion NV
              • Kendrion NV - Overview
              • Kendrion NV - Product / Service
              • Kendrion NV - Key offerings
              • SWOT
            • 15.16 Parker Hannifin Corp.
              • Parker Hannifin Corp. - Overview
              • Parker Hannifin Corp. - Business segments
              • Parker Hannifin Corp. - Key offerings
              • Parker Hannifin Corp. - Segment focus
              • SWOT
            • 15.17 SMC Corp.
              • SMC Corp. - Overview
              • SMC Corp. - Product / Service
              • SMC Corp. - Key offerings
              • SWOT
            • 15.18 Takasago Electric Inc.
              • Takasago Electric Inc. - Overview
              • Takasago Electric Inc. - Product / Service
              • Takasago Electric Inc. - Key offerings
              • SWOT

            16 Appendix

            • 16.1 Scope of the report
              • 16.2 Inclusions and exclusions checklist
                • Inclusions checklist
                • Exclusions checklist
              • 16.3 Currency conversion rates for US$
                • Currency conversion rates for US$
              • 16.4 Research methodology
                • Research methodology
              • 16.5 Data procurement
                • Information sources
              • 16.6 Data validation
                • Data validation
              • 16.7 Validation techniques employed for market sizing
                • Validation techniques employed for market sizing
              • 16.8 Data synthesis
                • Data synthesis
              • 16.9 360 degree market analysis
                • 360 degree market analysis
              • 16.10 List of abbreviations
                • List of abbreviations

              Research Methodology

              Technavio presents a detailed picture of the market by way of study, synthesis, and summation of data from multiple sources. The analysts have presented the various facets of the market with a particular focus on identifying the key industry influencers. The data thus presented is comprehensive, reliable, and the result of extensive research, both primary and secondary.

              INFORMATION SOURCES

              Primary sources

              • Manufacturers and suppliers
              • Channel partners
              • Industry experts
              • Strategic decision makers

              Secondary sources

              • Industry journals and periodicals
              • Government data
              • Financial reports of key industry players
              • Historical data
              • Press releases

              DATA ANALYSIS

              Data Synthesis

              • Collation of data
              • Estimation of key figures
              • Analysis of derived insights

              Data Validation

              • Triangulation with data models
              • Reference against proprietary databases
              • Corroboration with industry experts

              REPORT WRITING

              Qualitative

              • Market drivers
              • Market challenges
              • Market trends
              • Five forces analysis

              Quantitative

              • Market size and forecast
              • Market segmentation
              • Geographical insights
              • Competitive landscape

              Interested in this report?

              Get your sample now to see our research methodology and insights!

              Download Now

              Frequently Asked Questions

              Solenoid Valves market growth will increase by $ 1428.1 mn during 2025-2029.

              The Solenoid Valves market is expected to grow at a CAGR of 4.7% during 2025-2029.

              Solenoid Valves market is segmented by Type( Two-way valves, Three-way valves, Four-way valves) Material( Stainless steel, Brass, Aluminum, Engineering plastics, South America) Product Type( Large, Small, Miniature, Micro)

              Airtac International Group, Bosch Rexroth AG, Christian Burkert GmbH and Co. KG, Camozzi Automation S.p.A., CEME S.p.A., CKD Corp., Danfoss AS, Emerson Electric Co., Festo SE and Co. KG, GEMU Group, Honeywell International Inc., IMI Process Automation, Kendrion NV, Parker Hannifin Corp., SMC Corp., Takasago Electric Inc., Valcor Engineering Corp. are a few of the key vendors in the Solenoid Valves market.

              APAC will register the highest growth rate of 41% among the other regions. Therefore, the Solenoid Valves market in APAC is expected to garner significant business opportunities for the vendors during the forecast period.

              US, China, Japan, India, Germany, South Korea, UK, Canada, Brazil, France

              • Relentless pace of industrial automation and industry 4.0 integrationA primary and enduring driver for the global solenoid valves market is the pervasive and accelerating adoption of industrial automation across all manufacturing and process sectors. The global push toward Industry 4.0 is the driving factor this market.
              • or the fourth industrial revolution is the driving factor this market.
              • has transformed factory floors into highly interconnected ecosystems where data is the driving factor this market.
              • robotics is the driving factor this market.
              • and automated machinery operate in concert to maximize efficiency is the driving factor this market.
              • productivity is the driving factor this market.
              • and flexibility. Solenoid valves are the fundamental electromechanical actuators within these systems is the driving factor this market.
              • providing the critical on-off or proportional control for the pneumatic and hydraulic circuits that power everything from robotic arms and conveyor systems to machine tools and automated assembly lines. The demand is no longer just for reliable standalone components but for intelligent fluid control solutions that can integrate seamlessly into a smart factory environment. This evolution has spurred significant innovation is the driving factor this market.
              • leading to the development of valve terminals and manifolds equipped with digital communication protocols such as IO-Link is the driving factor this market.
              • EtherNet/IP is the driving factor this market.
              • and PROFINET. These intelligent units can provide real-time diagnostic feedback on pressure is the driving factor this market.
              • cycle count is the driving factor this market.
              • and potential faults is the driving factor this market.
              • enabling predictive maintenance strategies that drastically reduce unplanned downtime. This capability is invaluable in high-throughput industries like automotive is the driving factor this market.
              • electronics is the driving factor this market.
              • and food and beverage packaging. A clear illustration of this trend was the launch of the Festo AG and Co. KG VTUX valve terminal. This highly configurable and modular platform was explicitly designed for modern automation concepts is the driving factor this market.
              • integrating advanced features like hot-swappable valves and seamless IIoT connectivity is the driving factor this market.
              • thereby demonstrating the markets decisive shift toward intelligent is the driving factor this market.
              • networked pneumatic systems that are the bedrock of Industry 4.0. is the driving factor this market.

              The Solenoid Valves market vendors should focus on grabbing business opportunities from the Two-way valves segment as it accounted for the largest market share in the base year.