Solar PV Tracker Market Analysis, Size, and Forecast 2026-2030: North America (US, Canada, and Mexico), Europe (Germany, UK, and France), APAC (China, India, and Japan), South America (Brazil, Argentina, and Colombia), Middle East and Africa (Saudi Arabia, UAE, and South Africa), and Rest of World (ROW)

Solar PV Tracker Market Analysis, Size, and Forecast 2026-2030:
North America (US, Canada, and Mexico), Europe (Germany, UK, and France), APAC (China, India, and Japan), South America (Brazil, Argentina, and Colombia), Middle East and Africa (Saudi Arabia, UAE, and South Africa), and Rest of World (ROW)

Published: Dec 2025 290 Pages SKU: IRTNTR41016

Market Overview at a Glance

$21.24 B
Market Opportunity
21.9%
CAGR 2025 - 2030
32.8%
North America Growth
$9.21 B
Single axis tracker segment 2024

Solar PV Tracker Market Size 2026-2030

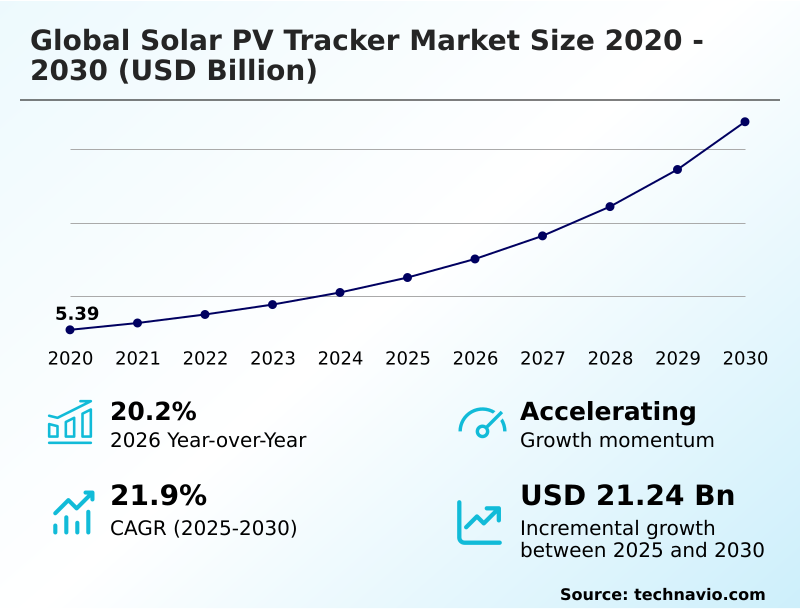
The solar pv tracker market size is valued to increase by USD 21.24 billion, at a CAGR of 21.9% from 2025 to 2030. Rise in investments in renewable energy will drive the solar pv tracker market.

Major Market Trends & Insights

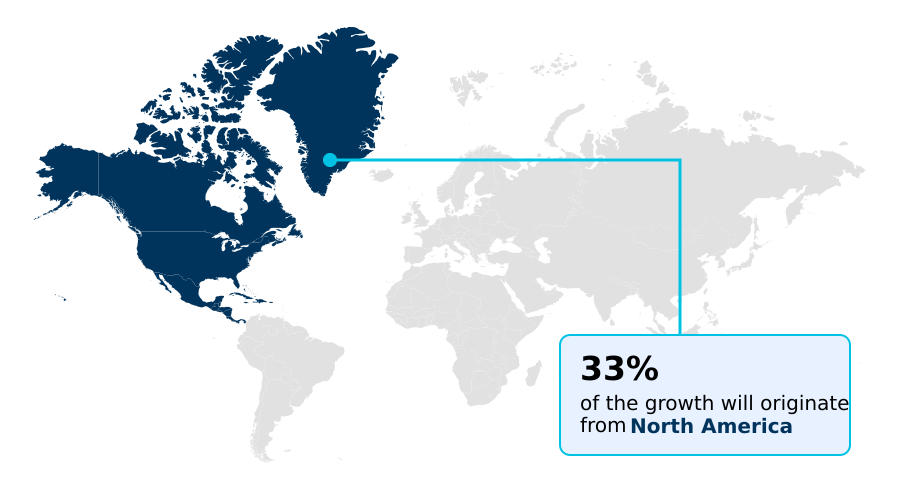
  • North America dominated the market and accounted for a 32.8% growth during the forecast period.
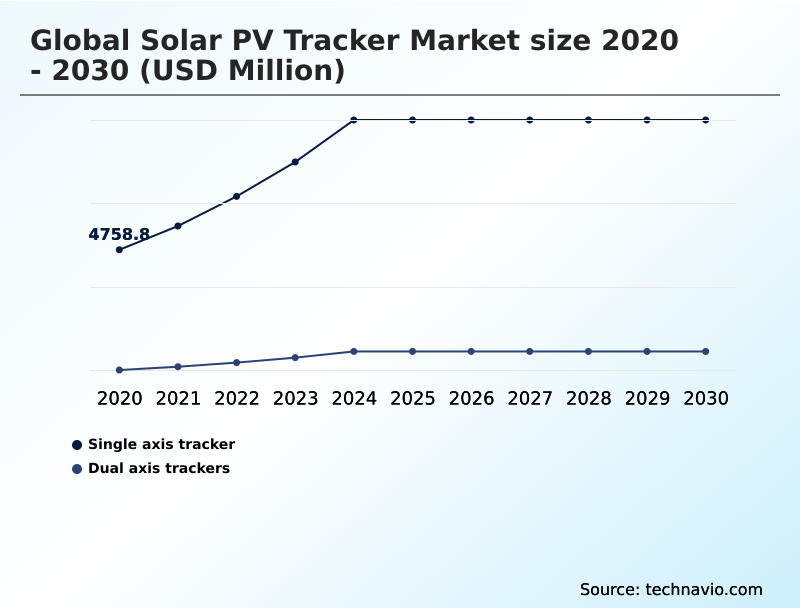
  • By Product - Single axis tracker segment was valued at USD 9.21 billion in 2024
  • By Technology - Solar PV segment accounted for the largest market revenue share in 2024

Market Size & Forecast

  • Market Opportunities: USD 28.37 billion
  • Market Future Opportunities: USD 21.24 billion
  • CAGR from 2025 to 2030 : 21.9%

Market Summary

  • The solar PV tracker market is expanding as the demand for enhanced solar power generation efficiency intensifies. These systems, which include single axis tracker and dual axis tracker models, are critical for maximizing energy yield from photovoltaic (pv) modules by continuously optimizing their orientation to the sun.
  • This enhanced output helps lower the overall levelized cost of electricity (lcoe), making solar projects more financially viable. The adoption is driven by falling costs of balance-of-system (bos) components and supportive regulatory frameworks promoting the clean energy transition.
  • For instance, a utility-scale developer evaluating a new project must weigh the higher initial capex of a dual axis tracker against its superior energy capture, especially when paired with bifacial solar modules. This decision directly impacts the project's long-term return on investment (roi) and its ability to meet power purchase agreements (ppas).
  • While these systems improve capacity utilization, challenges related to solar irradiance variability and grid stability remain. Innovations in tracker control systems, incorporating predictive maintenance algorithms and real-time monitoring platforms, are crucial for mitigating these issues and ensuring reliable performance and extending asset lifespan.

What will be the Size of the Solar PV Tracker Market during the forecast period?

Get Key Insights on Market Forecast (PDF) Request Free Sample

How is the Solar PV Tracker Market Segmented?

The solar pv tracker industry research report provides comprehensive data (region-wise segment analysis), with forecasts and estimates in "USD million" for the period 2026-2030, as well as historical data from 2020-2024 for the following segments.

  • Product
    • Single axis tracker
    • Dual axis trackers
  • Technology
    • Solar PV
    • CSP
  • Application
    • Utility
    • Commercial
    • Residential
  • Geography
    • North America
      • US
      • Canada
      • Mexico
    • Europe
      • Germany
      • UK
      • France
    • APAC
      • China
      • India
      • Japan
    • South America
      • Brazil
      • Argentina
      • Colombia
    • Middle East and Africa
      • Saudi Arabia
      • UAE
      • South Africa
    • Rest of World (ROW)

By Product Insights

The single axis tracker segment is estimated to witness significant growth during the forecast period.

The market is primarily segmented by product and technology. The single axis tracker segment remains dominant, favored for its balance of cost-effectiveness and performance enhancement in utility-scale solar projects.

These systems, which rotate photovoltaic (pv) modules along one axis, are instrumental in improving solar power generation efficiency and overall solar project bankability.

Their design simplifies installation, contributing to a lower levelized cost of electricity (lcoe) and reduced operational expenditure reduction.

Integrating these trackers with bifacial solar modules further amplifies output, with deployments demonstrating an increase in energy capture by up to 25% over fixed-tilt installations.

This synergy between tracker control systems and advanced panel technology solidifies their role in maximizing capacity utilization and supporting global decarbonization initiatives while improving land-use efficiency and return on investment (roi).

Request Free Sample

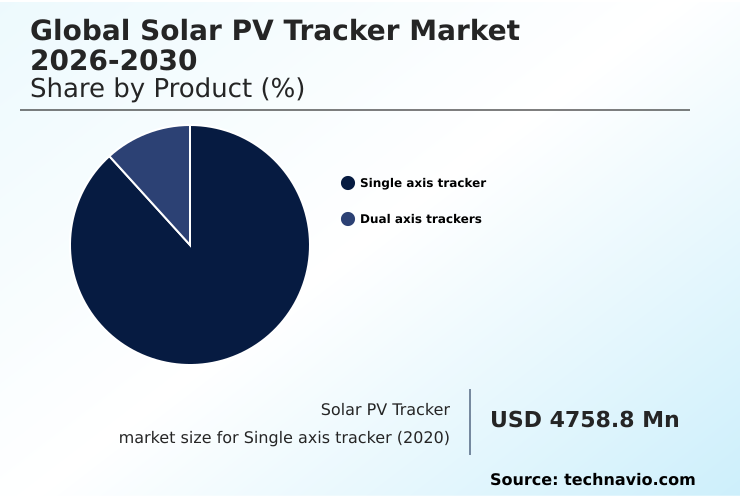
The Single axis tracker segment was valued at USD 9.21 billion in 2024 and showed a gradual increase during the forecast period.

Request Free Sample

Regional Analysis

North America is estimated to contribute 32.8% to the growth of the global market during the forecast period.Technavio’s analysts have elaborately explained the regional trends and drivers that shape the market during the forecast period.

See How Solar PV Tracker Market Demand is Rising in North America Request Free Sample

The geographic landscape is varied, with APAC's expansion outpacing North America's growth by nearly 1.1 percentage points. North America focuses on utility-scale projects to improve grid stability, while Europe optimizes land use.

The Middle East and Africa leverage high direct normal irradiance (dni) for concentrated solar power (csp) projects, where dual axis tracker technology is used to orient heliostat fields, achieving performance gains of up to 40% and enabling thermal energy storage for enhanced grid resilience.

Innovations like automated alignment systems and smart grid integration support this growth across regions, fostering energy independence. This regional differentiation highlights how local factors influence technology choices, from residential rooftop systems to off-grid solar applications, driving sector coupling globally.

Market Dynamics

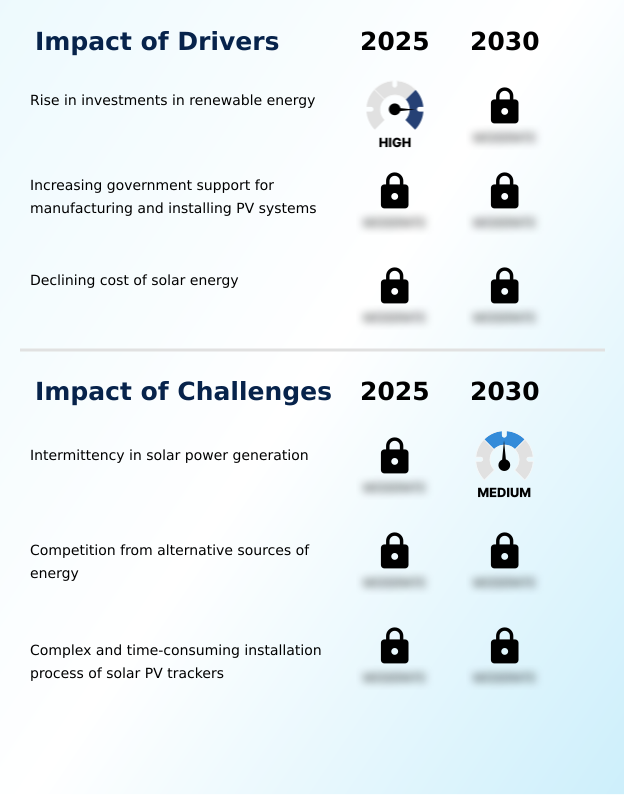
Our researchers analyzed the data with 2025 as the base year, along with the key drivers, trends, and challenges. A holistic analysis of drivers will help companies refine their marketing strategies to gain a competitive advantage.

  • Strategic decision-making in the industry increasingly involves a detailed cost-benefit analysis of residential solar trackers and a nuanced understanding of the impact of bifacial modules on tracker roi. For utility-scale solar farms, the core debate often centers on single axis vs dual axis tracker lcoe, where the higher upfront cost of dual-axis systems must be justified by superior energy gains.
  • Optimizing solar panel output with trackers is no longer just a mechanical process; it relies on improving energy yield with smart tracking algorithms and advanced solar tracker predictive maintenance technologies. Integrating trackers with battery storage systems is becoming essential for enhancing grid stability with tracker-equipped pv.
  • Furthermore, advancements in solar tracker actuator design and pv tracker control system software advancements are addressing the challenges of tracker installation in difficult terrain and improving performance. For instance, operators using platforms for remote tracker monitoring report a reduction in operational costs, with some achieving a 15% improvement in maintenance dispatch efficiency compared to traditional methods.
  • The solar tracker roi for commercial buildings is strengthened when accounting for these operational gains and the impact of soiling on tracker efficiency. As the market evolves, topics like tracker technology for agrivoltaic systems and government incentives for solar tracker deployment are becoming central to long-term strategy and reducing operational costs with remote tracker monitoring.

What are the key market drivers leading to the rise in the adoption of Solar PV Tracker Industry?

  • The market is significantly driven by the substantial rise in investments directed toward renewable energy projects globally.

  • Market expansion is driven by investments in renewable energy infrastructure and supportive regulatory frameworks that incentivize adoption. Projects incorporating trackers improve energy yield, delivering predictable generation profiles essential for securing power purchase agreements (ppas).
  • This enhances project viability within various project financing models. Government support, through mechanisms like renewable energy certificates and feed-in tariffs, reduces barriers for developers, accelerating distributed generation and sustainable energy development.
  • Furthermore, the declining cost of balance-of-system (bos) components and high-performing crystalline silicon cells makes trackers more viable, with some projects reporting a 12% reduction in operational costs through optimized designs that maximize capture of solar irradiance and help in carbon footprint reduction.

What are the market trends shaping the Solar PV Tracker Industry?

  • A primary market trend is the continuous improvement in the conversion efficiency of solar PV modules, which directly enhances the energy yield and financial viability of projects utilizing tracker systems.

  • Key trends are reshaping deployments, with the rise of smart city infrastructure creating demand for decentralized energy solutions where trackers can increase output per area by up to 35%. This facilitates better grid balancing and peak demand management.
  • Concurrently, improvements in PV module efficiency, driven by advancements like heterojunction technology (hjt) and tunnel oxide passivated contact (topcon), amplify tracker benefits and improve supply chain optimization. This synergy is leading to payback period reductions of over 18% for commercial solar installations.
  • A global slowdown in coal power investment further accelerates this clean energy transition, positioning tracker-equipped farms as essential for meeting ESG mandates, supported by innovations in silicon wafers and thin-film solar cells managed by advanced energy management platforms.

What challenges does the Solar PV Tracker Industry face during its growth?

  • A key challenge affecting industry growth is the inherent intermittency of solar power generation, which impacts grid stability and project bankability.

  • Technical and operational challenges persist, with solar power's intermittency impacting grid stability, often necessitating integration with energy storage solutions or microgrid systems. The complex installation process for turnkey pv solar power systems, especially in areas requiring terrain-adaptive systems and detailed wind load analysis, can extend project timelines.
  • However, modular designs have been shown to reduce installation time by up to 20% compared to earlier fixed-tilt installations. Competition from alternative energy sources also influences investment.
  • To remain competitive, tracker systems must demonstrate clear value, with innovations in predictive maintenance algorithms and durable actuators and sensors enabling a 15% reduction in unscheduled service calls, thereby supporting asset lifespan extension and improving the reliability of components like solar pv inverters and pv backsheets.

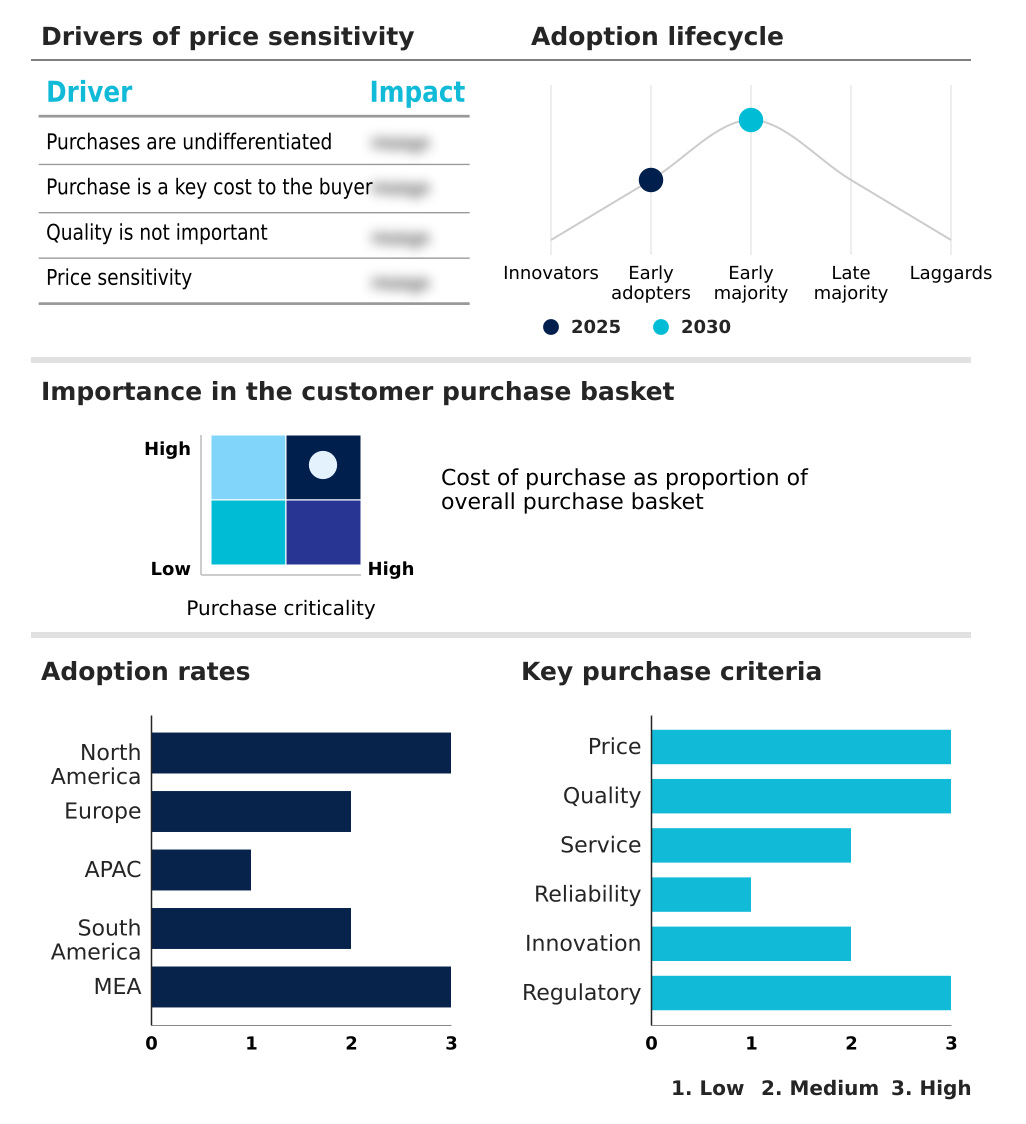
Exclusive Technavio Analysis on Customer Landscape

The solar pv tracker market forecasting report includes the adoption lifecycle of the market, covering from the innovator’s stage to the laggard’s stage. It focuses on adoption rates in different regions based on penetration. Furthermore, the solar pv tracker market report also includes key purchase criteria and drivers of price sensitivity to help companies evaluate and develop their market growth analysis strategies.

Customer Landscape of Solar PV Tracker Industry

Competitive Landscape

Companies are implementing various strategies, such as strategic alliances, solar pv tracker market forecast, partnerships, mergers and acquisitions, geographical expansion, and product/service launches, to enhance their presence in the industry.

All Earth Renewables - Key offerings include advanced dual-axis solar PV trackers engineered to optimize renewable energy generation for diverse applications.

The industry research and growth report includes detailed analyses of the competitive landscape of the market and information about key companies, including:

  • All Earth Renewables
  • ArcelorMittal SA
  • Arctech Solar
  • Array Technologies Inc.
  • First Solar Inc.
  • Flex Ltd.
  • GameChange Solar
  • Grupo Gransolar SL
  • Hanwha Group
  • Hao solar Co Ltd.
  • IDEEMATEC Germany GmbH
  • Mahindra and Mahindra Ltd.
  • NOV Inc.
  • Scorpius Trackers Pvt. Ltd.
  • Soltec Energias Renovables SL
  • Sun Action Trackers LLC
  • SunPower Corp.
  • Trina Solar Co. Ltd.
  • Valmont Industries Inc.

Qualitative and quantitative analysis of companies has been conducted to help clients understand the wider business environment as well as the strengths and weaknesses of key industry players. Data is qualitatively analyzed to categorize companies as pure play, category-focused, industry-focused, and diversified; it is quantitatively analyzed to categorize companies as dominant, leading, strong, tentative, and weak.

Recent Development and News in Solar pv tracker market

  • In January 2025, Trina Solar announced a new world record for PV module conversion efficiency, enhancing the energy yield potential when paired with solar tracker systems.
  • In March 2025, Array Technologies Inc. reported that its single axis trackers deployed in new Texas utility-scale projects successfully reduced the levelized cost of electricity by over 12% compared to fixed-tilt systems.
  • In April 2025, First Solar Inc. announced a USD 500 million investment to expand its North American portfolio of tracker-integrated solar PV projects, targeting large-scale farms in Texas and California.
  • In May 2025, Adani Solar accelerated its installation of single axis trackers across multiple utility projects in India, responding to a new government initiative designed to support domestic tracker manufacturing and reduce import dependency.

Dive into Technavio’s robust research methodology, blending expert interviews, extensive data synthesis, and validated models for unparalleled Solar PV Tracker Market insights. See full methodology.

Market Scope
Page number 290
Base year 2025
Historic period 2020-2024
Forecast period 2026-2030
Growth momentum & CAGR Accelerate at a CAGR of 21.9%
Market growth 2026-2030 USD 21239.7 million
Market structure Fragmented
YoY growth 2025-2026(%) 20.2%
Key countries US, Canada, Mexico, Germany, UK, France, Spain, Italy, The Netherlands, China, India, Japan, South Korea, Australia, Indonesia, Brazil, Argentina, Colombia, Saudi Arabia, UAE, South Africa, Israel and Turkey
Competitive landscape Leading Companies, Market Positioning of Companies, Competitive Strategies, and Industry Risks

Request Free Sample

Research Analyst Overview

  • The market's evolution is marked by a decisive shift toward optimizing the levelized cost of electricity (lcoe) through advanced hardware and software integration. The core technology, including both single axis tracker and dual axis tracker systems, is now a standard component in planning for utility-scale deployments.
  • Boardroom decisions are increasingly influenced by the long-term operational performance of these assets, where the integration of predictive maintenance algorithms has demonstrated the ability to reduce unscheduled downtime by over 30%. The choice between technologies like heterojunction technology (hjt) and tunnel oxide passivated contact (topcon) for photovoltaic (pv) modules is now intrinsically linked to tracker selection to maximize energy yield.
  • This synergy is critical for achieving favorable power purchase agreements (ppas). While challenges from variable solar irradiance persist, the focus is on enhancing grid stability through smarter tracker control systems and real-time monitoring platforms, ensuring high capacity utilization and making tracker-equipped solar farms a more bankable asset class within the renewable energy infrastructure.

What are the Key Data Covered in this Solar PV Tracker Market Research and Growth Report?

  • What is the expected growth of the Solar PV Tracker Market between 2026 and 2030?

    • USD 21.24 billion, at a CAGR of 21.9%

  • What segmentation does the market report cover?

    • The report is segmented by Product (Single axis tracker, and Dual axis trackers), Technology (Solar PV, and CSP), Application (Utility, Commercial, and Residential) and Geography (North America, Europe, APAC, South America, Middle East and Africa)

  • Which regions are analyzed in the report?

    • North America, Europe, APAC, South America and Middle East and Africa

  • What are the key growth drivers and market challenges?

    • Rise in investments in renewable energy, Intermittency in solar power generation

  • Who are the major players in the Solar PV Tracker Market?

    • All Earth Renewables, ArcelorMittal SA, Arctech Solar, Array Technologies Inc., First Solar Inc., Flex Ltd., GameChange Solar, Grupo Gransolar SL, Hanwha Group, Hao solar Co Ltd., IDEEMATEC Germany GmbH, Mahindra and Mahindra Ltd., NOV Inc., Scorpius Trackers Pvt. Ltd., Soltec Energias Renovables SL, Sun Action Trackers LLC, SunPower Corp., Trina Solar Co. Ltd. and Valmont Industries Inc.

Market Research Insights

  • Market dynamics are shaped by a strong push for sustainable energy development and operational expenditure reduction across industries. Utility-scale solar projects are increasingly standardizing on tracker systems, with deployments showing up to a 25% increase in energy output compared to fixed-tilt installations, directly improving solar project bankability.
  • This shift is part of a broader clean energy transition, supported by regulatory frameworks that favor renewable energy infrastructure. In commercial solar installations, integrating trackers has been shown to improve return on investment (ROI) by accelerating payback periods by over 15%. Even in residential rooftop systems, smart grid integration with trackers is enhancing energy independence.
  • Challenges such as complex project financing models and the need for advanced energy management platforms are being addressed through innovations that extend asset lifespan and optimize the supply chain.

We can help! Our analysts can customize this solar pv tracker market research report to meet your requirements.

Get in touch

1. Executive Summary

1.1 Market overview

Executive Summary - Chart on Market Overview
Executive Summary - Data Table on Market Overview
Executive Summary - Chart on Global Market Characteristics
Executive Summary - Chart on Market by Geography
Executive Summary - Chart on Market Segmentation by Product
Executive Summary - Chart on Market Segmentation by Technology
Executive Summary - Chart on Market Segmentation by Application
Executive Summary - Chart on Incremental Growth
Executive Summary - Data Table on Incremental Growth
Executive Summary - Chart on Company Market Positioning

2. Technavio Analysis

2.1 Analysis of price sensitivity, lifecycle, customer purchase basket, adoption rates, and purchase criteria

2.2 Criticality of inputs and Factors of differentiation

Chart on Overview on criticality of inputs and factors of differentiation

2.3 Factors of disruption

Chart on Overview on factors of disruption

2.4 Impact of drivers and challenges

Chart on Impact of drivers and challenges in 2025 and 2030

3. Market Landscape

3.1 Market ecosystem

Chart on Parent Market
Data Table on - Parent Market

3.2 Market characteristics

Chart on Market characteristics analysis

3.3 Value chain analysis

Chart on Value chain analysis

4. Market Sizing

4.1 Market definition

Data Table on Offerings of companies included in the market definition

4.2 Market segment analysis

Market segments

4.3 Market size 2025

4.4 Market outlook: Forecast for 2025-2030

Chart on Global - Market size and forecast 2025-2030 ($ million)
Data Table on Global - Market size and forecast 2025-2030 ($ million)
Chart on Global Market: Year-over-year growth 2025-2030 (%)
Data Table on Global Market: Year-over-year growth 2025-2030 (%)

5. Historic Market Size

5.1 Global Solar PV Tracker Market 2020 - 2024

Historic Market Size - Data Table on Global Solar PV Tracker Market 2020 - 2024 ($ million)

5.2 Product segment analysis 2020 - 2024

Historic Market Size - Product Segment 2020 - 2024 ($ million)

5.3 Technology segment analysis 2020 - 2024

Historic Market Size - Technology Segment 2020 - 2024 ($ million)

5.4 Application segment analysis 2020 - 2024

Historic Market Size - Application Segment 2020 - 2024 ($ million)

5.5 Geography segment analysis 2020 - 2024

Historic Market Size - Geography Segment 2020 - 2024 ($ million)

5.6 Country segment analysis 2020 - 2024

Historic Market Size - Country Segment 2020 - 2024 ($ million)

6. Qualitative Analysis

6.1 AI impact on Global Solar PV Tracker Market

7. Five Forces Analysis

7.1 Five forces summary

Five forces analysis - Comparison between 2025 and 2030

7.2 Bargaining power of buyers

Bargaining power of buyers - Impact of key factors 2025 and 2030

7.3 Bargaining power of suppliers

Bargaining power of suppliers - Impact of key factors in 2025 and 2030

7.4 Threat of new entrants

Threat of new entrants - Impact of key factors in 2025 and 2030

7.5 Threat of substitutes

Threat of substitutes - Impact of key factors in 2025 and 2030

7.6 Threat of rivalry

Threat of rivalry - Impact of key factors in 2025 and 2030

7.7 Market condition

Chart on Market condition - Five forces 2025 and 2030

8. Market Segmentation by Product

8.1 Market segments

Chart on Product - Market share 2025-2030 (%)
Data Table on Product - Market share 2025-2030 (%)

8.2 Comparison by Product

Chart on Comparison by Product
Data Table on Comparison by Product

8.3 Single axis tracker - Market size and forecast 2025-2030

Chart on Single axis tracker - Market size and forecast 2025-2030 ($ million)
Data Table on Single axis tracker - Market size and forecast 2025-2030 ($ million)
Chart on Single axis tracker - Year-over-year growth 2025-2030 (%)
Data Table on Single axis tracker - Year-over-year growth 2025-2030 (%)

8.4 Dual axis trackers - Market size and forecast 2025-2030

Chart on Dual axis trackers - Market size and forecast 2025-2030 ($ million)
Data Table on Dual axis trackers - Market size and forecast 2025-2030 ($ million)
Chart on Dual axis trackers - Year-over-year growth 2025-2030 (%)
Data Table on Dual axis trackers - Year-over-year growth 2025-2030 (%)

8.5 Market opportunity by Product

Market opportunity by Product ($ million)
Data Table on Market opportunity by Product ($ million)

9. Market Segmentation by Technology

9.1 Market segments

Chart on Technology - Market share 2025-2030 (%)
Data Table on Technology - Market share 2025-2030 (%)

9.2 Comparison by Technology

Chart on Comparison by Technology
Data Table on Comparison by Technology

9.3 Solar PV - Market size and forecast 2025-2030

Chart on Solar PV - Market size and forecast 2025-2030 ($ million)
Data Table on Solar PV - Market size and forecast 2025-2030 ($ million)
Chart on Solar PV - Year-over-year growth 2025-2030 (%)
Data Table on Solar PV - Year-over-year growth 2025-2030 (%)

9.4 CSP - Market size and forecast 2025-2030

Chart on CSP - Market size and forecast 2025-2030 ($ million)
Data Table on CSP - Market size and forecast 2025-2030 ($ million)
Chart on CSP - Year-over-year growth 2025-2030 (%)
Data Table on CSP - Year-over-year growth 2025-2030 (%)

9.5 Market opportunity by Technology

Market opportunity by Technology ($ million)
Data Table on Market opportunity by Technology ($ million)

10. Market Segmentation by Application

10.1 Market segments

Chart on Application - Market share 2025-2030 (%)
Data Table on Application - Market share 2025-2030 (%)

10.2 Comparison by Application

Chart on Comparison by Application
Data Table on Comparison by Application

10.3 Utility - Market size and forecast 2025-2030

Chart on Utility - Market size and forecast 2025-2030 ($ million)
Data Table on Utility - Market size and forecast 2025-2030 ($ million)
Chart on Utility - Year-over-year growth 2025-2030 (%)
Data Table on Utility - Year-over-year growth 2025-2030 (%)

10.4 Commercial - Market size and forecast 2025-2030

Chart on Commercial - Market size and forecast 2025-2030 ($ million)
Data Table on Commercial - Market size and forecast 2025-2030 ($ million)
Chart on Commercial - Year-over-year growth 2025-2030 (%)
Data Table on Commercial - Year-over-year growth 2025-2030 (%)

10.5 Residential - Market size and forecast 2025-2030

Chart on Residential - Market size and forecast 2025-2030 ($ million)
Data Table on Residential - Market size and forecast 2025-2030 ($ million)
Chart on Residential - Year-over-year growth 2025-2030 (%)
Data Table on Residential - Year-over-year growth 2025-2030 (%)

10.6 Market opportunity by Application

Market opportunity by Application ($ million)
Data Table on Market opportunity by Application ($ million)

11. Customer Landscape

11.1 Customer landscape overview

Analysis of price sensitivity, lifecycle, customer purchase basket, adoption rates, and purchase criteria

12. Geographic Landscape

12.1 Geographic segmentation

Chart on Market share by geography 2025-2030 (%)
Data Table on Market share by geography 2025-2030 (%)

12.2 Geographic comparison

Chart on Geographic comparison
Data Table on Geographic comparison

12.3 North America - Market size and forecast 2025-2030

Chart on North America - Market size and forecast 2025-2030 ($ million)
Data Table on North America - Market size and forecast 2025-2030 ($ million)
Chart on North America - Year-over-year growth 2025-2030 (%)
Data Table on North America - Year-over-year growth 2025-2030 (%)
Chart on Regional Comparison - North America
Data Table on Regional Comparison - North America

12.3.1 US - Market size and forecast 2025-2030

Chart on US - Market size and forecast 2025-2030 ($ million)
Data Table on US - Market size and forecast 2025-2030 ($ million)
Chart on US - Year-over-year growth 2025-2030 (%)
Data Table on US - Year-over-year growth 2025-2030 (%)

12.3.2 Canada - Market size and forecast 2025-2030

Chart on Canada - Market size and forecast 2025-2030 ($ million)
Data Table on Canada - Market size and forecast 2025-2030 ($ million)
Chart on Canada - Year-over-year growth 2025-2030 (%)
Data Table on Canada - Year-over-year growth 2025-2030 (%)

12.3.3 Mexico - Market size and forecast 2025-2030

Chart on Mexico - Market size and forecast 2025-2030 ($ million)
Data Table on Mexico - Market size and forecast 2025-2030 ($ million)
Chart on Mexico - Year-over-year growth 2025-2030 (%)
Data Table on Mexico - Year-over-year growth 2025-2030 (%)

12.4 Europe - Market size and forecast 2025-2030

Chart on Europe - Market size and forecast 2025-2030 ($ million)
Data Table on Europe - Market size and forecast 2025-2030 ($ million)
Chart on Europe - Year-over-year growth 2025-2030 (%)
Data Table on Europe - Year-over-year growth 2025-2030 (%)
Chart on Regional Comparison - Europe
Data Table on Regional Comparison - Europe

12.4.1 Germany - Market size and forecast 2025-2030

Chart on Germany - Market size and forecast 2025-2030 ($ million)
Data Table on Germany - Market size and forecast 2025-2030 ($ million)
Chart on Germany - Year-over-year growth 2025-2030 (%)
Data Table on Germany - Year-over-year growth 2025-2030 (%)

12.4.2 UK - Market size and forecast 2025-2030

Chart on UK - Market size and forecast 2025-2030 ($ million)
Data Table on UK - Market size and forecast 2025-2030 ($ million)
Chart on UK - Year-over-year growth 2025-2030 (%)
Data Table on UK - Year-over-year growth 2025-2030 (%)

12.4.3 France - Market size and forecast 2025-2030

Chart on France - Market size and forecast 2025-2030 ($ million)
Data Table on France - Market size and forecast 2025-2030 ($ million)
Chart on France - Year-over-year growth 2025-2030 (%)
Data Table on France - Year-over-year growth 2025-2030 (%)

12.4.4 Spain - Market size and forecast 2025-2030

Chart on Spain - Market size and forecast 2025-2030 ($ million)
Data Table on Spain - Market size and forecast 2025-2030 ($ million)
Chart on Spain - Year-over-year growth 2025-2030 (%)
Data Table on Spain - Year-over-year growth 2025-2030 (%)

12.4.5 Italy - Market size and forecast 2025-2030

Chart on Italy - Market size and forecast 2025-2030 ($ million)
Data Table on Italy - Market size and forecast 2025-2030 ($ million)
Chart on Italy - Year-over-year growth 2025-2030 (%)
Data Table on Italy - Year-over-year growth 2025-2030 (%)

12.4.6 The Netherlands - Market size and forecast 2025-2030

Chart on The Netherlands - Market size and forecast 2025-2030 ($ million)
Data Table on The Netherlands - Market size and forecast 2025-2030 ($ million)
Chart on The Netherlands - Year-over-year growth 2025-2030 (%)
Data Table on The Netherlands - Year-over-year growth 2025-2030 (%)

12.5 APAC - Market size and forecast 2025-2030

Chart on APAC - Market size and forecast 2025-2030 ($ million)
Data Table on APAC - Market size and forecast 2025-2030 ($ million)
Chart on APAC - Year-over-year growth 2025-2030 (%)
Data Table on APAC - Year-over-year growth 2025-2030 (%)
Chart on Regional Comparison - APAC
Data Table on Regional Comparison - APAC

12.5.1 China - Market size and forecast 2025-2030

Chart on China - Market size and forecast 2025-2030 ($ million)
Data Table on China - Market size and forecast 2025-2030 ($ million)
Chart on China - Year-over-year growth 2025-2030 (%)
Data Table on China - Year-over-year growth 2025-2030 (%)

12.5.2 India - Market size and forecast 2025-2030

Chart on India - Market size and forecast 2025-2030 ($ million)
Data Table on India - Market size and forecast 2025-2030 ($ million)
Chart on India - Year-over-year growth 2025-2030 (%)
Data Table on India - Year-over-year growth 2025-2030 (%)

12.5.3 Japan - Market size and forecast 2025-2030

Chart on Japan - Market size and forecast 2025-2030 ($ million)
Data Table on Japan - Market size and forecast 2025-2030 ($ million)
Chart on Japan - Year-over-year growth 2025-2030 (%)
Data Table on Japan - Year-over-year growth 2025-2030 (%)

12.5.4 South Korea - Market size and forecast 2025-2030

Chart on South Korea - Market size and forecast 2025-2030 ($ million)
Data Table on South Korea - Market size and forecast 2025-2030 ($ million)
Chart on South Korea - Year-over-year growth 2025-2030 (%)
Data Table on South Korea - Year-over-year growth 2025-2030 (%)

12.5.5 Australia - Market size and forecast 2025-2030

Chart on Australia - Market size and forecast 2025-2030 ($ million)
Data Table on Australia - Market size and forecast 2025-2030 ($ million)
Chart on Australia - Year-over-year growth 2025-2030 (%)
Data Table on Australia - Year-over-year growth 2025-2030 (%)

12.5.6 Indonesia - Market size and forecast 2025-2030

Chart on Indonesia - Market size and forecast 2025-2030 ($ million)
Data Table on Indonesia - Market size and forecast 2025-2030 ($ million)
Chart on Indonesia - Year-over-year growth 2025-2030 (%)
Data Table on Indonesia - Year-over-year growth 2025-2030 (%)

12.6 South America - Market size and forecast 2025-2030

Chart on South America - Market size and forecast 2025-2030 ($ million)
Data Table on South America - Market size and forecast 2025-2030 ($ million)
Chart on South America - Year-over-year growth 2025-2030 (%)
Data Table on South America - Year-over-year growth 2025-2030 (%)
Chart on Regional Comparison - South America
Data Table on Regional Comparison - South America

12.6.1 Brazil - Market size and forecast 2025-2030

Chart on Brazil - Market size and forecast 2025-2030 ($ million)
Data Table on Brazil - Market size and forecast 2025-2030 ($ million)
Chart on Brazil - Year-over-year growth 2025-2030 (%)
Data Table on Brazil - Year-over-year growth 2025-2030 (%)

12.6.2 Argentina - Market size and forecast 2025-2030

Chart on Argentina - Market size and forecast 2025-2030 ($ million)
Data Table on Argentina - Market size and forecast 2025-2030 ($ million)
Chart on Argentina - Year-over-year growth 2025-2030 (%)
Data Table on Argentina - Year-over-year growth 2025-2030 (%)

12.6.3 Colombia - Market size and forecast 2025-2030

Chart on Colombia - Market size and forecast 2025-2030 ($ million)
Data Table on Colombia - Market size and forecast 2025-2030 ($ million)
Chart on Colombia - Year-over-year growth 2025-2030 (%)
Data Table on Colombia - Year-over-year growth 2025-2030 (%)

12.7 Middle East and Africa - Market size and forecast 2025-2030

Chart on Middle East and Africa - Market size and forecast 2025-2030 ($ million)
Data Table on Middle East and Africa - Market size and forecast 2025-2030 ($ million)
Chart on Middle East and Africa - Year-over-year growth 2025-2030 (%)
Data Table on Middle East and Africa - Year-over-year growth 2025-2030 (%)
Chart on Regional Comparison - Middle East and Africa
Data Table on Regional Comparison - Middle East and Africa

12.7.1 Saudi Arabia - Market size and forecast 2025-2030

Chart on Saudi Arabia - Market size and forecast 2025-2030 ($ million)
Data Table on Saudi Arabia - Market size and forecast 2025-2030 ($ million)
Chart on Saudi Arabia - Year-over-year growth 2025-2030 (%)
Data Table on Saudi Arabia - Year-over-year growth 2025-2030 (%)

12.7.2 UAE - Market size and forecast 2025-2030

Chart on UAE - Market size and forecast 2025-2030 ($ million)
Data Table on UAE - Market size and forecast 2025-2030 ($ million)
Chart on UAE - Year-over-year growth 2025-2030 (%)
Data Table on UAE - Year-over-year growth 2025-2030 (%)

12.7.3 South Africa - Market size and forecast 2025-2030

Chart on South Africa - Market size and forecast 2025-2030 ($ million)
Data Table on South Africa - Market size and forecast 2025-2030 ($ million)
Chart on South Africa - Year-over-year growth 2025-2030 (%)
Data Table on South Africa - Year-over-year growth 2025-2030 (%)

12.7.4 Israel - Market size and forecast 2025-2030

Chart on Israel - Market size and forecast 2025-2030 ($ million)
Data Table on Israel - Market size and forecast 2025-2030 ($ million)
Chart on Israel - Year-over-year growth 2025-2030 (%)
Data Table on Israel - Year-over-year growth 2025-2030 (%)

12.7.5 Turkey - Market size and forecast 2025-2030

Chart on Turkey - Market size and forecast 2025-2030 ($ million)
Data Table on Turkey - Market size and forecast 2025-2030 ($ million)
Chart on Turkey - Year-over-year growth 2025-2030 (%)
Data Table on Turkey - Year-over-year growth 2025-2030 (%)

12.8 Market opportunity by geography

Market opportunity by geography ($ million)
Data Tables on Market opportunity by geography ($ million)

13. Drivers, Challenges, and Opportunity

13.1 Market drivers

Rise in investments in renewable energy
Increasing government support for manufacturing and installing PV systems
Declining cost of solar energy

13.2 Market challenges

Intermittency in solar power generation
Competition from alternative sources of energy
Complex and time-consuming installation process of solar PV trackers

13.3 Impact of drivers and challenges

Impact of drivers and challenges in 2025 and 2030

13.4 Market opportunities

Increasing conversion efficiency of solar PVs
Emergence of smart cities
Slowdown in coal power investment

14. Competitive Landscape

14.1 Overview

14.2

Overview on criticality of inputs and factors of differentiation

14.3 Landscape disruption

Overview on factors of disruption

14.4 Industry risks

Impact of key risks on business

15. Competitive Analysis

15.1 Companies profiled

Companies covered

15.2 Company ranking index

15.3 Market positioning of companies

Matrix on companies position and classification

15.4 All Earth Renewables

All Earth Renewables - Overview
All Earth Renewables - Product / Service
All Earth Renewables - Key offerings
SWOT

15.5 ArcelorMittal SA

ArcelorMittal SA - Overview
ArcelorMittal SA - Business segments
ArcelorMittal SA - Key news
ArcelorMittal SA - Key offerings
ArcelorMittal SA - Segment focus
SWOT

15.6 Arctech Solar

Arctech Solar - Overview
Arctech Solar - Product / Service
Arctech Solar - Key offerings
SWOT

15.7 Array Technologies Inc.

Array Technologies Inc. - Overview
Array Technologies Inc. - Product / Service
Array Technologies Inc. - Key offerings
SWOT

15.8 First Solar Inc.

First Solar Inc. - Overview
First Solar Inc. - Business segments
First Solar Inc. - Key news
First Solar Inc. - Key offerings
First Solar Inc. - Segment focus
SWOT

15.9 Flex Ltd.

Flex Ltd. - Overview
Flex Ltd. - Business segments
Flex Ltd. - Key offerings
Flex Ltd. - Segment focus
SWOT

15.10 Grupo Gransolar SL

Grupo Gransolar SL - Overview
Grupo Gransolar SL - Product / Service
Grupo Gransolar SL - Key offerings
SWOT

15.11 IDEEMATEC Germany GmbH

IDEEMATEC Germany GmbH - Overview
IDEEMATEC Germany GmbH - Product / Service
IDEEMATEC Germany GmbH - Key offerings
SWOT

15.12 Mahindra and Mahindra Ltd.

Mahindra and Mahindra Ltd. - Overview
Mahindra and Mahindra Ltd. - Business segments
Mahindra and Mahindra Ltd. - Key news
Mahindra and Mahindra Ltd. - Key offerings
Mahindra and Mahindra Ltd. - Segment focus
SWOT

15.13 NOV Inc.

NOV Inc. - Overview
NOV Inc. - Business segments
NOV Inc. - Key news
NOV Inc. - Key offerings
NOV Inc. - Segment focus
SWOT

15.14 Soltec Energias Renovables SL

Soltec Energias Renovables SL - Overview
Soltec Energias Renovables SL - Product / Service
Soltec Energias Renovables SL - Key offerings
SWOT

15.15 Sun Action Trackers LLC

Sun Action Trackers LLC - Overview
Sun Action Trackers LLC - Product / Service
Sun Action Trackers LLC - Key offerings
SWOT

15.16 SunPower Corp.

SunPower Corp. - Overview
SunPower Corp. - Product / Service
SunPower Corp. - Key news
SunPower Corp. - Key offerings
SWOT

15.17 Trina Solar Co. Ltd.

Trina Solar Co. Ltd. - Overview
Trina Solar Co. Ltd. - Product / Service
Trina Solar Co. Ltd. - Key news
Trina Solar Co. Ltd. - Key offerings
SWOT

15.18 Valmont Industries Inc.

Valmont Industries Inc. - Overview
Valmont Industries Inc. - Business segments
Valmont Industries Inc. - Key offerings
Valmont Industries Inc. - Segment focus
SWOT

16. Appendix

16.1 Scope of the report

Market definition
Objectives
Notes and caveats

16.2 Inclusions and exclusions checklist

Inclusions checklist
Exclusions checklist

16.3 Currency conversion rates for US$

16.4 Research methodology

16.5 Data procurement

Information sources

16.6 Data validation

16.7 Validation techniques employed for market sizing

16.8 Data synthesis

16.9 360 degree market analysis

16.10 List of abbreviations

Research Methodology

Technavio presents a detailed picture of the market by way of study, synthesis, and summation of data from multiple sources. The analysts have presented the various facets of the market with a particular focus on identifying the key industry influencers. The data thus presented is comprehensive, reliable, and the result of extensive research, both primary and secondary.

INFORMATION SOURCES

Primary sources

  • Manufacturers and suppliers
  • Channel partners
  • Industry experts
  • Strategic decision makers

Secondary sources

  • Industry journals and periodicals
  • Government data
  • Financial reports of key industry players
  • Historical data
  • Press releases

DATA ANALYSIS

Data Synthesis

  • Collation of data
  • Estimation of key figures
  • Analysis of derived insights

Data Validation

  • Triangulation with data models
  • Reference against proprietary databases
  • Corroboration with industry experts

REPORT WRITING

Qualitative

  • Market drivers
  • Market challenges
  • Market trends
  • Five forces analysis

Quantitative

  • Market size and forecast
  • Market segmentation
  • Geographical insights
  • Competitive landscape

Interested in this report?

Get your sample now to see our research methodology and insights!

Download Now

Frequently Asked Questions

Solar PV Tracker market growth will increase by USD 21239.7 million during 2026-2030.

The Solar PV Tracker market is expected to grow at a CAGR of 21.9% during 2026-2030.

Solar PV Tracker market is segmented by Product (Single axis tracker, Dual axis trackers) Technology (Solar PV, CSP) Application (Utility, Commercial, Residential)

All Earth Renewables, ArcelorMittal SA, Arctech Solar, Array Technologies Inc., First Solar Inc., Flex Ltd., GameChange Solar, Grupo Gransolar SL, Hanwha Group, Hao solar Co Ltd., IDEEMATEC Germany GmbH, Mahindra and Mahindra Ltd., NOV Inc., Scorpius Trackers Pvt. Ltd., Soltec Energias Renovables SL, Sun Action Trackers LLC, SunPower Corp., Trina Solar Co. Ltd., Valmont Industries Inc. are a few of the key vendors in the Solar PV Tracker market.

North America will register the highest growth rate of 32.8% among the other regions. Therefore, the Solar PV Tracker market in North America is expected to garner significant business opportunities for the vendors during the forecast period.

US, Canada, Mexico, Germany, UK, France, Spain, Italy, The Netherlands, China, India, Japan, South Korea, Australia, Indonesia, Brazil, Argentina, Colombia, Saudi Arabia, UAE, South Africa, Israel, Turkey

  • Rise in investments in renewable energy is the driving factor this market.

The Solar PV Tracker market vendors should focus on grabbing business opportunities from the Product segment as it accounted for the largest market share in the base year.