
US Solar Power Market Size 2026-2030
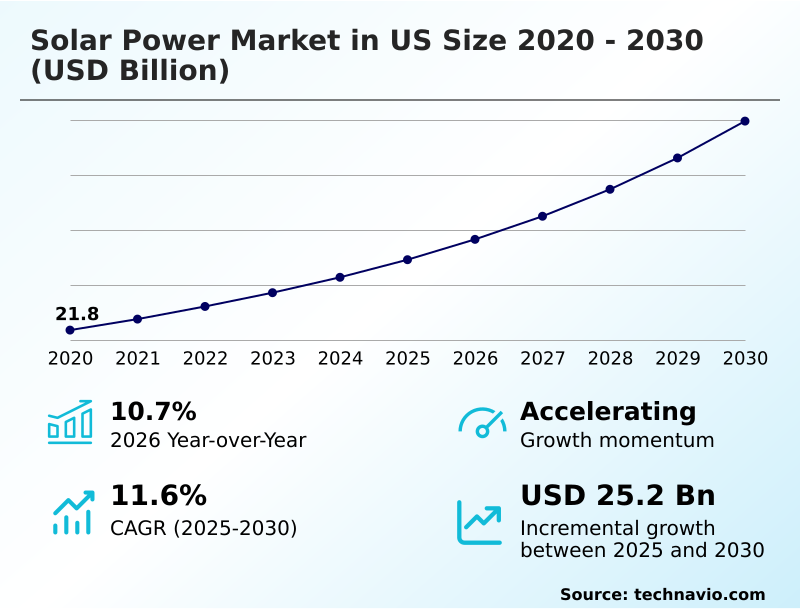
The us solar power market size is valued to increase by USD 25.2 billion, at a CAGR of 11.6% from 2025 to 2030. Federal policy support and domestic manufacturing incentives will drive the us solar power market.
Major Market Trends & Insights
- By Technology - Photovoltaic systems segment was valued at USD 26.7 billion in 2024
- By Application - Utility segment accounted for the largest market revenue share in 2024
Market Size & Forecast
- Market Opportunities: USD 38 billion
- Market Future Opportunities: USD 25.2 billion
- CAGR from 2025 to 2030 : 11.6%
Market Summary
- The solar power market in US is undergoing a significant transformation, driven by a national push toward decarbonization and energy independence. This shift is characterized by rapid advancements in photovoltaic systems and a growing emphasis on creating a robust domestic manufacturing base for components like solar cells.
- The integration of energy storage integration is becoming standard for new utility-scale developments, addressing the intermittency of solar generation and enhancing grid stability. A key business scenario involves developers navigating complex supply chain logistics to meet domestic content requirements for federal incentives, which can reduce project costs by over 10%.
- This requires careful planning to balance component sourcing, tariff exposure, and construction timelines. Challenges such as aging transmission infrastructure and skilled labor shortages persist, but the industry continues to expand through innovative applications like agrivoltaics and the development of virtual power plants, reshaping the nation's energy landscape.
What will be the Size of the US Solar Power Market during the forecast period?
Get Key Insights on Market Forecast (PDF) Request Free Sample
How is the US Solar Power Market Segmented?
The us solar power industry research report provides comprehensive data (region-wise segment analysis), with forecasts and estimates in "USD billion" for the period 2026-2030, as well as historical data from 2020-2024 for the following segments.
- Technology
- Photovoltaic systems
- Concentrated solar power systems
- Application
- Utility
- Residential
- Commercial
- Deployment
- Ground mounted
- Rooftop
- Geography
- North America
- US
- North America
By Technology Insights
The photovoltaic systems segment is estimated to witness significant growth during the forecast period.
The photovoltaic systems segment is advancing through innovations in thin film photovoltaic modules and traditional silicon wafers, driving growth in residential solar, commercial solar, and rooftop solar applications.
The use of high-efficiency solar cells is paramount, with some advanced systems improving energy conversion by over 5% compared to previous generations.
Residential adoption is supported by offerings like integrated solar roofing and solar shingles, while community solar programs expand access for customers without suitable rooftops. The commercial sector leverages large rooftop spaces for onsite generation.
These decentralized approaches are complemented by utility-scale deployments using products like the megapack product for grid balancing services, all contributing to a more distributed and resilient energy landscape with enhanced regenerative land stewardship through community solar.
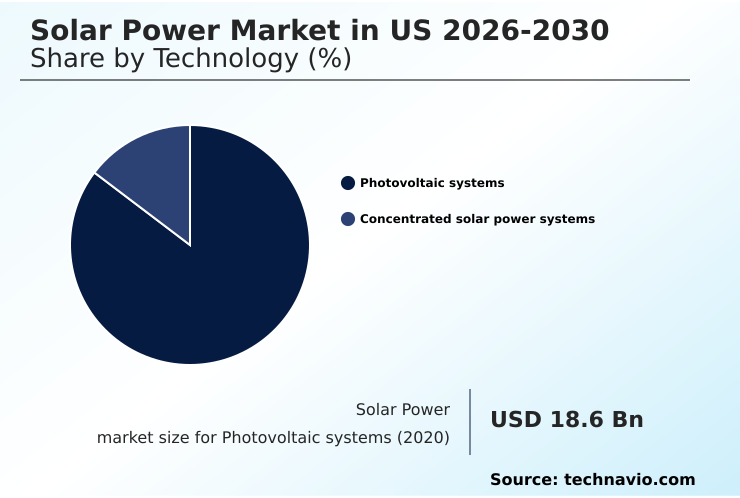
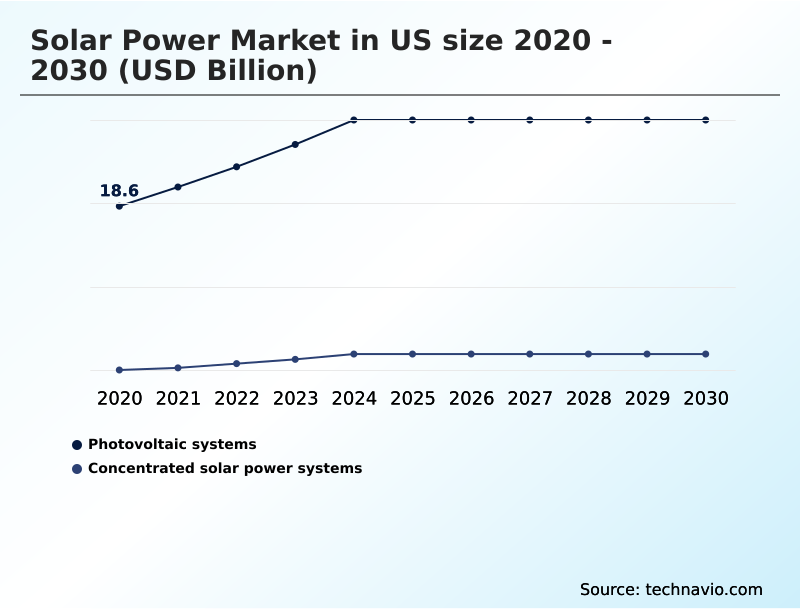
The Photovoltaic systems segment was valued at USD 26.7 billion in 2024 and showed a gradual increase during the forecast period.
Market Dynamics
Our researchers analyzed the data with 2025 as the base year, along with the key drivers, trends, and challenges. A holistic analysis of drivers will help companies refine their marketing strategies to gain a competitive advantage.
- The strategic planning for the solar power market in US involves a comprehensive evaluation of technology, policy, and operational execution. For new developments, the choice between photovoltaic systems for utility scale projects and concentrated solar power with thermal storage depends heavily on regional grid needs and dispatchability requirements.
- Optimizing ground mounted solar farm layouts with solar trackers for enhanced energy production is now standard practice, while commercial entities increasingly favor bifacial modules for commercial applications to maximize output. In the residential sector, rooftop solar with battery backup systems is gaining traction, supported by innovations in residential solar roofing solutions.
- A major catalyst for this growth is the availability of federal tax incentives for solar manufacturing, which encourages the domestic manufacturing of solar components. However, significant hurdles remain, including grid interconnection challenges for renewables and navigating supply chain volatility for solar panels. Addressing skilled labor shortages in solar through targeted training programs for solar technicians is critical for sustaining momentum.
- To de-risk investments, developers are leveraging long-term power purchase agreements for corporate data centers and creating virtual power plants for residential energy networks. Furthermore, community solar programs for commercial rooftops are expanding access to clean energy.
- Projects that integrate high capacity battery storage for solar farms can realize revenue streams from grid services that are over 35% higher than standalone solar assets, underscoring the financial benefits of integrated system design, including the thin film photovoltaic module recycling process.
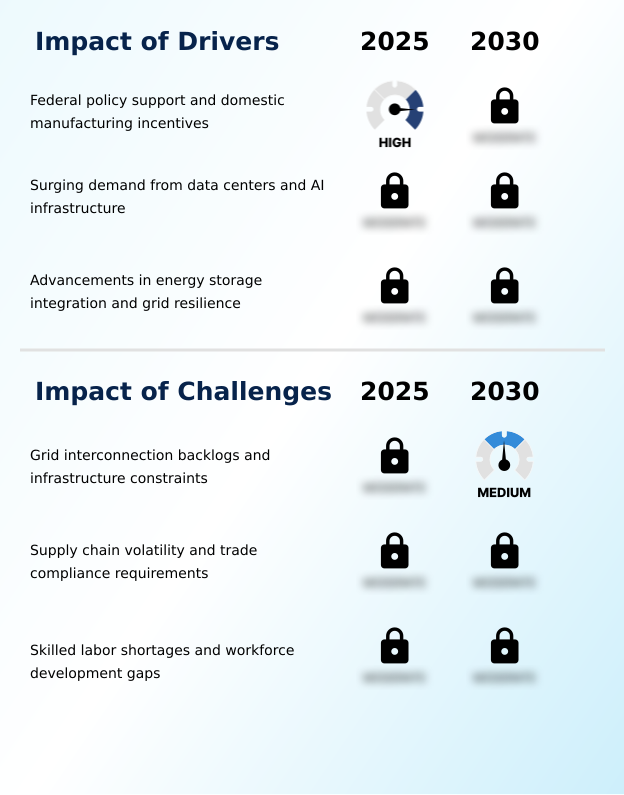
What are the key market drivers leading to the rise in the adoption of US Solar Power Industry?
- Federal policy support and domestic manufacturing incentives are key drivers propelling the growth of the solar power market in US.
- Growth is primarily propelled by strong domestic manufacturing incentives and robust federal policy support, which together have reduced the levelized cost of energy for qualifying projects by an average of 10%.
- The integration of energy storage integration and high-efficiency modules, including advanced bifacial modules, bolsters grid resilience and is crucial for building out renewable energy infrastructure. This has improved reliability, reducing power disruption frequency by 15% in some areas.
- Surging demand from hyperscale customers for data centers is leading to large-scale power purchase agreements.
- The rise of virtual power plants and advanced grid management tools, along with stationary energy storage deployments utilizing advanced manufacturing production tax credits and back contact technology, further accelerates market expansion.
What are the market trends shaping the US Solar Power Industry?
- The integration of large-scale energy storage systems is a key upcoming trend. This is reshaping the market by enhancing grid stability and enabling more reliable power distribution.
- The evolution toward hybrid projects is a defining market trend, integrating battery energy storage systems to create dispatchable clean energy. These systems enhance grid stability through services like frequency regulation, with some achieving over 95% availability during peak demand.
- Another significant shift involves agrivoltaics and dual use land management, where solar trackers with terrain following tracker technology are co-located with agriculture, improving land-use efficiency by up to 60%. Innovations in concentrated solar utilize particle based thermal storage and advanced heliostat fields.
- These modular and flexible designs are expanding deployment possibilities, supported by advancements in semiconductor layers that boost module performance.
What challenges does the US Solar Power Industry face during its growth?
- Grid interconnection backlogs and infrastructure constraints represent a key challenge affecting the growth of the solar power market in US.
- Significant structural challenges persist, led by severe grid interconnection backlogs, with projects in the interconnection queue facing average delays of nearly five years. This issue of transmission expansion is compounded by supply chain vulnerabilities, including antidumping duties and compliance related to foreign entities of concern, which particularly affect upstream segments.
- The high rate of project attrition, sometimes exceeding 70% in congested queues, impacts capital efficiency. Furthermore, a critical shortage of qualified workers, reflecting deep workforce development gaps, increases project labor costs by an estimated 8-12% in high-demand regions.
- These hurdles complicate the establishment of a fully localized supply chain and increase the complexity of agreements with energy offtakers, while also delaying the development of infrastructure for solar panel recycling of crystalline silicon alternatives.
Exclusive Technavio Analysis on Customer Landscape
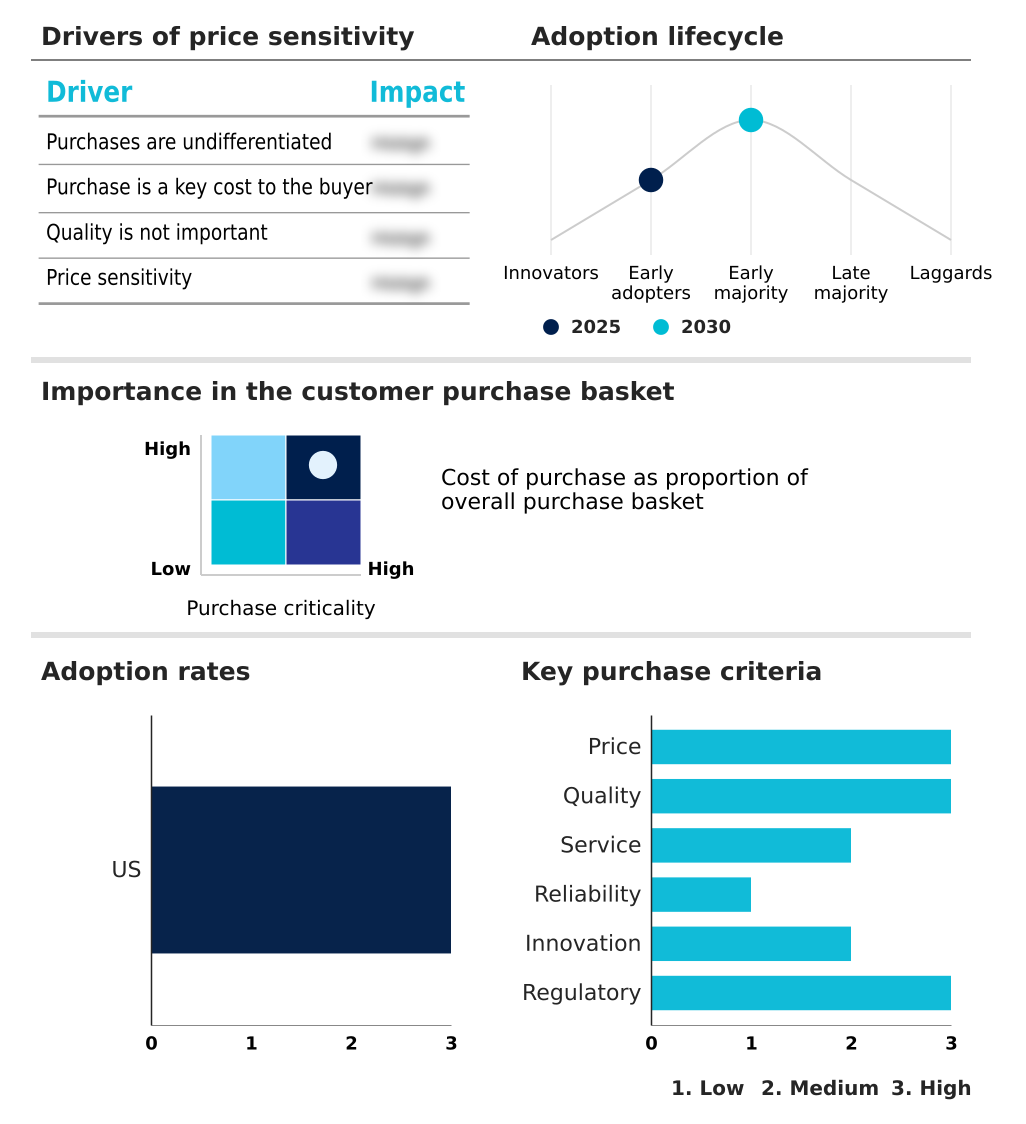
The us solar power market forecasting report includes the adoption lifecycle of the market, covering from the innovator’s stage to the laggard’s stage. It focuses on adoption rates in different regions based on penetration. Furthermore, the us solar power market report also includes key purchase criteria and drivers of price sensitivity to help companies evaluate and develop their market growth analysis strategies.
Customer Landscape of US Solar Power Industry
Competitive Landscape
Companies are implementing various strategies, such as strategic alliances, us solar power market forecast, partnerships, mergers and acquisitions, geographical expansion, and product/service launches, to enhance their presence in the industry.
Array Technologies Inc. - Specializes in solar power tracking solutions and trackers designed to maximize energy production and efficiency for large-scale projects.
The industry research and growth report includes detailed analyses of the competitive landscape of the market and information about key companies, including:
- Array Technologies Inc.
- Avantus LLC
- Black and Veatch Holding Co.
- Canadian Solar Inc.
- GAF Materials LLC
- Invenergy
- Koch Engineered Solutions
- Leeward Renewable Energy LLC
- MAG Energy
- Mission Solar Energy
- Moss and Associates LLC
- Primoris Services Corp.
- Renewable Energy Systems Ltd.
- Signal Energy
- Silicon Ranch Corp
- Strata Clean Energy
- Suniva Inc.
- SunPower Corp.
- TE Connectivity plc
- Topsoes AS
Qualitative and quantitative analysis of companies has been conducted to help clients understand the wider business environment as well as the strengths and weaknesses of key industry players. Data is qualitatively analyzed to categorize companies as pure play, category-focused, industry-focused, and diversified; it is quantitatively analyzed to categorize companies as dominant, leading, strong, tentative, and weak.
Recent Development and News in Us solar power market
- In August 2024, Avantus announced the start of construction for the 159-megawatt Norton Solar Project in Texas, which was sold to Toyota Tsusho America.
- In October 2024, SB Energy announced that its Orion 1, 2, and 3 solar farms, totaling 900 megawatts, reached commercial operation in Texas to supply power to Google's data centers.
- In January 2025, Array Technologies announced it will supply its solar tracking systems with 100% domestic content for the 200-megawatt Emerald Green Solar project in Indiana.
- In May 2025, Silfab announced the monetization of $110 million in advanced manufacturing production tax credits to fund its expansion of solar module and cell production in the US.
Dive into Technavio’s robust research methodology, blending expert interviews, extensive data synthesis, and validated models for unparalleled US Solar Power Market insights. See full methodology.
| Market Scope | |
|---|---|
| Page number | 175 |
| Base year | 2025 |
| Historic period | 2020-2024 |
| Forecast period | 2026-2030 |
| Growth momentum & CAGR | Accelerate at a CAGR of 11.6% |
| Market growth 2026-2030 | USD 25.2 billion |
| Market structure | Fragmented |
| YoY growth 2025-2026(%) | 10.7% |
| Key countries | US |
| Competitive landscape | Leading Companies, Market Positioning of Companies, Competitive Strategies, and Industry Risks |
Research Analyst Overview
- The solar power market in US is characterized by a dynamic interplay between technological advancement and policy-driven industrial strategy. A pivotal trend is the aggressive supply chain reshoring, compelling boardroom decisions around capital expenditure for new domestic facilities versus navigating the complexities of antidumping duties on imported solar cells and silicon wafers.
- Meeting the 40% domestic content requirement to unlock key domestic manufacturing incentives has become a central financial and operational focus. This shift impacts all segments, from utility-scale solar projects utilizing ground mounted solar arrays and concentrated solar power systems to residential solar and commercial solar installations using rooftop solar.
- The development of renewable energy infrastructure relies on photovoltaic systems, solar trackers, and energy storage integration to ensure grid resilience, while bifacial modules and thin film photovoltaic modules enhance output.
- However, growth is tempered by grid interconnection backlogs, skilled labor shortages, and challenges in upstream segments, requiring a holistic approach to expansion that addresses the entire value chain, including transmission expansion and the interconnection queue.
What are the Key Data Covered in this US Solar Power Market Research and Growth Report?
-
What is the expected growth of the US Solar Power Market between 2026 and 2030?
-
USD 25.2 billion, at a CAGR of 11.6%
-
-
What segmentation does the market report cover?
-
The report is segmented by Technology (Photovoltaic systems, and Concentrated solar power systems), Application (Utility, Residential, and Commercial), Deployment (Ground mounted, and Rooftop) and Geography (North America)
-
-
Which regions are analyzed in the report?
-
North America
-
-
What are the key growth drivers and market challenges?
-
Federal policy support and domestic manufacturing incentives, Grid interconnection backlogs and infrastructure constraints
-
-
Who are the major players in the US Solar Power Market?
-
Array Technologies Inc., Avantus LLC, Black and Veatch Holding Co., Canadian Solar Inc., GAF Materials LLC, Invenergy, Koch Engineered Solutions, Leeward Renewable Energy LLC, MAG Energy, Mission Solar Energy, Moss and Associates LLC, Primoris Services Corp., Renewable Energy Systems Ltd., Signal Energy, Silicon Ranch Corp, Strata Clean Energy, Suniva Inc., SunPower Corp., TE Connectivity plc and Topsoes AS
-
Market Research Insights
- The market is shaped by a convergence of technological innovation and shifting demand patterns. The rise of hyperscale customers has accelerated the deployment of utility-scale projects, with advanced grid management tools reducing curtailment events by 15% in certain regions. The adoption of a storage-first approach, particularly in the residential sector, is leading to the formation of virtual power plants.
- These networks have improved local grid resilience, decreasing outage recovery times by over 20%. The use of advanced manufacturing production tax credits is stimulating a localized supply chain, while the development of high-efficiency modules with back contact technology offers better long-term returns. Stationary energy storage deployments are increasingly critical for providing grid balancing services and ensuring a stable power supply.
We can help! Our analysts can customize this us solar power market research report to meet your requirements.
 RIA -
RIA - 
