Solar Batteries Market Analysis, Size, and Forecast 2026-2030: APAC (China, Australia, and Japan), North America (US, Canada, and Mexico), Europe (Germany, UK, and Italy), Middle East and Africa (South Africa, UAE, and Saudi Arabia), South America (Brazil and Argentina), and Rest of World (ROW)

Solar Batteries Market Analysis, Size, and Forecast 2026-2030:
APAC (China, Australia, and Japan), North America (US, Canada, and Mexico), Europe (Germany, UK, and Italy), Middle East and Africa (South Africa, UAE, and Saudi Arabia), South America (Brazil and Argentina), and Rest of World (ROW)

Published: Jan 2026 295 Pages SKU: IRTNTR74096

Market Overview at a Glance

$7.30 B
Market Opportunity
12.3%
CAGR 2025 - 2030
39%
APAC Growth
$4.16 B
Li-ion segment 2024

Solar Batteries Market Size 2026-2030

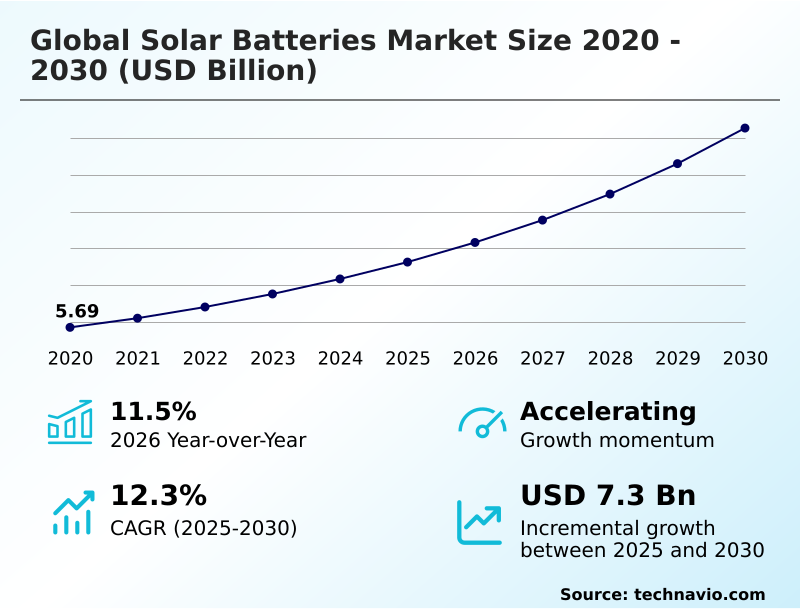
The solar batteries market size is valued to increase by USD 7.30 billion, at a CAGR of 12.3% from 2025 to 2030. Proliferation of supportive policies and financial incentives will drive the solar batteries market.

Major Market Trends & Insights

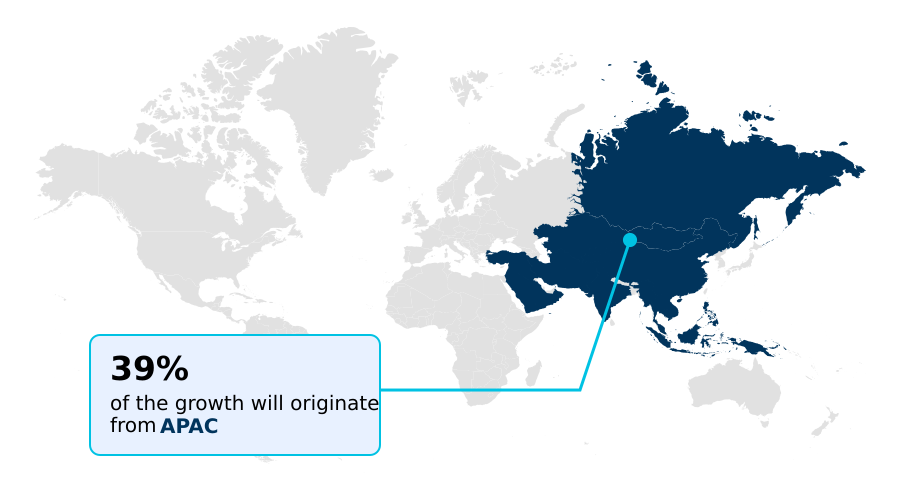
  • APAC dominated the market and accounted for a 39% growth during the forecast period.
  • By Technology - Li-ion segment was valued at USD 4.16 billion in 2024
  • By End-user - Industrial segment accounted for the largest market revenue share in 2024

Market Size & Forecast

  • Market Opportunities: USD 10.87 billion
  • Market Future Opportunities: USD 7.30 billion
  • CAGR from 2025 to 2030 : 12.3%

Market Summary

  • The solar batteries market is undergoing a critical transformation, evolving from a niche backup power solution into an essential component of modern energy infrastructure. This expansion is propelled by the urgent need for grid stabilization amid the increasing penetration of intermittent renewable sources. Technological advancements are central to this evolution, with a decisive shift toward safer and more durable chemistries.
  • Concurrently, the integration of artificial intelligence into energy management platforms is enabling sophisticated optimization of battery performance, maximizing economic returns for asset owners. However, the industry grapples with significant challenges, including supply chain volatility, which complicates project timelines and cost structures.
  • For instance, a commercial facility can leverage an intelligent solar-plus-storage system to execute automated peak shaving, drawing from the battery during high-cost tariff periods to reduce operational energy expenditures by a significant margin.
  • This dynamic illustrates the convergence of technology, economics, and regulatory frameworks shaping the deployment of energy storage solutions worldwide, making them indispensable for achieving both energy independence and decarbonization goals.

What will be the Size of the Solar Batteries Market during the forecast period?

Get Key Insights on Market Forecast (PDF) Request Free Sample

How is the Solar Batteries Market Segmented?

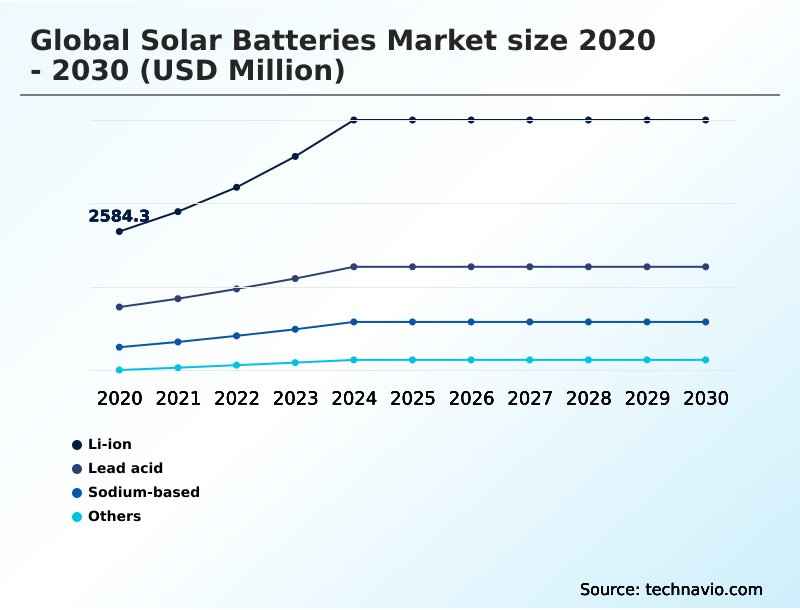
The solar batteries industry research report provides comprehensive data (region-wise segment analysis), with forecasts and estimates in "USD million" for the period 2026-2030, as well as historical data from 2020-2024 for the following segments.

  • Technology
    • Li-ion
    • Lead acid
    • Sodium-based
    • Others
  • End-user
    • Industrial
    • Commercial
    • Residential
  • Capacity
    • Below 10 kWh
    • Between 10 to 50 kWh
    • Above 50 kWh
  • Geography
    • APAC
      • China
      • Australia
      • Japan
    • North America
      • US
      • Canada
      • Mexico
    • Europe
      • Germany
      • UK
      • Italy
    • Middle East and Africa
      • South Africa
      • UAE
      • Saudi Arabia
    • South America
      • Brazil
      • Argentina
    • Rest of World (ROW)

By Technology Insights

The li-ion segment is estimated to witness significant growth during the forecast period.

The Li-ion segment commands a dominant position, underpinned by its high energy density and decreasing costs. A notable shift is occurring toward lithium iron phosphate (LFP) chemistries, favored for their enhanced safety and longer lifecycles in stationary solar-plus-storage systems.

This preference is particularly strong in grid-scale energy storage and long-duration energy storage applications where stability is paramount. The integration of advanced battery management systems (BMS) further optimizes performance and lifespan.

However, the segment is not immune to economic pressures, as import tariffs on specific chemistries have driven up project costs by over 50% in certain markets, influencing procurement strategies and altering the financial models for large-scale deployments.

Request Free Sample

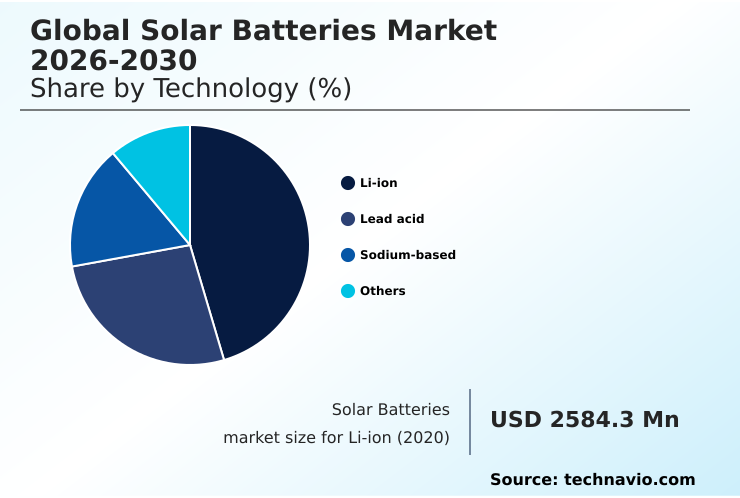
The Li-ion segment was valued at USD 4.16 billion in 2024 and showed a gradual increase during the forecast period.

Request Free Sample

Regional Analysis

APAC is estimated to contribute 39% to the growth of the global market during the forecast period.Technavio’s analysts have elaborately explained the regional trends and drivers that shape the market during the forecast period.

See How Solar Batteries Market Demand is Rising in APAC Request Free Sample

The geographic landscape of the solar batteries market is characterized by diverse regional dynamics and growth trajectories.

APAC is projected to contribute nearly 39% of the market's incremental growth, driven by extensive manufacturing capabilities and ambitious renewable energy targets in countries like China.

In North America, regulatory support and the necessity for grid resilience are fueling rapid deployment, with over 18 gigawatts of new utility-scale battery energy storage systems (BESS) anticipated to come online in a single year.

Europe maintains its focus on energy security, with significant investments in flow batteries and commercial energy storage to support its decarbonization goals.

Across these regions, the emphasis is on enhancing grid stability services and developing alternative technologies like solid-state batteries to move beyond traditional nickel manganese cobalt (NMC) chemistries.

Market Dynamics

Our researchers analyzed the data with 2025 as the base year, along with the key drivers, trends, and challenges. A holistic analysis of drivers will help companies refine their marketing strategies to gain a competitive advantage.

  • Strategic decision-making in the solar batteries market now involves nuanced technical and economic trade-offs. The process of comparing lfp and nmc for solar applications requires balancing the superior safety and longevity of Lithium Iron Phosphate against the higher energy density of Nickel Manganese Cobalt chemistries.
  • Concurrently, the emergence of sodium-ion battery for residential solar presents a compelling alternative, mitigating concerns around raw material price volatility and supply chain constraints. For asset owners, optimizing solar battery life with AI has become critical for maximizing return on investment, with advanced algorithms extending operational lifespans by up to 15% compared to static control systems.
  • This is particularly relevant when integrating solar batteries with EV charging, a use case that places significant demands on the system. To accommodate this, modular solar battery system expansion is becoming a standard feature, allowing users to scale their storage capacity in line with their evolving energy needs.
  • The ability to seamlessly expand a system is a key factor in future-proofing residential and commercial energy investments, ensuring long-term viability.

What are the key market drivers leading to the rise in the adoption of Solar Batteries Industry?

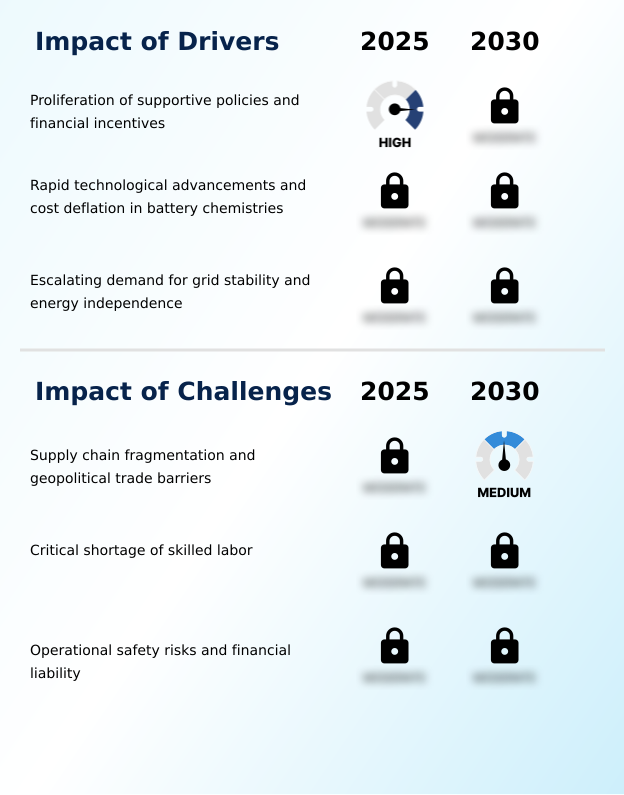
  • The proliferation of supportive policies and financial incentives serves as a key driver for market growth.

  • Market expansion is heavily driven by supportive government policies and the rapid pace of technological innovation, which together improve the economic viability of storage solutions.
  • Government incentives, including aid packages exceeding EUR 800 million in some regions, are critical for de-risking private investment in utility-scale applications and behind-the-meter storage.
  • Concurrently, technological breakthroughs are lowering the levelized cost of storage (LCOS) and extending asset lifecycles, with new systems demonstrating zero degradation for the first five years of operation.
  • This progress enables industrial consumers to implement effective peak shaving capabilities and supports the growth of decentralized energy resources (DERs), fostering greater energy independence solutions for end-users.

What are the market trends shaping the Solar Batteries Industry?

  • A key market trend is the diversification of battery chemistries beyond lithium-ion. The rise of sodium-ion technology is emerging as a significant development.

  • Key market trends are reshaping the competitive landscape, led by the commercialization of alternative technologies such as sodium-ion battery chemistry. This shift allows for greater supply chain stability compared to lithium-based options. Another significant trend is the institutionalization of virtual power plants (VPPs), which aggregate distributed residential energy storage assets into dispatchable grid resources.
  • These networks enable participation in demand response programs, allowing homeowners to monetize their systems by reacting to complex time-of-use (TOU) tariffs. The integration of advanced energy management systems (EMS) is central to this model, with some platforms allowing over 50,000 users to automatically bid stored energy into wholesale markets.
  • This software-driven approach is improving asset utilization by more than 20% in certain programs.

What challenges does the Solar Batteries Industry face during its growth?

  • Supply chain fragmentation and geopolitical trade barriers represent a key challenge affecting industry growth.

  • The market faces considerable headwinds from supply chain disruptions and operational risks. The imposition of new trade tariffs has increased the landed cost of key battery components, including deep-cycle batteries and advanced lead-acid battery alternatives, by over 50% in certain key markets.
  • Concurrently, safety remains a paramount concern, as incidents can trigger immediate double-digit percentage increases in insurance premiums, impacting project profitability. These challenges are compelling the industry to focus on designs with robust thermal runaway protection and to adopt circular economy principles to secure material supply.
  • Furthermore, a shortage of skilled labor complicates the installation of systems featuring newer technologies like DC-coupled architecture, creating project delays and increasing costs.

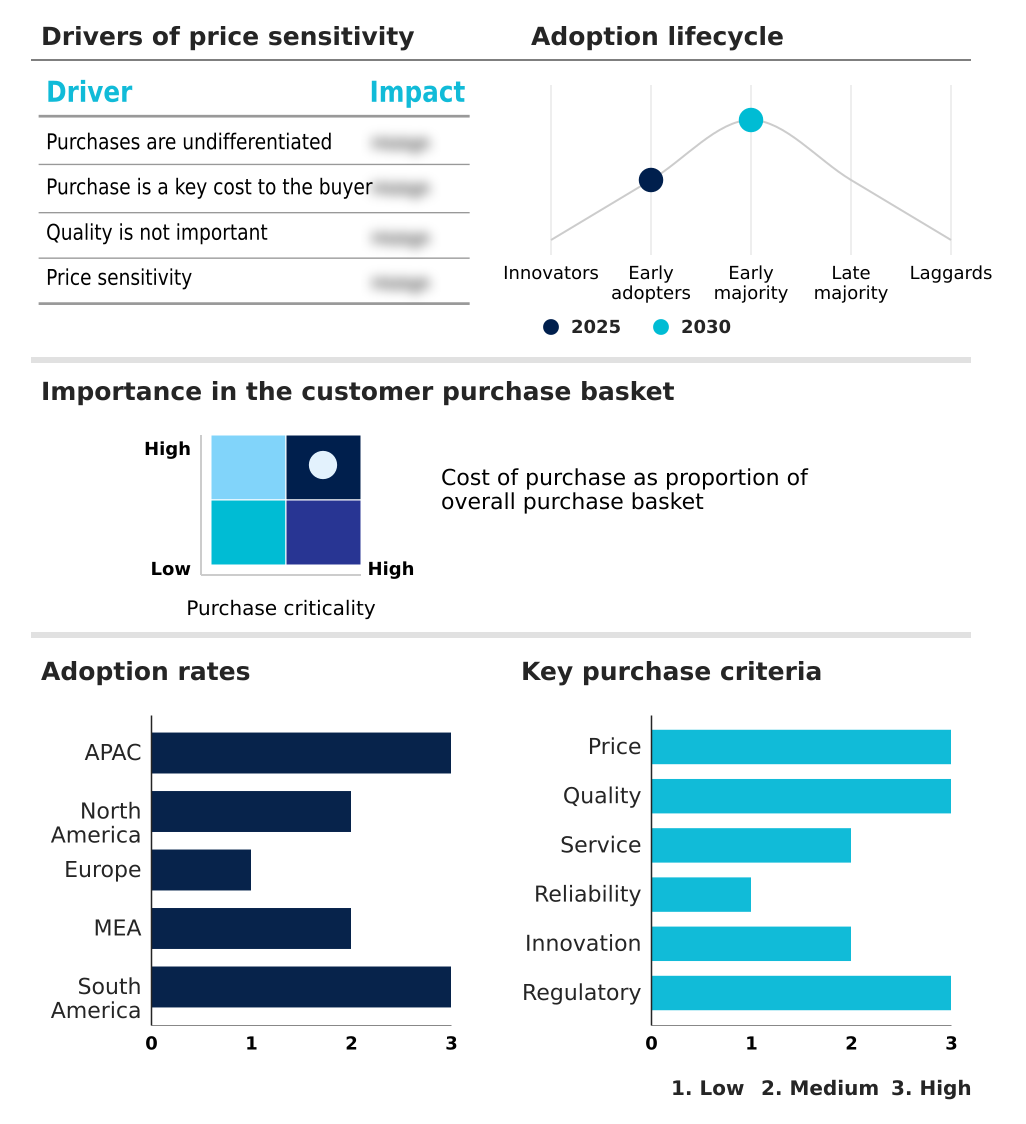
Exclusive Technavio Analysis on Customer Landscape

The solar batteries market forecasting report includes the adoption lifecycle of the market, covering from the innovator’s stage to the laggard’s stage. It focuses on adoption rates in different regions based on penetration. Furthermore, the solar batteries market report also includes key purchase criteria and drivers of price sensitivity to help companies evaluate and develop their market growth analysis strategies.

Customer Landscape of Solar Batteries Industry

Competitive Landscape

Companies are implementing various strategies, such as strategic alliances, solar batteries market forecast, partnerships, mergers and acquisitions, geographical expansion, and product/service launches, to enhance their presence in the industry.

A123 Systems LLC - Analysis indicates a focus on providing advanced lithium-ion phosphate cells, engineered for high-performance energy storage and power delivery applications across multiple sectors.

The industry research and growth report includes detailed analyses of the competitive landscape of the market and information about key companies, including:

  • A123 Systems LLC
  • Alpha ESS Co.Ltd.
  • BYD Co. Ltd.
  • Contemporary Amperex Ltd.
  • East Penn Manufacture Co. Inc.
  • EnerSys
  • Exide Industries Ltd.
  • GS Yuasa International Ltd.
  • LG Energy Solution Ltd.
  • Loom Solar Pvt. Ltd.
  • Primus Power Solutions
  • Renon Power Technology Inc.
  • Samsung SDI Co. Ltd.
  • SolarEdge Technologies Inc.
  • Sunergy Solar
  • Tesla Inc.

Qualitative and quantitative analysis of companies has been conducted to help clients understand the wider business environment as well as the strengths and weaknesses of key industry players. Data is qualitatively analyzed to categorize companies as pure play, category-focused, industry-focused, and diversified; it is quantitatively analyzed to categorize companies as dominant, leading, strong, tentative, and weak.

Recent Development and News in Solar batteries market

  • In May 2025, Contemporary Amperex Technology Co. Limited launched the TENER Stack, a mass-producible energy storage system featuring zero degradation over the first five years of use.
  • In April 2025, the United States government implemented a sweeping expansion of trade tariffs on battery components of Chinese origin, with duties on some chemistries exceeding 50%.
  • In April 2025, Contemporary Amperex Technology Co. Limited commenced the global distribution of its second-generation sodium-ion battery packs tailored for the residential solar storage sector.
  • In March 2025, the European Commission approved an EUR 826 million aid scheme to support the deployment of energy storage solutions in Spain, aiming to foster the integration of renewables.

Dive into Technavio’s robust research methodology, blending expert interviews, extensive data synthesis, and validated models for unparalleled Solar Batteries Market insights. See full methodology.

Market Scope
Page number 295
Base year 2025
Historic period 2020-2024
Forecast period 2026-2030
Growth momentum & CAGR Accelerate at a CAGR of 12.3%
Market growth 2026-2030 USD 7302.4 million
Market structure Fragmented
YoY growth 2025-2026(%) 11.5%
Key countries China, Australia, Japan, India, South Korea, Indonesia, US, Canada, Mexico, Germany, UK, Italy, France, Spain, The Netherlands, South Africa, UAE, Saudi Arabia, Israel, Egypt, Brazil, Chile and Argentina
Competitive landscape Leading Companies, Market Positioning of Companies, Competitive Strategies, and Industry Risks

Request Free Sample

Research Analyst Overview

  • The solar batteries market has matured beyond simple backup power, now serving as a critical pillar of grid infrastructure through the deployment of grid-scale energy storage and behind-the-meter storage solutions. The sector's trajectory is dictated by continuous innovation in battery chemistry and intelligent system control.
  • At the boardroom level, decisions are increasingly focused on supply chain resilience, prompting a strategic diversification away from conventional chemistries toward alternatives like sodium-ion battery chemistry, flow batteries, and solid-state batteries to mitigate risks associated with raw material volatility.
  • The refinement of technologies such as lithium iron phosphate (LFP) and even advanced absorbent glass mat (AGM) and deep-cycle batteries continues, driven by the need to lower the levelized cost of storage (LCOS).
  • This is happening alongside the integration of sophisticated battery management systems (BMS) and energy management systems (EMS) that offer enhanced thermal runaway protection and enable peak shaving capabilities. The establishment of virtual power plants (VPPs) represents a paradigm shift, transforming distributed assets into dispatchable grid resources.
  • However, geopolitical factors remain a challenge, with new trade policies increasing the landed cost of certain battery components by over 50%, directly impacting project economics.

What are the Key Data Covered in this Solar Batteries Market Research and Growth Report?

  • What is the expected growth of the Solar Batteries Market between 2026 and 2030?

    • USD 7.30 billion, at a CAGR of 12.3%

  • What segmentation does the market report cover?

    • The report is segmented by Technology (Li-ion, Lead acid, Sodium-based, and Others), End-user (Industrial, Commercial, and Residential), Capacity (Below 10 kWh, Between 10 to 50 kWh, and Above 50 kWh) and Geography (APAC, North America, Europe, Middle East and Africa, South America)

  • Which regions are analyzed in the report?

    • APAC, North America, Europe, Middle East and Africa and South America

  • What are the key growth drivers and market challenges?

    • Proliferation of supportive policies and financial incentives, Supply chain fragmentation and geopolitical trade barriers

  • Who are the major players in the Solar Batteries Market?

    • A123 Systems LLC, Alpha ESS Co.Ltd., BYD Co. Ltd., Contemporary Amperex Ltd., East Penn Manufacture Co. Inc., EnerSys, Exide Industries Ltd., GS Yuasa International Ltd., LG Energy Solution Ltd., Loom Solar Pvt. Ltd., Primus Power Solutions, Renon Power Technology Inc., Samsung SDI Co. Ltd., SolarEdge Technologies Inc., Sunergy Solar and Tesla Inc.

Market Research Insights

  • The solar batteries market is shaped by a confluence of technological innovation and evolving grid requirements. The deployment of decentralized energy resources (DERs) is accelerating, with a focus on both residential and commercial energy storage. These solar-plus-storage systems provide critical energy independence solutions.
  • The adoption of advanced battery energy storage systems (BESS) has led to notable efficiency gains, with some DC-coupled architecture designs reducing energy conversion losses by up to 8%. Furthermore, participation in demand response programs, enabled by these systems, can reduce an enterprise's energy costs by over 15% through strategic responses to time-of-use (TOU) tariffs.
  • The market is also moving toward long-duration energy storage to provide enhanced grid stability services.

We can help! Our analysts can customize this solar batteries market research report to meet your requirements.

Get in touch

1. Executive Summary

1.1 Market overview

Executive Summary - Chart on Market Overview
Executive Summary - Data Table on Market Overview
Executive Summary - Chart on Global Market Characteristics
Executive Summary - Chart on Market by Geography
Executive Summary - Chart on Market Segmentation by Technology
Executive Summary - Chart on Market Segmentation by End-user
Executive Summary - Chart on Market Segmentation by Capacity
Executive Summary - Chart on Incremental Growth
Executive Summary - Data Table on Incremental Growth
Executive Summary - Chart on Company Market Positioning

2. Technavio Analysis

2.1 Analysis of price sensitivity, lifecycle, customer purchase basket, adoption rates, and purchase criteria

2.2 Criticality of inputs and Factors of differentiation

Chart on Overview on criticality of inputs and factors of differentiation

2.3 Factors of disruption

Chart on Overview on factors of disruption

2.4 Impact of drivers and challenges

Chart on Impact of drivers and challenges in 2025 and 2030

3. Market Landscape

3.1 Market ecosystem

Chart on Parent Market
Data Table on - Parent Market

3.2 Market characteristics

Chart on Market characteristics analysis

3.3 Value chain analysis

Chart on Value chain analysis

4. Market Sizing

4.1 Market definition

Data Table on Offerings of companies included in the market definition

4.2 Market segment analysis

Market segments

4.3 Market size 2025

4.4 Market outlook: Forecast for 2025-2030

Chart on Global - Market size and forecast 2025-2030 ($ million)
Data Table on Global - Market size and forecast 2025-2030 ($ million)
Chart on Global Market: Year-over-year growth 2025-2030 (%)
Data Table on Global Market: Year-over-year growth 2025-2030 (%)

5. Historic Market Size

5.1 Global Solar Batteries Market 2020 - 2024

Historic Market Size - Data Table on Global Solar Batteries Market 2020 - 2024 ($ million)

5.2 Technology segment analysis 2020 - 2024

Historic Market Size - Technology Segment 2020 - 2024 ($ million)

5.3 End-user segment analysis 2020 - 2024

Historic Market Size - End-user Segment 2020 - 2024 ($ million)

5.4 Capacity segment analysis 2020 - 2024

Historic Market Size - Capacity Segment 2020 - 2024 ($ million)

5.5 Geography segment analysis 2020 - 2024

Historic Market Size - Geography Segment 2020 - 2024 ($ million)

5.6 Country segment analysis 2020 - 2024

Historic Market Size - Country Segment 2020 - 2024 ($ million)

6. Qualitative Analysis

6.1 Impact of AI in global solar batteries market

7. Five Forces Analysis

7.1 Five forces summary

Five forces analysis - Comparison between 2025 and 2030

7.2 Bargaining power of buyers

Bargaining power of buyers - Impact of key factors 2025 and 2030

7.3 Bargaining power of suppliers

Bargaining power of suppliers - Impact of key factors in 2025 and 2030

7.4 Threat of new entrants

Threat of new entrants - Impact of key factors in 2025 and 2030

7.5 Threat of substitutes

Threat of substitutes - Impact of key factors in 2025 and 2030

7.6 Threat of rivalry

Threat of rivalry - Impact of key factors in 2025 and 2030

7.7 Market condition

Chart on Market condition - Five forces 2025 and 2030

8. Market Segmentation by Technology

8.1 Market segments

Chart on Technology - Market share 2025-2030 (%)
Data Table on Technology - Market share 2025-2030 (%)

8.2 Comparison by Technology

Chart on Comparison by Technology
Data Table on Comparison by Technology

8.3 Li-ion - Market size and forecast 2025-2030

Chart on Li-ion - Market size and forecast 2025-2030 ($ million)
Data Table on Li-ion - Market size and forecast 2025-2030 ($ million)
Chart on Li-ion - Year-over-year growth 2025-2030 (%)
Data Table on Li-ion - Year-over-year growth 2025-2030 (%)

8.4 Lead acid - Market size and forecast 2025-2030

Chart on Lead acid - Market size and forecast 2025-2030 ($ million)
Data Table on Lead acid - Market size and forecast 2025-2030 ($ million)
Chart on Lead acid - Year-over-year growth 2025-2030 (%)
Data Table on Lead acid - Year-over-year growth 2025-2030 (%)

8.5 Sodium-based - Market size and forecast 2025-2030

Chart on Sodium-based - Market size and forecast 2025-2030 ($ million)
Data Table on Sodium-based - Market size and forecast 2025-2030 ($ million)
Chart on Sodium-based - Year-over-year growth 2025-2030 (%)
Data Table on Sodium-based - Year-over-year growth 2025-2030 (%)

8.6 Others - Market size and forecast 2025-2030

Chart on Others - Market size and forecast 2025-2030 ($ million)
Data Table on Others - Market size and forecast 2025-2030 ($ million)
Chart on Others - Year-over-year growth 2025-2030 (%)
Data Table on Others - Year-over-year growth 2025-2030 (%)

8.7 Market opportunity by Technology

Market opportunity by Technology ($ million)
Data Table on Market opportunity by Technology ($ million)

9. Market Segmentation by End-user

9.1 Market segments

Chart on End-user - Market share 2025-2030 (%)
Data Table on End-user - Market share 2025-2030 (%)

9.2 Comparison by End-user

Chart on Comparison by End-user
Data Table on Comparison by End-user

9.3 Industrial - Market size and forecast 2025-2030

Chart on Industrial - Market size and forecast 2025-2030 ($ million)
Data Table on Industrial - Market size and forecast 2025-2030 ($ million)
Chart on Industrial - Year-over-year growth 2025-2030 (%)
Data Table on Industrial - Year-over-year growth 2025-2030 (%)

9.4 Commercial - Market size and forecast 2025-2030

Chart on Commercial - Market size and forecast 2025-2030 ($ million)
Data Table on Commercial - Market size and forecast 2025-2030 ($ million)
Chart on Commercial - Year-over-year growth 2025-2030 (%)
Data Table on Commercial - Year-over-year growth 2025-2030 (%)

9.5 Residential - Market size and forecast 2025-2030

Chart on Residential - Market size and forecast 2025-2030 ($ million)
Data Table on Residential - Market size and forecast 2025-2030 ($ million)
Chart on Residential - Year-over-year growth 2025-2030 (%)
Data Table on Residential - Year-over-year growth 2025-2030 (%)

9.6 Market opportunity by End-user

Market opportunity by End-user ($ million)
Data Table on Market opportunity by End-user ($ million)

10. Market Segmentation by Capacity

10.1 Market segments

Chart on Capacity - Market share 2025-2030 (%)
Data Table on Capacity - Market share 2025-2030 (%)

10.2 Comparison by Capacity

Chart on Comparison by Capacity
Data Table on Comparison by Capacity

10.3 Below 10 kWh - Market size and forecast 2025-2030

Chart on Below 10 kWh - Market size and forecast 2025-2030 ($ million)
Data Table on Below 10 kWh - Market size and forecast 2025-2030 ($ million)
Chart on Below 10 kWh - Year-over-year growth 2025-2030 (%)
Data Table on Below 10 kWh - Year-over-year growth 2025-2030 (%)

10.4 Between 10 to 50 kWh - Market size and forecast 2025-2030

Chart on Between 10 to 50 kWh - Market size and forecast 2025-2030 ($ million)
Data Table on Between 10 to 50 kWh - Market size and forecast 2025-2030 ($ million)
Chart on Between 10 to 50 kWh - Year-over-year growth 2025-2030 (%)
Data Table on Between 10 to 50 kWh - Year-over-year growth 2025-2030 (%)

10.5 Above 50 kWh - Market size and forecast 2025-2030

Chart on Above 50 kWh - Market size and forecast 2025-2030 ($ million)
Data Table on Above 50 kWh - Market size and forecast 2025-2030 ($ million)
Chart on Above 50 kWh - Year-over-year growth 2025-2030 (%)
Data Table on Above 50 kWh - Year-over-year growth 2025-2030 (%)

10.6 Market opportunity by Capacity

Market opportunity by Capacity ($ million)
Data Table on Market opportunity by Capacity ($ million)

11. Customer Landscape

11.1 Customer landscape overview

Analysis of price sensitivity, lifecycle, customer purchase basket, adoption rates, and purchase criteria

12. Geographic Landscape

12.1 Geographic segmentation

Chart on Market share by geography 2025-2030 (%)
Data Table on Market share by geography 2025-2030 (%)

12.2 Geographic comparison

Chart on Geographic comparison
Data Table on Geographic comparison

12.3 APAC - Market size and forecast 2025-2030

Chart on APAC - Market size and forecast 2025-2030 ($ million)
Data Table on APAC - Market size and forecast 2025-2030 ($ million)
Chart on APAC - Year-over-year growth 2025-2030 (%)
Data Table on APAC - Year-over-year growth 2025-2030 (%)
Chart on Regional Comparison - APAC
Data Table on Regional Comparison - APAC

12.3.1 China - Market size and forecast 2025-2030

Chart on China - Market size and forecast 2025-2030 ($ million)
Data Table on China - Market size and forecast 2025-2030 ($ million)
Chart on China - Year-over-year growth 2025-2030 (%)
Data Table on China - Year-over-year growth 2025-2030 (%)

12.3.2 Australia - Market size and forecast 2025-2030

Chart on Australia - Market size and forecast 2025-2030 ($ million)
Data Table on Australia - Market size and forecast 2025-2030 ($ million)
Chart on Australia - Year-over-year growth 2025-2030 (%)
Data Table on Australia - Year-over-year growth 2025-2030 (%)

12.3.3 Japan - Market size and forecast 2025-2030

Chart on Japan - Market size and forecast 2025-2030 ($ million)
Data Table on Japan - Market size and forecast 2025-2030 ($ million)
Chart on Japan - Year-over-year growth 2025-2030 (%)
Data Table on Japan - Year-over-year growth 2025-2030 (%)

12.3.4 India - Market size and forecast 2025-2030

Chart on India - Market size and forecast 2025-2030 ($ million)
Data Table on India - Market size and forecast 2025-2030 ($ million)
Chart on India - Year-over-year growth 2025-2030 (%)
Data Table on India - Year-over-year growth 2025-2030 (%)

12.3.5 South Korea - Market size and forecast 2025-2030

Chart on South Korea - Market size and forecast 2025-2030 ($ million)
Data Table on South Korea - Market size and forecast 2025-2030 ($ million)
Chart on South Korea - Year-over-year growth 2025-2030 (%)
Data Table on South Korea - Year-over-year growth 2025-2030 (%)

12.3.6 Indonesia - Market size and forecast 2025-2030

Chart on Indonesia - Market size and forecast 2025-2030 ($ million)
Data Table on Indonesia - Market size and forecast 2025-2030 ($ million)
Chart on Indonesia - Year-over-year growth 2025-2030 (%)
Data Table on Indonesia - Year-over-year growth 2025-2030 (%)

12.4 North America - Market size and forecast 2025-2030

Chart on North America - Market size and forecast 2025-2030 ($ million)
Data Table on North America - Market size and forecast 2025-2030 ($ million)
Chart on North America - Year-over-year growth 2025-2030 (%)
Data Table on North America - Year-over-year growth 2025-2030 (%)
Chart on Regional Comparison - North America
Data Table on Regional Comparison - North America

12.4.1 US - Market size and forecast 2025-2030

Chart on US - Market size and forecast 2025-2030 ($ million)
Data Table on US - Market size and forecast 2025-2030 ($ million)
Chart on US - Year-over-year growth 2025-2030 (%)
Data Table on US - Year-over-year growth 2025-2030 (%)

12.4.2 Canada - Market size and forecast 2025-2030

Chart on Canada - Market size and forecast 2025-2030 ($ million)
Data Table on Canada - Market size and forecast 2025-2030 ($ million)
Chart on Canada - Year-over-year growth 2025-2030 (%)
Data Table on Canada - Year-over-year growth 2025-2030 (%)

12.4.3 Mexico - Market size and forecast 2025-2030

Chart on Mexico - Market size and forecast 2025-2030 ($ million)
Data Table on Mexico - Market size and forecast 2025-2030 ($ million)
Chart on Mexico - Year-over-year growth 2025-2030 (%)
Data Table on Mexico - Year-over-year growth 2025-2030 (%)

12.5 Europe - Market size and forecast 2025-2030

Chart on Europe - Market size and forecast 2025-2030 ($ million)
Data Table on Europe - Market size and forecast 2025-2030 ($ million)
Chart on Europe - Year-over-year growth 2025-2030 (%)
Data Table on Europe - Year-over-year growth 2025-2030 (%)
Chart on Regional Comparison - Europe
Data Table on Regional Comparison - Europe

12.5.1 Germany - Market size and forecast 2025-2030

Chart on Germany - Market size and forecast 2025-2030 ($ million)
Data Table on Germany - Market size and forecast 2025-2030 ($ million)
Chart on Germany - Year-over-year growth 2025-2030 (%)
Data Table on Germany - Year-over-year growth 2025-2030 (%)

12.5.2 UK - Market size and forecast 2025-2030

Chart on UK - Market size and forecast 2025-2030 ($ million)
Data Table on UK - Market size and forecast 2025-2030 ($ million)
Chart on UK - Year-over-year growth 2025-2030 (%)
Data Table on UK - Year-over-year growth 2025-2030 (%)

12.5.3 Italy - Market size and forecast 2025-2030

Chart on Italy - Market size and forecast 2025-2030 ($ million)
Data Table on Italy - Market size and forecast 2025-2030 ($ million)
Chart on Italy - Year-over-year growth 2025-2030 (%)
Data Table on Italy - Year-over-year growth 2025-2030 (%)

12.5.4 France - Market size and forecast 2025-2030

Chart on France - Market size and forecast 2025-2030 ($ million)
Data Table on France - Market size and forecast 2025-2030 ($ million)
Chart on France - Year-over-year growth 2025-2030 (%)
Data Table on France - Year-over-year growth 2025-2030 (%)

12.5.5 Spain - Market size and forecast 2025-2030

Chart on Spain - Market size and forecast 2025-2030 ($ million)
Data Table on Spain - Market size and forecast 2025-2030 ($ million)
Chart on Spain - Year-over-year growth 2025-2030 (%)
Data Table on Spain - Year-over-year growth 2025-2030 (%)

12.5.6 The Netherlands - Market size and forecast 2025-2030

Chart on The Netherlands - Market size and forecast 2025-2030 ($ million)
Data Table on The Netherlands - Market size and forecast 2025-2030 ($ million)
Chart on The Netherlands - Year-over-year growth 2025-2030 (%)
Data Table on The Netherlands - Year-over-year growth 2025-2030 (%)

12.6 Middle East and Africa - Market size and forecast 2025-2030

Chart on Middle East and Africa - Market size and forecast 2025-2030 ($ million)
Data Table on Middle East and Africa - Market size and forecast 2025-2030 ($ million)
Chart on Middle East and Africa - Year-over-year growth 2025-2030 (%)
Data Table on Middle East and Africa - Year-over-year growth 2025-2030 (%)
Chart on Regional Comparison - Middle East and Africa
Data Table on Regional Comparison - Middle East and Africa

12.6.1 South Africa - Market size and forecast 2025-2030

Chart on South Africa - Market size and forecast 2025-2030 ($ million)
Data Table on South Africa - Market size and forecast 2025-2030 ($ million)
Chart on South Africa - Year-over-year growth 2025-2030 (%)
Data Table on South Africa - Year-over-year growth 2025-2030 (%)

12.6.2 UAE - Market size and forecast 2025-2030

Chart on UAE - Market size and forecast 2025-2030 ($ million)
Data Table on UAE - Market size and forecast 2025-2030 ($ million)
Chart on UAE - Year-over-year growth 2025-2030 (%)
Data Table on UAE - Year-over-year growth 2025-2030 (%)

12.6.3 Saudi Arabia - Market size and forecast 2025-2030

Chart on Saudi Arabia - Market size and forecast 2025-2030 ($ million)
Data Table on Saudi Arabia - Market size and forecast 2025-2030 ($ million)
Chart on Saudi Arabia - Year-over-year growth 2025-2030 (%)
Data Table on Saudi Arabia - Year-over-year growth 2025-2030 (%)

12.6.4 Israel - Market size and forecast 2025-2030

Chart on Israel - Market size and forecast 2025-2030 ($ million)
Data Table on Israel - Market size and forecast 2025-2030 ($ million)
Chart on Israel - Year-over-year growth 2025-2030 (%)
Data Table on Israel - Year-over-year growth 2025-2030 (%)

12.6.5 Egypt - Market size and forecast 2025-2030

Chart on Egypt - Market size and forecast 2025-2030 ($ million)
Data Table on Egypt - Market size and forecast 2025-2030 ($ million)
Chart on Egypt - Year-over-year growth 2025-2030 (%)
Data Table on Egypt - Year-over-year growth 2025-2030 (%)

12.7 South America - Market size and forecast 2025-2030

Chart on South America - Market size and forecast 2025-2030 ($ million)
Data Table on South America - Market size and forecast 2025-2030 ($ million)
Chart on South America - Year-over-year growth 2025-2030 (%)
Data Table on South America - Year-over-year growth 2025-2030 (%)
Chart on Regional Comparison - South America
Data Table on Regional Comparison - South America

12.7.1 Brazil - Market size and forecast 2025-2030

Chart on Brazil - Market size and forecast 2025-2030 ($ million)
Data Table on Brazil - Market size and forecast 2025-2030 ($ million)
Chart on Brazil - Year-over-year growth 2025-2030 (%)
Data Table on Brazil - Year-over-year growth 2025-2030 (%)

12.7.2 Chile - Market size and forecast 2025-2030

Chart on Chile - Market size and forecast 2025-2030 ($ million)
Data Table on Chile - Market size and forecast 2025-2030 ($ million)
Chart on Chile - Year-over-year growth 2025-2030 (%)
Data Table on Chile - Year-over-year growth 2025-2030 (%)

12.7.3 Argentina - Market size and forecast 2025-2030

Chart on Argentina - Market size and forecast 2025-2030 ($ million)
Data Table on Argentina - Market size and forecast 2025-2030 ($ million)
Chart on Argentina - Year-over-year growth 2025-2030 (%)
Data Table on Argentina - Year-over-year growth 2025-2030 (%)

12.8 Market opportunity by geography

Market opportunity by geography ($ million)
Data Tables on Market opportunity by geography ($ million)

13. Drivers, Challenges, and Opportunity

13.1 Market drivers

Proliferation of supportive policies and financial incentives
Rapid technological advancements and cost deflation in battery chemistries
Escalating demand for grid stability and energy independence

13.2 Market challenges

Supply chain fragmentation and geopolitical trade barriers
Critical shortage of skilled labor
Operational safety risks and financial liability

13.3 Impact of drivers and challenges

Impact of drivers and challenges in 2025 and 2030

13.4 Market opportunities

Diversification of battery chemistries and rise of sodium-ion technology
Institutionalization of virtual power plants (VPPS) and grid services
Integration of AI-driven energy management systems (EMS)

14. Competitive Landscape

14.1 Overview

14.2

Overview on criticality of inputs and factors of differentiation

14.3 Landscape disruption

Overview on factors of disruption

14.4 Industry risks

Impact of key risks on business

15. Competitive Analysis

15.1 Companies profiled

Companies covered

15.2 Company ranking index

15.3 Market positioning of companies

Matrix on companies position and classification

15.4 A123 Systems LLC

A123 Systems LLC - Overview
A123 Systems LLC - Product / Service
A123 Systems LLC - Key offerings
SWOT

15.5 Alpha ESS Co.Ltd.

Alpha ESS Co.Ltd. - Overview
Alpha ESS Co.Ltd. - Product / Service
Alpha ESS Co.Ltd. - Key offerings
SWOT

15.6 BYD Co. Ltd.

BYD Co. Ltd. - Overview
BYD Co. Ltd. - Business segments
BYD Co. Ltd. - Key news
BYD Co. Ltd. - Key offerings
BYD Co. Ltd. - Segment focus
SWOT

15.7 Contemporary Amperex Ltd.

Contemporary Amperex Ltd. - Overview
Contemporary Amperex Ltd. - Product / Service
Contemporary Amperex Ltd. - Key news
Contemporary Amperex Ltd. - Key offerings
SWOT

15.8 East Penn Manufacture Co. Inc.

East Penn Manufacture Co. Inc. - Overview
East Penn Manufacture Co. Inc. - Product / Service
East Penn Manufacture Co. Inc. - Key news
East Penn Manufacture Co. Inc. - Key offerings
SWOT

15.9 EnerSys

EnerSys - Overview
EnerSys - Business segments
EnerSys - Key news
EnerSys - Key offerings
EnerSys - Segment focus
SWOT

15.10 Exide Industries Ltd.

Exide Industries Ltd. - Overview
Exide Industries Ltd. - Product / Service
Exide Industries Ltd. - Key news
Exide Industries Ltd. - Key offerings
SWOT

15.11 GS Yuasa International Ltd.

GS Yuasa International Ltd. - Overview
GS Yuasa International Ltd. - Business segments
GS Yuasa International Ltd. - Key news
GS Yuasa International Ltd. - Key offerings
GS Yuasa International Ltd. - Segment focus
SWOT

15.12 LG Energy Solution Ltd.

LG Energy Solution Ltd. - Overview
LG Energy Solution Ltd. - Product / Service
LG Energy Solution Ltd. - Key offerings
SWOT

15.13 Loom Solar Pvt. Ltd.

Loom Solar Pvt. Ltd. - Overview
Loom Solar Pvt. Ltd. - Product / Service
Loom Solar Pvt. Ltd. - Key offerings
SWOT

15.14 Primus Power Solutions

Primus Power Solutions - Overview
Primus Power Solutions - Product / Service
Primus Power Solutions - Key offerings
SWOT

15.15 Renon Power Technology Inc.

Renon Power Technology Inc. - Overview
Renon Power Technology Inc. - Product / Service
Renon Power Technology Inc. - Key offerings
SWOT

15.16 Samsung SDI Co. Ltd.

Samsung SDI Co. Ltd. - Overview
Samsung SDI Co. Ltd. - Business segments
Samsung SDI Co. Ltd. - Key news
Samsung SDI Co. Ltd. - Key offerings
Samsung SDI Co. Ltd. - Segment focus
SWOT

15.17 SolarEdge Technologies Inc.

SolarEdge Technologies Inc. - Overview
SolarEdge Technologies Inc. - Product / Service
SolarEdge Technologies Inc. - Key news
SolarEdge Technologies Inc. - Key offerings
SWOT

15.18 Tesla Inc.

Tesla Inc. - Overview
Tesla Inc. - Business segments
Tesla Inc. - Key news
Tesla Inc. - Key offerings
Tesla Inc. - Segment focus
SWOT

16. Appendix

16.1 Scope of the report

Market definition
Objectives
Notes and caveats

16.2 Inclusions and exclusions checklist

Inclusions checklist
Exclusions checklist

16.3 Currency conversion rates for US$

16.4 Research methodology

16.5 Data procurement

Information sources

16.6 Data validation

16.7 Validation techniques employed for market sizing

16.8 Data synthesis

16.9 360 degree market analysis

16.10 List of abbreviations

Research Methodology

Technavio presents a detailed picture of the market by way of study, synthesis, and summation of data from multiple sources. The analysts have presented the various facets of the market with a particular focus on identifying the key industry influencers. The data thus presented is comprehensive, reliable, and the result of extensive research, both primary and secondary.

INFORMATION SOURCES

Primary sources

  • Manufacturers and suppliers
  • Channel partners
  • Industry experts
  • Strategic decision makers

Secondary sources

  • Industry journals and periodicals
  • Government data
  • Financial reports of key industry players
  • Historical data
  • Press releases

DATA ANALYSIS

Data Synthesis

  • Collation of data
  • Estimation of key figures
  • Analysis of derived insights

Data Validation

  • Triangulation with data models
  • Reference against proprietary databases
  • Corroboration with industry experts

REPORT WRITING

Qualitative

  • Market drivers
  • Market challenges
  • Market trends
  • Five forces analysis

Quantitative

  • Market size and forecast
  • Market segmentation
  • Geographical insights
  • Competitive landscape

Interested in this report?

Get your sample now to see our research methodology and insights!

Download Now

Frequently Asked Questions

Solar Batteries market growth will increase by USD 7302.4 million during 2026-2030.

The Solar Batteries market is expected to grow at a CAGR of 12.3% during 2026-2030.

Solar Batteries market is segmented by Technology (Li-ion, Lead acid, Sodium-based, Others) End-user (Industrial, Commercial, Residential) Capacity (Below 10 kWh, Between 10 to 50 kWh, Above 50 kWh)

A123 Systems LLC, Alpha ESS Co.Ltd., BYD Co. Ltd., Contemporary Amperex Ltd., East Penn Manufacture Co. Inc., EnerSys, Exide Industries Ltd., GS Yuasa International Ltd., LG Energy Solution Ltd., Loom Solar Pvt. Ltd., Primus Power Solutions, Renon Power Technology Inc., Samsung SDI Co. Ltd., SolarEdge Technologies Inc., Sunergy Solar, Tesla Inc. are a few of the key vendors in the Solar Batteries market.

APAC will register the highest growth rate of 39% among the other regions. Therefore, the Solar Batteries market in APAC is expected to garner significant business opportunities for the vendors during the forecast period.

China, Australia, Japan, India, South Korea, Indonesia, US, Canada, Mexico, Germany, UK, Italy, France, Spain, The Netherlands, South Africa, UAE, Saudi Arabia, Israel, Egypt, Brazil, Chile, Argentina

  • Proliferation of supportive policies and financial incentives is the driving factor this market.

The Solar Batteries market vendors should focus on grabbing business opportunities from the Technology segment as it accounted for the largest market share in the base year.