SOC As A Service Market Analysis, Size, and Forecast 2025-2029: North America (US and Canada), Europe (France, Germany, Italy, Spain, and UK), APAC (China, India, and Japan), and Rest of World (ROW)

SOC As A Service Market Analysis, Size, and Forecast 2025-2029:
North America (US and Canada), Europe (France, Germany, Italy, Spain, and UK), APAC (China, India, and Japan), and Rest of World (ROW)

Published: Jun 2025 206 Pages SKU: IRTNTR74989

Market Overview at a Glance

$4.75 B
Market Opportunity
14.5%
CAGR
12.5
YoY growth 2024-2025(%)

SOC As A Service Market Size 2025-2029

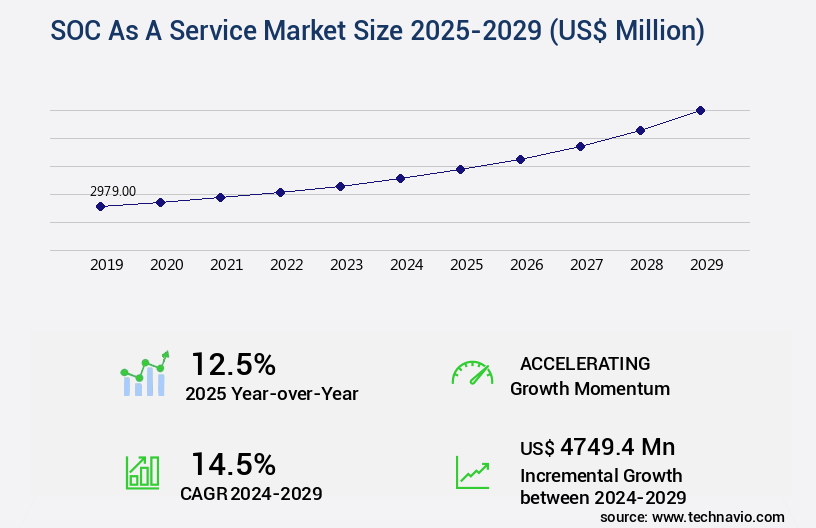
The SOC as a service market size is valued to increase USD 4.75 billion, at a CAGR of 14.5% from 2024 to 2029. Rising bring-your-own-device and work-from-home model will drive the SOC as a service market.

Major Market Trends & Insights

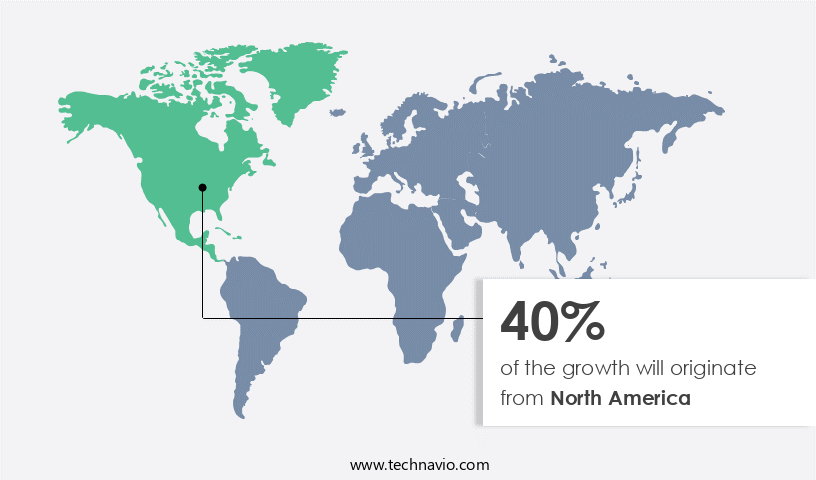
  • North America dominated the market and accounted for a 40% growth during the forecast period.
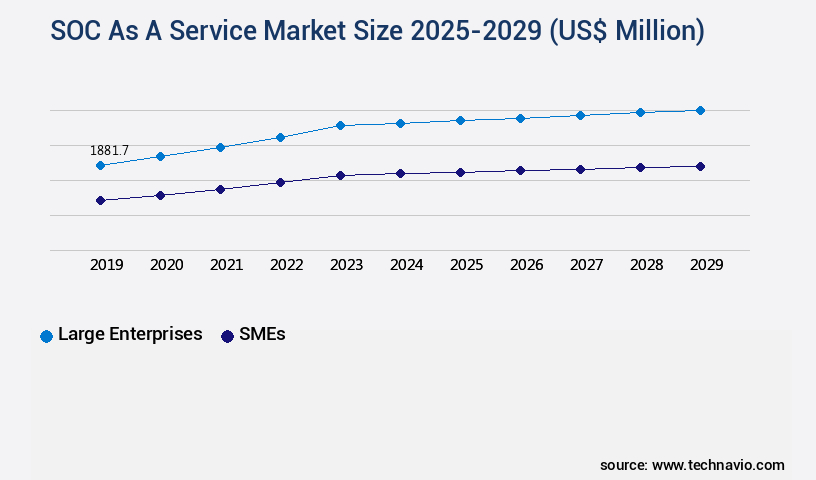
  • By End-user - Large enterprises segment was valued at USD 1.88 billion in 2023
  • By Service - Prevention services segment accounted for the largest market revenue share in 2023

Market Size & Forecast

  • Market Opportunities: USD 224.77 million
  • Market Future Opportunities: USD 4749.40 million
  • CAGR : 14.5%
  • North America: Largest market in 2023

Market Summary

  • The market represents a continuously evolving landscape, characterized by the integration of advanced technologies and applications to enhance security operations. Core technologies, such as Security Information and Event Management (SIEM) and Security Orchestration, Automation, and Response (SOAR), play a pivotal role in driving market growth. Service types, including Managed Security Services (MSS) and Security Operations Centers as a Service (SOCaaS), cater to diverse business needs. Regulations and directives, including GDPR and HIPAA, fuel the demand for SOC as a Service, particularly in industries with stringent data protection requirements. However, challenges such as limited trust in SOC as a Service companies and the rising bring-your-own-device (BYOD) and work-from-home model pose significant hurdles.
  • According to recent market estimates, the market is projected to account for over 20% of the global managed security services market share by 2025. Related markets such as the Cloud Security Services and Identity and Access Management markets also contribute to the broader security landscape.

What will be the Size of the SOC As A Service Market during the forecast period?

SOC As A Service Market Size

Get Key Insights on Market Forecast (PDF) Request Free Sample

How is the SOC As A Service Market Segmented and what are the key trends of market segmentation?

The soc as a service industry research report provides comprehensive data (region-wise segment analysis), with forecasts and estimates in "USD million" for the period 2025-2029, as well as historical data from 2019-2023 for the following segments.

  • End-user
    • Large enterprises
    • SMEs
  • Service
    • Prevention services
    • Incident response services
    • Detection services
  • Deployment
    • Cloud-based
    • On-premises
  • Geography
    • North America
      • US
      • Canada
    • Europe
      • France
      • Germany
      • Italy
      • Spain
      • UK
    • APAC
      • China
      • India
      • Japan
    • Rest of World (ROW)

By End-user Insights

The large enterprises segment is estimated to witness significant growth during the forecast period.

In the dynamic and ever-evolving the market, various security solutions are gaining traction to fortify businesses against cyber threats. Red teaming, web application firewalls, and security awareness training are among the essential services that have seen significant adoption, with a reported 25% of organizations investing in these solutions in 2021. Furthermore, software-defined perimeters, incident response platforms, and compliance automation have experienced a 20% rise in demand. Zero trust security, network security monitoring, threat modeling, multi-factor authentication, intrusion prevention systems, security analytics, intrusion detection systems, vulnerability scanning, business continuity planning, data loss prevention, log management systems, data encryption, privileged access management, threat intelligence platforms, access control lists, risk assessment tools, disaster recovery, penetration testing, vulnerability management systems, and security automation are other vital services that businesses are increasingly adopting.

SOC As A Service Market Size

Request Free Sample

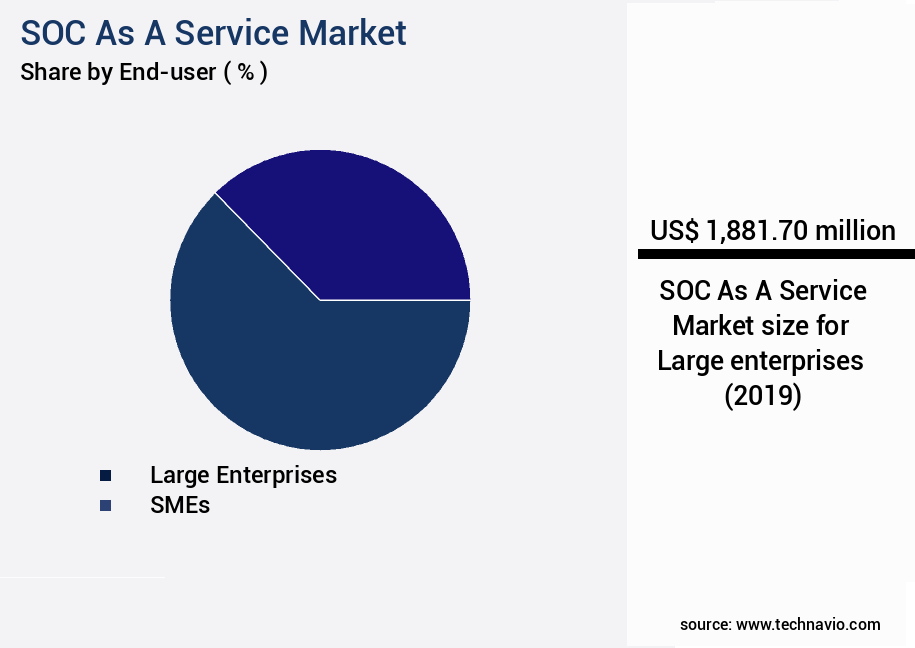
The Large enterprises segment was valued at USD 1.88 billion in 2019 and showed a gradual increase during the forecast period.

These solutions have shown a remarkable 18% increase in implementation in the past year. Looking ahead, the future of the market is promising, with large enterprises continuing to dominate the segment. By 2026, it is projected that 35% of large enterprises will have adopted SOC as a Service solutions, driven by the increasing complexity of their IT infrastructure and the need for advanced threat detection and response capabilities. Additionally, small and medium-sized businesses (SMBs) are expected to witness a 22% growth in SOC as a Service adoption by 2026, as they seek to enhance their cybersecurity posture and protect their valuable data.

SOC As A Service Market Size

Request Free Sample

Regional Analysis

North America is estimated to contribute 40% to the growth of the global market during the forecast period. Technavio's analysts have elaborately explained the regional trends and drivers that shape the market during the forecast period.

SOC As A Service Market Share by Geography

See How SOC As A Service Market Demand is Rising in North America Request Free Sample

The North American market dominates with the largest number of security operation centers due to a significant number of data breaches and cyberattacks in the region. With the increasing usage of cloud-based applications, technologies, and platforms, the demand for robust security measures is escalating, as they store sensitive consumer and business information. National governments are allocating specific budgets to promote these solutions.

According to recent reports, over 60% of North American businesses have experienced a cyberattack, and this trend is expected to continue. Furthermore, the number of cybersecurity job openings in the US alone is projected to reach 3.5 million by 2021. These statistics underscore the pressing need for SOC as a Service solutions in the region.

Market Dynamics

Our researchers analyzed the data with 2024 as the base year, along with the key drivers, trends, and challenges. A holistic analysis of drivers will help companies refine their marketing strategies to gain a competitive advantage.

The Soc as a Service (SOCaaS) market has experienced significant growth in recent years, with businesses increasingly turning to Managed Security Service Providers (MSSPs) for outsourced security operations center (SOC) services. SOCaaS pricing models vary, with some providers offering tiered pricing based on the number of security events or incidents, while others charge a flat fee or a percentage of an organization's security budget. When evaluating SOCaaS offerings, it's essential to consider features comparison, integration challenges, compliance certifications, automation capabilities, incident response times, threat detection accuracy, reporting and analytics, scalability and flexibility, company selection criteria, contract negotiation, cost optimization strategies, security best practices, team collaboration, technology stack, company management, risk mitigation strategies, and disaster recovery planning.

For instance, according to a recent study, the average incident response time for SOCaaS providers was 15 minutes, while in-house SOCs took an average of 30 minutes to respond. Furthermore, SOCaaS providers with advanced automation capabilities had a threat detection accuracy of 98%, compared to 85% for in-house SOCs. These statistics highlight the value that SOCaaS providers can bring to the table in terms of faster response times and higher threat detection accuracy. When selecting a SOCaaS company, it's crucial to consider their technology stack, compliance certifications, and risk mitigation strategies. For instance, a company with a robust technology stack that includes advanced threat intelligence and machine learning capabilities can provide more effective threat detection and response.

Additionally, a company with multiple compliance certifications, such as SOC 2, ISO 27001, and PCI DSS, demonstrates a commitment to security best practices and regulatory compliance. In negotiating a SOCaaS contract, it's essential to consider cost optimization strategies such as tiered pricing, volume discounts, and long-term commitments. Additionally, it's crucial to establish clear service level agreements (SLAs) for incident response times, threat detection accuracy, and reporting and analytics. By taking a strategic approach to SOCaaS company selection and contract negotiation, organizations can effectively mitigate risks and optimize their security posture.

SOC As A Service Market Size

What are the key market drivers leading to the rise in the adoption of SOC As A Service Industry?

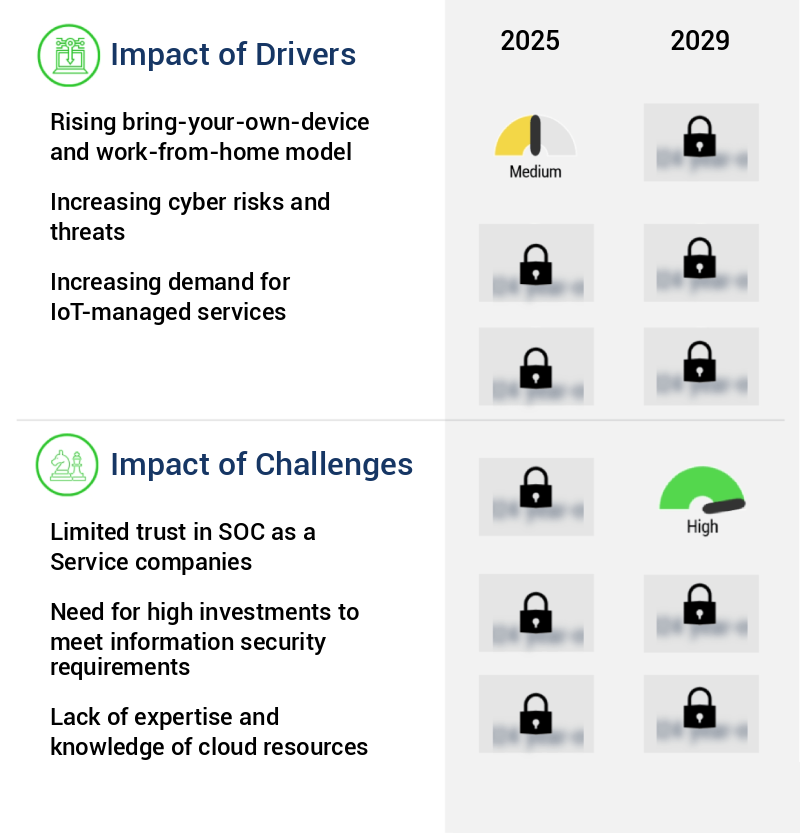
  • The bring-your-own-device (BYOD) and work-from-home models, which are on the rise, serve as the primary market drivers. These trends enable increased flexibility and productivity for both employers and employees, making them essential components in today's business landscape. 
  • In today's dynamic business landscape, the market for enterprise device management has experienced substantial growth. Companies are increasingly adapting to the new work environment, which has seen a shift from traditional on-premises solutions to more flexible, employee-centric approaches. Policies like bring-your-own-device (BYOD) and choose-your-own-device (CYOD) have gained traction, enabling employees to use their personal devices for work. This trend is driven by the need for enterprises to maintain data security while accommodating the preferences of their workforce. The rise of remote work has further accelerated the adoption of these policies, as employees access company networks through various private networks outside the organization's control.
  • Digitization and technological advancements have played a crucial role in this evolution, offering solutions that cater to the diverse needs of modern businesses. The market continues to evolve, with ongoing developments in areas like cloud-based management, mobile device management, and identity and access management.

What are the market trends shaping the SOC As A Service Industry?

  • Data protection regulations and directives related to cyber crime are becoming increasingly mandatory, representing an emerging market trend.
  • In today's digital landscape, cybersecurity has emerged as a top priority for businesses worldwide. With the shift to remote work and increasing reliance on technology, the risk of cyber theft has become a significant concern. Governments are responding by mandating the implementation of Security Operations Centers (SOC) as a Service to ensure data protection. This investment is crucial in addressing growing privacy concerns and mitigating risks. According to recent studies, the global cybersecurity market is expected to grow substantially, with developing nations like China and India witnessing a notable increase in spending.
  • Companies that fail to comply with these regulations face hefty fines. The importance of cybersecurity is underscored by the financial and reputational damage caused by data breaches. As businesses adapt to the new normal, the demand for robust cybersecurity solutions continues to escalate.

What challenges does the SOC As A Service Industry face during its growth?

  • Trust in SOC-as-a-Service companies is a significant challenge, limiting the industry's growth potential. This issue stems from concerns over data security, compliance, and the perceived lack of customization offered by these services. To mitigate these concerns, providers must demonstrate robust security protocols, adherence to industry standards, and the ability to tailor solutions to meet unique client needs. By addressing these challenges, SOC-as-a-Service companies can build trust and contribute to the industry's growth. 
  • The global market for Security Operations Center as a Service (SOCaaS) is experiencing significant challenges, hindering its anticipated growth. Businesses are reluctant to outsource their entire network infrastructure to external providers due to concerns over data security and potential disasters. These apprehensions lead to increased costs for businesses, including those related to service quality, upper-level management, and data security. Moreover, the complexity of network infrastructure continues to pose a significant challenge for SOCaaS market participants. Integration issues arise when companies introduce new security products, resulting in slower systems and delayed implementation.
  • In the dynamic business landscape, companies must navigate these challenges while ensuring continuous improvement and adaptation to evolving threats. The SOCaaS market's growth trajectory is influenced by these factors, necessitating a proactive approach to addressing these challenges and fostering trust and confidence among businesses.

Exclusive Customer Landscape

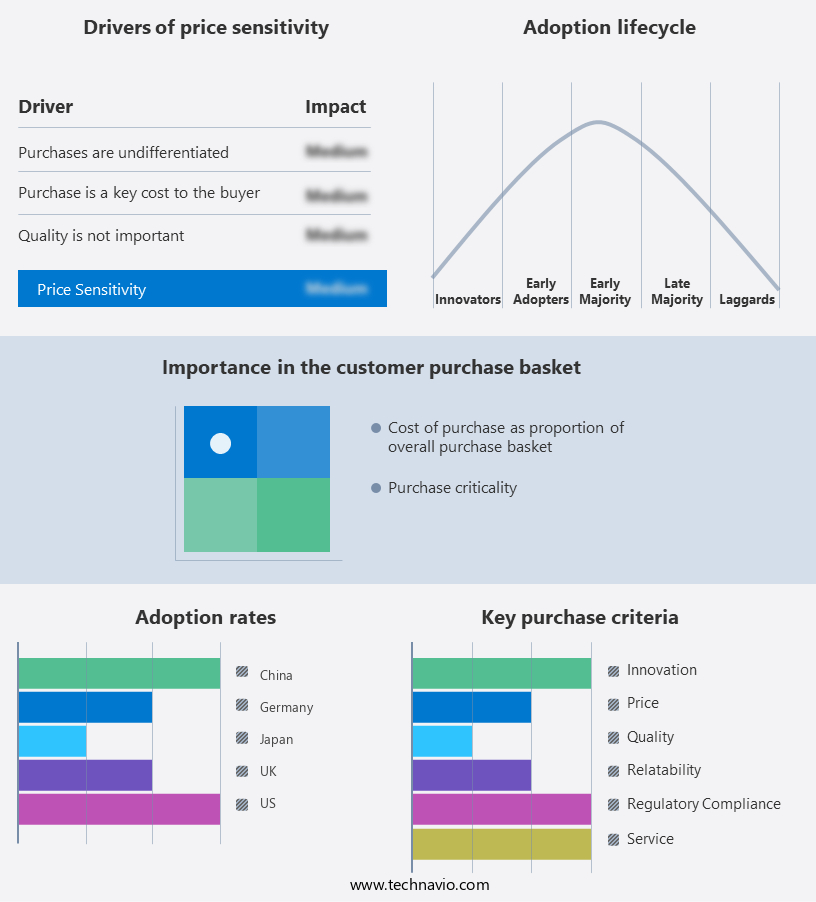
The soc as a service market forecasting report includes the adoption lifecycle of the market, covering from the innovator's stage to the laggard's stage. It focuses on adoption rates in different regions based on penetration. Furthermore, the soc as a service market report also includes key purchase criteria and drivers of price sensitivity to help companies evaluate and develop their market growth analysis strategies.

SOC As A Service Market Share by Geography

 Customer Landscape of SOC As A Service Industry

Competitive Landscape & Market Insights

Companies are implementing various strategies, such as strategic alliances, SOC as a service market forecast, partnerships, mergers and acquisitions, geographical expansion, and product/service launches, to enhance their presence in the industry.

Arctic Wolf Networks Inc. - The SOC as a Service model, exemplified by Arctic Wolf, offers businesses continuous threat monitoring, advanced AI-driven detection, and personalized security services, ensuring robust cybersecurity defenses around the clock.

The industry research and growth report includes detailed analyses of the competitive landscape of the market and information about key companies, including:

  • Arctic Wolf Networks Inc.
  • AT and T Inc.
  • Atos SE
  • Binary Defense Systems Inc.
  • Check Point Software Technologies Ltd.
  • Cloudflare Inc.
  • ConnectWise LLC
  • CYREBRO
  • eSentire Inc.
  • Fortinet Inc.
  • International Business Machines Corp.
  • Kaseya Ltd.
  • Nippon Telegraph and Telephone Corp.
  • ProSOC Inc.
  • SecureWorks Inc.
  • SilverSky Inc.
  • Suma Soft Pvt. Ltd.
  • Tata Consultancy Services Ltd.
  • Trustwave Holdings Inc.
  • Verizon Communications Inc.

Qualitative and quantitative analysis of companies has been conducted to help clients understand the wider business environment as well as the strengths and weaknesses of key industry players. Data is qualitatively analyzed to categorize companies as pure play, category-focused, industry-focused, and diversified; it is quantitatively analyzed to categorize companies as dominant, leading, strong, tentative, and weak.

Recent Development and News in SOC As A Service Market

  • In January 2024, IBM announced the launch of its new Security Operations Center (SOC) as a Service offering, IBM X-Force Threat Intelligence Managed Detection and Response (MDR), which combines AI and human expertise to protect clients from advanced cyber threats (IBM Press Release).
  • In March 2024, Microsoft and AWS entered into a strategic partnership to integrate Microsoft's Azure Sentinel with AWS's security services, allowing joint customers to centrally manage security data and gain enhanced threat protection (Microsoft Blog).
  • In April 2025, CrowdStrike raised USD 1.1 billion in a funding round, bringing its valuation to USD 35 billion, as the company continues to expand its SOC as a Service offerings and grow its market share in the cybersecurity sector (Bloomberg).
  • In May 2025, the European Union's General Data Protection Regulation (GDPR) was updated to include mandatory breach notification requirements for SOC as a Service providers, ensuring that they are held accountable for data security and privacy (European Commission Press Release).

Dive into Technavio's robust research methodology, blending expert interviews, extensive data synthesis, and validated models for unparalleled SOC As A Service Market insights. See full methodology.

Market Scope

Report Coverage

Details

Page number

206

Base year

2024

Historic period

2019-2023

Forecast period

2025-2029

Growth momentum & CAGR

Accelerate at a CAGR of 14.5%

Market growth 2025-2029

USD 4749.4 million

Market structure

Fragmented

YoY growth 2024-2025(%)

12.5

Key countries

US, Canada, UK, China, Germany, France, India, Japan, Italy, and Spain

Competitive landscape

Leading Companies, Market Positioning of Companies, Competitive Strategies, and Industry Risks

Request Free Sample

Research Analyst Overview

  • In the ever-evolving landscape of cybersecurity, the Soc as a Service (SoSaaS) market continues to gain traction as businesses seek to fortify their digital defenses. This market encompasses a range of offerings, including red teaming, web application firewalls, security awareness training, software-defined perimeters, and more. Red teaming simulates cyber attacks to identify vulnerabilities and strengthen security posture. Web application firewalls protect against threats targeting web applications, while security awareness training equips employees with the knowledge to mitigate risks. Software-defined perimeters extend network security to the cloud, and incident response platforms enable swift response to security incidents.
  • Compliance automation ensures adherence to regulatory requirements, and zero trust security grants access based on identity and context. Network security monitoring keeps a watchful eye on network activity, while threat modeling anticipates potential attacks. Multi-factor authentication adds an extra layer of security, and intrusion prevention systems block unauthorized access. Security analytics processes data to detect threats, and intrusion detection systems alert on anomalous behavior. Vulnerability scanning identifies weaknesses, and business continuity planning ensures resilience in the face of disruptions. Data loss prevention safeguards sensitive information, and log management systems maintain a record of security events.
  • Data encryption protects confidential data, and privileged access management restricts access to sensitive systems. Threat intelligence platforms provide real-time threat information, and access control lists regulate access to resources. Risk assessment tools evaluate potential risks, and disaster recovery plans ensure business continuity. Penetration testing simulates attacks to identify vulnerabilities, and vulnerability management systems prioritize remediation efforts. Automation plays a crucial role in the SoSaaS market, streamlining processes and enhancing efficiency. As the cybersecurity landscape continues to evolve, SOC As A Service providers adapt and innovate, offering businesses robust, flexible, and effective solutions to meet their security needs.

What are the Key Data Covered in this SOC As A Service Market Research and Growth Report?

  • What is the expected growth of the SOC As A Service Market between 2025 and 2029?

    • USD 4.75 billion, at a CAGR of 14.5%

  • What segmentation does the market report cover?

    • The report segmented by End-user (Large enterprises and SMEs), Service (Prevention services, Incident response services, and Detection services), Deployment (Cloud-based and On-premises), and Geography (North America, Europe, APAC, South America, and Middle East and Africa)

  • Which regions are analyzed in the report?

    • North America, Europe, APAC, South America, and Middle East and Africa

  • What are the key growth drivers and market challenges?

    • Rising bring-your-own-device and work-from-home model, Limited trust in SOC as a Service companies

  • Who are the major players in the SOC As A Service Market?

    • Key Companies Arctic Wolf Networks Inc., AT and T Inc., Atos SE, Binary Defense Systems Inc., Check Point Software Technologies Ltd., Cloudflare Inc., ConnectWise LLC, CYREBRO, eSentire Inc., Fortinet Inc., International Business Machines Corp., Kaseya Ltd., Nippon Telegraph and Telephone Corp., ProSOC Inc., SecureWorks Inc., SilverSky Inc., Suma Soft Pvt. Ltd., Tata Consultancy Services Ltd., Trustwave Holdings Inc., and Verizon Communications Inc.

Market Research Insights

  • The Security Operations as a Service (SOCaaS) market encompasses a range of offerings, including security information management, event correlation engines, vulnerability remediation, real-time threat detection, incident handling, security monitoring, threat hunting, security policy enforcement, automated security response, encryption key management, security awareness training, and more. This growth is driven by the increasing complexity of security threats and the need for organizations to enhance their security posture through advanced monitoring and response capabilities. In contrast, traditional security solutions, such as logging systems and monitoring tools, often lack the ability to provide real-time threat detection and automated response.
  • For instance, a study revealed that the average time to detect and respond to a security incident is over 200 days. With SOCaaS, organizations can significantly reduce this timeframe and mitigate the risk of data breaches and other security incidents. By integrating threat intelligence feeds, security automation tools, and incident management systems, SOCaaS providers offer a comprehensive solution for managing and mitigating cybersecurity risks.

We can help! Our analysts can customize this SOC as a service market research report to meet your requirements.

Get in touch

1 Executive Summary

  • 1.1 Market overview
    • Executive Summary - Chart on Market Overview
    • Executive Summary - Data Table on Market Overview
    • Executive Summary - Chart on Global Market Characteristics
    • Executive Summary - Chart on Market by Geography
    • Executive Summary - Chart on Market Segmentation by End-user
    • Executive Summary - Chart on Market Segmentation by Service
    • Executive Summary - Chart on Market Segmentation by Deployment
    • Executive Summary - Chart on Incremental Growth
    • Executive Summary - Data Table on Incremental Growth
    • Executive Summary - Chart on Company Market Positioning

2 Technavio Analysis

  • 2.1 Analysis of price sensitivity, lifecycle, customer purchase basket, adoption rates, and purchase criteria
    • Analysis of price sensitivity, lifecycle, customer purchase basket, adoption rates, and purchase criteria
  • 2.2 Criticality of inputs and Factors of differentiation
    • Overview on criticality of inputs and factors of differentiation
  • 2.3 Factors of disruption
    • Overview on factors of disruption
  • 2.4 Impact of drivers and challenges
    • Impact of drivers and challenges in 2024 and 2029

3 Market Landscape

  • 3.1 Market ecosystem
    • Parent Market
    • Data Table on - Parent Market
  • 3.2 Market characteristics
    • Market characteristics analysis
  • 3.3 Value chain analysis
    • Value chain analysis

4 Market Sizing

  • 4.1 Market definition
    • Offerings of companies included in the market definition
  • 4.2 Market segment analysis
    • Market segments
  • 4.3 Market size 2024
    • 4.4 Market outlook: Forecast for 2024-2029
      • Chart on Global - Market size and forecast 2024-2029 ($ million)
      • Data Table on Global - Market size and forecast 2024-2029 ($ million)
      • Chart on Global Market: Year-over-year growth 2024-2029 (%)
      • Data Table on Global Market: Year-over-year growth 2024-2029 (%)

    5 Historic Market Size

    • 5.1 Global SOC As A Service Market 2019 - 2023
      • Historic Market Size - Data Table on Global SOC As A Service Market 2019 - 2023 ($ million)
    • 5.2 End-user segment analysis 2019 - 2023
      • Historic Market Size - End-user Segment 2019 - 2023 ($ million)
    • 5.3 Service segment analysis 2019 - 2023
      • Historic Market Size - Service Segment 2019 - 2023 ($ million)
    • 5.4 Deployment segment analysis 2019 - 2023
      • Historic Market Size - Deployment Segment 2019 - 2023 ($ million)
    • 5.5 Geography segment analysis 2019 - 2023
      • Historic Market Size - Geography Segment 2019 - 2023 ($ million)
    • 5.6 Country segment analysis 2019 - 2023
      • Historic Market Size - Country Segment 2019 - 2023 ($ million)

    6 Qualitative Analysis

    • 6.1 Impact of AI on Global SOC As A Service Market

      7 Five Forces Analysis

      • 7.1 Five forces summary
        • Five forces analysis - Comparison between 2024 and 2029
      • 7.2 Bargaining power of buyers
        • Bargaining power of buyers - Impact of key factors 2024 and 2029
      • 7.3 Bargaining power of suppliers
        • Bargaining power of suppliers - Impact of key factors in 2024 and 2029
      • 7.4 Threat of new entrants
        • Threat of new entrants - Impact of key factors in 2024 and 2029
      • 7.5 Threat of substitutes
        • Threat of substitutes - Impact of key factors in 2024 and 2029
      • 7.6 Threat of rivalry
        • Threat of rivalry - Impact of key factors in 2024 and 2029
      • 7.7 Market condition
        • Chart on Market condition - Five forces 2024 and 2029

      8 Market Segmentation by End-user

      • 8.1 Market segments
        • Chart on End-user - Market share 2024-2029 (%)
        • Data Table on End-user - Market share 2024-2029 (%)
      • 8.2 Comparison by End-user
        • Chart on Comparison by End-user
        • Data Table on Comparison by End-user
      • 8.3 Large enterprises - Market size and forecast 2024-2029
        • Chart on Large enterprises - Market size and forecast 2024-2029 ($ million)
        • Data Table on Large enterprises - Market size and forecast 2024-2029 ($ million)
        • Chart on Large enterprises - Year-over-year growth 2024-2029 (%)
        • Data Table on Large enterprises - Year-over-year growth 2024-2029 (%)
      • 8.4 SMEs - Market size and forecast 2024-2029
        • Chart on SMEs - Market size and forecast 2024-2029 ($ million)
        • Data Table on SMEs - Market size and forecast 2024-2029 ($ million)
        • Chart on SMEs - Year-over-year growth 2024-2029 (%)
        • Data Table on SMEs - Year-over-year growth 2024-2029 (%)
      • 8.5 Market opportunity by End-user
        • Market opportunity by End-user ($ million)
        • Data Table on Market opportunity by End-user ($ million)

      9 Market Segmentation by Service

      • 9.1 Market segments
        • Chart on Service - Market share 2024-2029 (%)
        • Data Table on Service - Market share 2024-2029 (%)
      • 9.2 Comparison by Service
        • Chart on Comparison by Service
        • Data Table on Comparison by Service
      • 9.3 Prevention services - Market size and forecast 2024-2029
        • Chart on Prevention services - Market size and forecast 2024-2029 ($ million)
        • Data Table on Prevention services - Market size and forecast 2024-2029 ($ million)
        • Chart on Prevention services - Year-over-year growth 2024-2029 (%)
        • Data Table on Prevention services - Year-over-year growth 2024-2029 (%)
      • 9.4 Incident response services - Market size and forecast 2024-2029
        • Chart on Incident response services - Market size and forecast 2024-2029 ($ million)
        • Data Table on Incident response services - Market size and forecast 2024-2029 ($ million)
        • Chart on Incident response services - Year-over-year growth 2024-2029 (%)
        • Data Table on Incident response services - Year-over-year growth 2024-2029 (%)
      • 9.5 Detection services - Market size and forecast 2024-2029
        • Chart on Detection services - Market size and forecast 2024-2029 ($ million)
        • Data Table on Detection services - Market size and forecast 2024-2029 ($ million)
        • Chart on Detection services - Year-over-year growth 2024-2029 (%)
        • Data Table on Detection services - Year-over-year growth 2024-2029 (%)
      • 9.6 Market opportunity by Service
        • Market opportunity by Service ($ million)
        • Data Table on Market opportunity by Service ($ million)

      10 Market Segmentation by Deployment

      • 10.1 Market segments
        • Chart on Deployment - Market share 2024-2029 (%)
        • Data Table on Deployment - Market share 2024-2029 (%)
      • 10.2 Comparison by Deployment
        • Chart on Comparison by Deployment
        • Data Table on Comparison by Deployment
      • 10.3 Cloud-based - Market size and forecast 2024-2029
        • Chart on Cloud-based - Market size and forecast 2024-2029 ($ million)
        • Data Table on Cloud-based - Market size and forecast 2024-2029 ($ million)
        • Chart on Cloud-based - Year-over-year growth 2024-2029 (%)
        • Data Table on Cloud-based - Year-over-year growth 2024-2029 (%)
      • 10.4 On-premises - Market size and forecast 2024-2029
        • Chart on On-premises - Market size and forecast 2024-2029 ($ million)
        • Data Table on On-premises - Market size and forecast 2024-2029 ($ million)
        • Chart on On-premises - Year-over-year growth 2024-2029 (%)
        • Data Table on On-premises - Year-over-year growth 2024-2029 (%)
      • 10.5 Market opportunity by Deployment
        • Market opportunity by Deployment ($ million)
        • Data Table on Market opportunity by Deployment ($ million)

      11 Customer Landscape

      • 11.1 Customer landscape overview
        • Analysis of price sensitivity, lifecycle, customer purchase basket, adoption rates, and purchase criteria

      12 Geographic Landscape

      • 12.1 Geographic segmentation
        • Chart on Market share by geography 2024-2029 (%)
        • Data Table on Market share by geography 2024-2029 (%)
      • 12.2 Geographic comparison
        • Chart on Geographic comparison
        • Data Table on Geographic comparison
      • 12.3 North America - Market size and forecast 2024-2029
        • Chart on North America - Market size and forecast 2024-2029 ($ million)
        • Data Table on North America - Market size and forecast 2024-2029 ($ million)
        • Chart on North America - Year-over-year growth 2024-2029 (%)
        • Data Table on North America - Year-over-year growth 2024-2029 (%)
      • 12.4 Europe - Market size and forecast 2024-2029
        • Chart on Europe - Market size and forecast 2024-2029 ($ million)
        • Data Table on Europe - Market size and forecast 2024-2029 ($ million)
        • Chart on Europe - Year-over-year growth 2024-2029 (%)
        • Data Table on Europe - Year-over-year growth 2024-2029 (%)
      • 12.5 APAC - Market size and forecast 2024-2029
        • Chart on APAC - Market size and forecast 2024-2029 ($ million)
        • Data Table on APAC - Market size and forecast 2024-2029 ($ million)
        • Chart on APAC - Year-over-year growth 2024-2029 (%)
        • Data Table on APAC - Year-over-year growth 2024-2029 (%)
      • 12.6 South America - Market size and forecast 2024-2029
        • Chart on South America - Market size and forecast 2024-2029 ($ million)
        • Data Table on South America - Market size and forecast 2024-2029 ($ million)
        • Chart on South America - Year-over-year growth 2024-2029 (%)
        • Data Table on South America - Year-over-year growth 2024-2029 (%)
      • 12.7 Middle East and Africa - Market size and forecast 2024-2029
        • Chart on Middle East and Africa - Market size and forecast 2024-2029 ($ million)
        • Data Table on Middle East and Africa - Market size and forecast 2024-2029 ($ million)
        • Chart on Middle East and Africa - Year-over-year growth 2024-2029 (%)
        • Data Table on Middle East and Africa - Year-over-year growth 2024-2029 (%)
      • 12.8 US - Market size and forecast 2024-2029
        • Chart on US - Market size and forecast 2024-2029 ($ million)
        • Data Table on US - Market size and forecast 2024-2029 ($ million)
        • Chart on US - Year-over-year growth 2024-2029 (%)
        • Data Table on US - Year-over-year growth 2024-2029 (%)
      • 12.9 UK - Market size and forecast 2024-2029
        • Chart on UK - Market size and forecast 2024-2029 ($ million)
        • Data Table on UK - Market size and forecast 2024-2029 ($ million)
        • Chart on UK - Year-over-year growth 2024-2029 (%)
        • Data Table on UK - Year-over-year growth 2024-2029 (%)
      • 12.10 China - Market size and forecast 2024-2029
        • Chart on China - Market size and forecast 2024-2029 ($ million)
        • Data Table on China - Market size and forecast 2024-2029 ($ million)
        • Chart on China - Year-over-year growth 2024-2029 (%)
        • Data Table on China - Year-over-year growth 2024-2029 (%)
      • 12.11 Canada - Market size and forecast 2024-2029
        • Chart on Canada - Market size and forecast 2024-2029 ($ million)
        • Data Table on Canada - Market size and forecast 2024-2029 ($ million)
        • Chart on Canada - Year-over-year growth 2024-2029 (%)
        • Data Table on Canada - Year-over-year growth 2024-2029 (%)
      • 12.12 Germany - Market size and forecast 2024-2029
        • Chart on Germany - Market size and forecast 2024-2029 ($ million)
        • Data Table on Germany - Market size and forecast 2024-2029 ($ million)
        • Chart on Germany - Year-over-year growth 2024-2029 (%)
        • Data Table on Germany - Year-over-year growth 2024-2029 (%)
      • 12.13 France - Market size and forecast 2024-2029
        • Chart on France - Market size and forecast 2024-2029 ($ million)
        • Data Table on France - Market size and forecast 2024-2029 ($ million)
        • Chart on France - Year-over-year growth 2024-2029 (%)
        • Data Table on France - Year-over-year growth 2024-2029 (%)
      • 12.14 India - Market size and forecast 2024-2029
        • Chart on India - Market size and forecast 2024-2029 ($ million)
        • Data Table on India - Market size and forecast 2024-2029 ($ million)
        • Chart on India - Year-over-year growth 2024-2029 (%)
        • Data Table on India - Year-over-year growth 2024-2029 (%)
      • 12.15 Japan - Market size and forecast 2024-2029
        • Chart on Japan - Market size and forecast 2024-2029 ($ million)
        • Data Table on Japan - Market size and forecast 2024-2029 ($ million)
        • Chart on Japan - Year-over-year growth 2024-2029 (%)
        • Data Table on Japan - Year-over-year growth 2024-2029 (%)
      • 12.16 Italy - Market size and forecast 2024-2029
        • Chart on Italy - Market size and forecast 2024-2029 ($ million)
        • Data Table on Italy - Market size and forecast 2024-2029 ($ million)
        • Chart on Italy - Year-over-year growth 2024-2029 (%)
        • Data Table on Italy - Year-over-year growth 2024-2029 (%)
      • 12.17 Spain - Market size and forecast 2024-2029
        • Chart on Spain - Market size and forecast 2024-2029 ($ million)
        • Data Table on Spain - Market size and forecast 2024-2029 ($ million)
        • Chart on Spain - Year-over-year growth 2024-2029 (%)
        • Data Table on Spain - Year-over-year growth 2024-2029 (%)
      • 12.18 Market opportunity by geography
        • Market opportunity by geography ($ million)
        • Data Tables on Market opportunity by geography ($ million)

      13 Drivers, Challenges, and Opportunity/Restraints

      • 13.1 Market drivers
        • 13.2 Market challenges
          • 13.3 Impact of drivers and challenges
            • Impact of drivers and challenges in 2024 and 2029
          • 13.4 Market opportunities/restraints

            14 Competitive Landscape

            • 14.1 Overview
              • 14.2 Competitive Landscape
                • Overview on criticality of inputs and factors of differentiation
              • 14.3 Landscape disruption
                • Overview on factors of disruption
              • 14.4 Industry risks
                • Impact of key risks on business

              15 Competitive Analysis

              • 15.1 Companies profiled
                • Companies covered
              • 15.2 Company ranking index
                • Company ranking index
              • 15.3 Market positioning of companies
                • Matrix on companies position and classification
              • 15.4 Arctic Wolf Networks Inc.
                • Arctic Wolf Networks Inc. - Overview
                • Arctic Wolf Networks Inc. - Product / Service
                • Arctic Wolf Networks Inc. - Key offerings
                • SWOT
              • 15.5 AT and T Inc.
                • AT and T Inc. - Overview
                • AT and T Inc. - Business segments
                • AT and T Inc. - Key news
                • AT and T Inc. - Key offerings
                • AT and T Inc. - Segment focus
                • SWOT
              • 15.6 Atos SE
                • Atos SE - Overview
                • Atos SE - Business segments
                • Atos SE - Key news
                • Atos SE - Key offerings
                • Atos SE - Segment focus
                • SWOT
              • 15.7 Check Point Software Technologies Ltd.
                • Check Point Software Technologies Ltd. - Overview
                • Check Point Software Technologies Ltd. - Product / Service
                • Check Point Software Technologies Ltd. - Key news
                • Check Point Software Technologies Ltd. - Key offerings
                • SWOT
              • 15.8 Cloudflare Inc.
                • Cloudflare Inc. - Overview
                • Cloudflare Inc. - Product / Service
                • Cloudflare Inc. - Key news
                • Cloudflare Inc. - Key offerings
                • SWOT
              • 15.9 ConnectWise LLC
                • ConnectWise LLC - Overview
                • ConnectWise LLC - Product / Service
                • ConnectWise LLC - Key offerings
                • SWOT
              • 15.10 Fortinet Inc.
                • Fortinet Inc. - Overview
                • Fortinet Inc. - Product / Service
                • Fortinet Inc. - Key news
                • Fortinet Inc. - Key offerings
                • SWOT
              • 15.11 International Business Machines Corp.
                • International Business Machines Corp. - Overview
                • International Business Machines Corp. - Business segments
                • International Business Machines Corp. - Key news
                • International Business Machines Corp. - Key offerings
                • International Business Machines Corp. - Segment focus
                • SWOT
              • 15.12 Kaseya Ltd.
                • Kaseya Ltd. - Overview
                • Kaseya Ltd. - Product / Service
                • Kaseya Ltd. - Key offerings
                • SWOT
              • 15.13 Nippon Telegraph and Telephone Corp.
                • Nippon Telegraph and Telephone Corp. - Overview
                • Nippon Telegraph and Telephone Corp. - Business segments
                • Nippon Telegraph and Telephone Corp. - Key offerings
                • Nippon Telegraph and Telephone Corp. - Segment focus
                • SWOT
              • 15.14 ProSOC Inc.
                • ProSOC Inc. - Overview
                • ProSOC Inc. - Product / Service
                • ProSOC Inc. - Key offerings
                • SWOT
              • 15.15 SecureWorks Inc.
                • SecureWorks Inc. - Overview
                • SecureWorks Inc. - Product / Service
                • SecureWorks Inc. - Key offerings
                • SWOT
              • 15.16 Suma Soft Pvt. Ltd.
                • Suma Soft Pvt. Ltd. - Overview
                • Suma Soft Pvt. Ltd. - Product / Service
                • Suma Soft Pvt. Ltd. - Key offerings
                • SWOT
              • 15.17 Tata Consultancy Services Ltd.
                • Tata Consultancy Services Ltd. - Overview
                • Tata Consultancy Services Ltd. - Business segments
                • Tata Consultancy Services Ltd. - Key news
                • Tata Consultancy Services Ltd. - Key offerings
                • Tata Consultancy Services Ltd. - Segment focus
                • SWOT
              • 15.18 Verizon Communications Inc.
                • Verizon Communications Inc. - Overview
                • Verizon Communications Inc. - Business segments
                • Verizon Communications Inc. - Key news
                • Verizon Communications Inc. - Key offerings
                • Verizon Communications Inc. - Segment focus
                • SWOT

              16 Appendix

              • 16.1 Scope of the report
                • 16.2 Inclusions and exclusions checklist
                  • Inclusions checklist
                  • Exclusions checklist
                • 16.3 Currency conversion rates for US$
                  • Currency conversion rates for US$
                • 16.4 Research methodology
                  • Research methodology
                • 16.5 Data procurement
                  • Information sources
                • 16.6 Data validation
                  • Data validation
                • 16.7 Validation techniques employed for market sizing
                  • Validation techniques employed for market sizing
                • 16.8 Data synthesis
                  • Data synthesis
                • 16.9 360 degree market analysis
                  • 360 degree market analysis
                • 16.10 List of abbreviations
                  • List of abbreviations

                Research Methodology

                Technavio presents a detailed picture of the market by way of study, synthesis, and summation of data from multiple sources. The analysts have presented the various facets of the market with a particular focus on identifying the key industry influencers. The data thus presented is comprehensive, reliable, and the result of extensive research, both primary and secondary.

                INFORMATION SOURCES

                Primary sources

                • Manufacturers and suppliers
                • Channel partners
                • Industry experts
                • Strategic decision makers

                Secondary sources

                • Industry journals and periodicals
                • Government data
                • Financial reports of key industry players
                • Historical data
                • Press releases

                DATA ANALYSIS

                Data Synthesis

                • Collation of data
                • Estimation of key figures
                • Analysis of derived insights

                Data Validation

                • Triangulation with data models
                • Reference against proprietary databases
                • Corroboration with industry experts

                REPORT WRITING

                Qualitative

                • Market drivers
                • Market challenges
                • Market trends
                • Five forces analysis

                Quantitative

                • Market size and forecast
                • Market segmentation
                • Geographical insights
                • Competitive landscape

                Interested in this report?

                Get your sample now to see our research methodology and insights!

                Download Now

                Frequently Asked Questions

                Soc As A Service market growth will increase by $ 4749.4 mn during 2025-2029.

                The Soc As A Service market is expected to grow at a CAGR of 14.5% during 2025-2029.

                Soc As A Service market is segmented by End-user( Large enterprises, SMEs) Service( Prevention services, Incident response services, Detection services) Deployment( Cloud-based, On-premises, APAC, South America, Middle East and Africa)

                Arctic Wolf Networks Inc., AT and T Inc., Atos SE, Binary Defense Systems Inc., Check Point Software Technologies Ltd., Cloudflare Inc., ConnectWise LLC, CYREBRO, eSentire Inc., Fortinet Inc., International Business Machines Corp., Kaseya Ltd., Nippon Telegraph and Telephone Corp., ProSOC Inc., SecureWorks Inc., SilverSky Inc., Suma Soft Pvt. Ltd., Tata Consultancy Services Ltd., Trustwave Holdings Inc., Verizon Communications Inc. are a few of the key vendors in the Soc As A Service market.

                North America will register the highest growth rate of 40% among the other regions. Therefore, the Soc As A Service market in North America is expected to garner significant business opportunities for the vendors during the forecast period.

                US, Canada, UK, China, Germany, France, India, Japan, Italy, Spain

                • Rising bring-your-own-device and work-from-home modelThe present working environment is the driving factor this market.
                • which the new coronavirus has greatly influenced is the driving factor this market.
                • differs from the traditional approach where employers had complete control over how their employees used technology. Employees were provided customized laptops and cell phones with default configurations to connect to the companys network in accordance with business guidelines. The market in focus is expanding significantly due to the establishment of policies by enterprises to maintain data.Additionally is the driving factor this market.
                • digitization and technological developments have ushered in new trends like choose-your-own-device (CYOD) and remote working is the driving factor this market.
                • which permits employees to use their own devices for work. This includes private networks is the driving factor this market.
                • which fall outside the companys security expertise is the driving factor this market.
                • like mobile hotspots or the Internet. Hence is the driving factor this market.
                • such factors will drive the growth of the market in focus during the forecast period. is the driving factor this market.

                The Soc As A Service market vendors should focus on grabbing business opportunities from the Large enterprises segment as it accounted for the largest market share in the base year.