Smart Weight, Body Composition, And Bmi Scales Market Analysis, Size, and Forecast 2025-2029: North America (US, Canada, and Mexico), Europe (France, Germany, Italy, Russia), APAC (China, Japan, South Korea), South America , and Middle East and Africa

Smart Weight, Body Composition, And Bmi Scales Market Analysis, Size, and Forecast 2025-2029:
North America (US, Canada, and Mexico), Europe (France, Germany, Italy, Russia), APAC (China, Japan, South Korea), South America , and Middle East and Africa

Published: Apr 2025 225 Pages SKU: IRTNTR73170

Market Overview at a Glance

$115.7 Mn
Market Opportunity
5.3%
CAGR
4.9
YoY growth 2024-2025(%)

Smart Weight, Body Composition, And BMI Scales Market Size 2025-2029

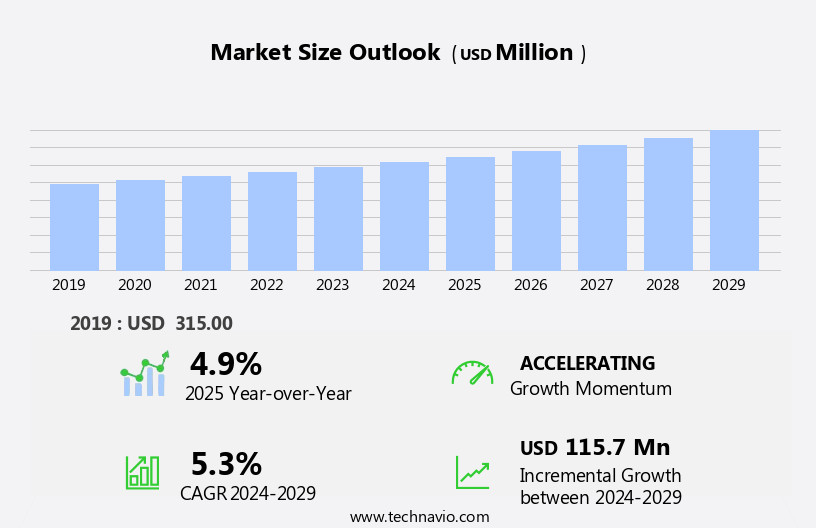
The smart weight, body composition, and bmi scales market size is forecast to increase by USD 115.7 million, at a CAGR of 5.3% between 2024 and 2029.

  • The market is experiencing significant growth, driven by the rising health consciousness among individuals. This trend is fueled by the increasing awareness of the importance of maintaining a healthy weight and body composition. Another key factor propelling market expansion is the innovative features offered by smart scales, such as pregnancy mode, which cater to specific user needs. However, the market faces challenges as well. The proliferation of alternative smart wearable devices and applications poses a threat to the market, as consumers have an abundance of choices for tracking their health metrics.
  • Companies in this market must differentiate themselves by offering unique features and integrating seamlessly with other health and fitness platforms to attract and retain customers. To capitalize on opportunities and navigate challenges effectively, market players should focus on continuous innovation, user-centric design, and strategic partnerships.

What will be the Size of the Smart Weight, Body Composition, And BMI Scales Market during the forecast period?

Smart Weight, Body Composition, And BMI Scales Market Size

Explore in-depth regional segment analysis with market size data - historical 2019-2023 and forecasts 2025-2029 - in the full report.  
Request Free Sample

The smart weight and body composition scale market continues to evolve, driven by advancements in technology and shifting consumer preferences. These devices offer more than just basic weight measurement, providing insights into body composition, muscle mass, body water, bone density, and visceral fat. The market caters to various sectors, including disease prevention, fitness tracking, and health data management. Smart scales integrate user-friendly interfaces and Bluetooth connectivity for seamless data synchronization with mobile apps, allowing for real-time health monitoring and analysis. Marketing strategies focus on personalized feedback, privacy compliance, and user experience (UX) to attract and retain customers.

Differentiation comes from features like segmental body composition analysis, dietary analysis, health coaching, and wellness programs. Regulatory compliance, safety standards, and data security are essential considerations, ensuring the protection of sensitive health information. The market's growth potential is significant, with retail sales and online sales contributing to its expansion. Wellness improvement and weight management remain key applications, while pricing strategies and product differentiation influence market penetration. Manufacturing costs, distribution channels, and software updates impact the competitive landscape. As technology advances, smart scales continue to offer more comprehensive health assessments, integrating with smartphones, wearables, and cloud storage for enhanced functionality and convenience.

How is this Smart Weight, Body Composition, And BMI Scales Industry segmented?

The smart weight, body composition, and bmi scales industry research report provides comprehensive data (region-wise segment analysis), with forecasts and estimates in "USD million" for the period 2025-2029, as well as historical data from 2019-2023 for the following segments.

  • Distribution Channel
    • Offline
    • Online
  • Price
    • Less than USD100
    • More than USD100
  • Type
    • Wi-Fi
    • Bluetooth
  • Application
    • Household
    • Gym
    • Others
  • Geography
    • North America
      • US
      • Canada
      • Mexico
    • Europe
      • France
      • Germany
      • Italy
      • Russia
    • APAC
      • China
      • Japan
      • South Korea
    • Rest of World (ROW)

    By Distribution Channel Insights

    The offline segment is estimated to witness significant growth during the forecast period.

    The market for smart weight, body composition, and BMI scales has seen substantial growth in recent years, with both online and offline channels experiencing significant demand. Online sales enable consumers to purchase these advanced scales from the comfort of their homes, while offline retail outlets provide an opportunity for customers to physically assess the product before making a purchase. Offline channels, including specialty health stores, department stores, hypermarkets, and fitness equipment stores, are particularly effective in reaching a broad consumer base. These retailers often have dedicated sections for health and wellness products, showcasing smart scales alongside other related items.

    User interface and experience, marketing strategies, data synchronization, Bluetooth connectivity, and sensor technology are integral features of these devices, catering to consumers seeking health risk assessments, muscle mass measurement, segmental body composition analysis, and health data management. Wellness programs, health coaching, body water monitoring, smartphone integration, and personalized feedback are additional features that attract consumers. Regulatory compliance, privacy compliance, and data security are essential considerations for manufacturers, ensuring consumer trust and safety. Pricing strategies, product differentiation, and supply chain management are key factors influencing market penetration and growth potential. Target demographics, disease prevention, fitness tracking, and weight management are primary consumer segments.

    Cloud storage, nutrition tracking, consumer segmentation, metabolic rate measurement, and weight tracking are additional features that cater to diverse consumer needs. Battery life, market penetration, data interpretation, software updates, and manufacturing costs are ongoing concerns for manufacturers. The market for smart weight, body composition, and BMI scales continues to evolve, integrating advanced technologies and features to meet the growing demand for personalized health and wellness solutions.

    Smart Weight, Body Composition, And BMI Scales Market Size

    Request Free Sample

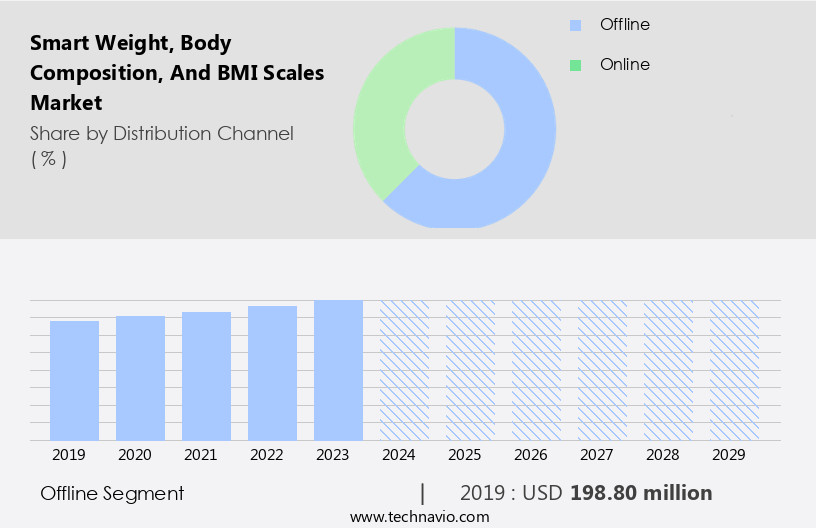
    The Offline segment was valued at USD 198.80 million in 2019 and showed a gradual increase during the forecast period.

    Regional Analysis

    North America is estimated to contribute 35% to the growth of the global market during the forecast period.Technavio’s analysts have elaborately explained the regional trends and drivers that shape the market during the forecast period.

    Smart Weight, Body Composition, And BMI Scales Market Share by Geography

     Request Free Sample

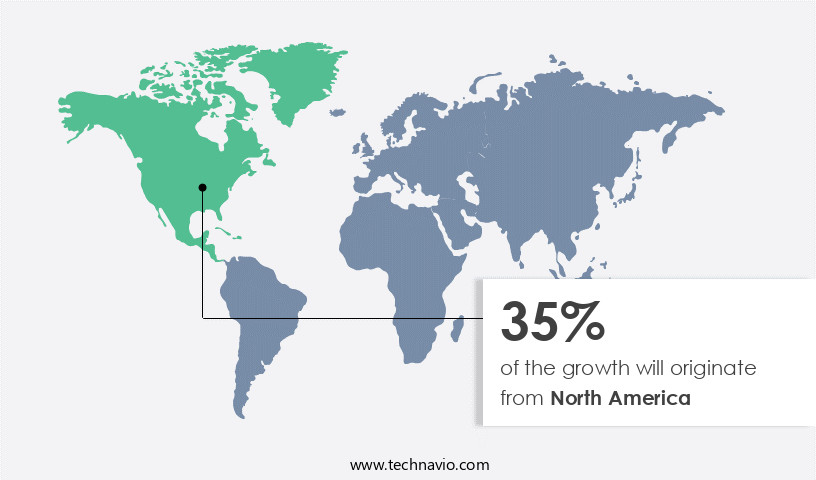
    In North America, the market for smart weight, body composition, and BMI scales is experiencing significant growth, driven by technological advancements and increased purchasing power. Consumers are increasingly prioritizing health and fitness, leading to a high demand for innovative technologies that offer health risk assessments, user-friendly interfaces, and seamless data synchronization. Bluetooth connectivity, sensor technology, and smartphone integration are key features that enhance the user experience. Marketing strategies focusing on personalized feedback, wellness programs, and health coaching have resonated with consumers, driving retail sales. The market's growth potential is further boosted by cloud storage, nutrition tracking, and consumer segmentation, enabling users to manage their health data effectively.

    Regulatory compliance, data security, and privacy concerns are addressed through robust manufacturing processes and software updates. The market's growth is also fueled by the integration of advanced features, such as muscle mass measurement, segmental body composition analysis, metabolic rate assessment, and bone density measurement. These features cater to the diverse needs of various demographics, including athletes, seniors, and individuals with specific health conditions. The market's growth is further supported by the distribution channels, which include both online and retail sales. Product differentiation is achieved through pricing strategies, battery life, and wi-fi connectivity. Wellness improvement and fitness tracking are major selling points, with personalized feedback and electrode placement ensuring accurate and reliable results.

    The market's expansion is expected to continue, with market penetration and data interpretation playing crucial roles in its success. Despite the market's growth, challenges remain, including manufacturing costs, safety standards, and competition. However, the potential benefits of improved health, disease prevention, and weight management make the investment in smart weight, body composition, and BMI scales a worthwhile one.

    Market Dynamics

    Our researchers analyzed the data with 2024 as the base year, along with the key drivers, trends, and challenges. A holistic analysis of drivers will help companies refine their marketing strategies to gain a competitive advantage.

    In the ever-evolving health and wellness landscape, the market continues to gain significant traction. These advanced devices offer more than just basic weight measurements, integrating body fat analysis, muscle mass evaluation, and BMI calculation. Smart scales connect to apps, providing users with personalized insights and trends over time. They often sync with fitness trackers and health records, creating a comprehensive health management system. With features like wireless connectivity, voice commands, and customized coaching, these scales cater to diverse user needs. The market's growth is fueled by increasing consumer awareness and the convenience of having all health metrics at one's fingertips. Smart scales are not just tools for weight management but comprehensive health companions.

    What are the key market drivers leading to the rise in the adoption of Smart Weight, Body Composition, And BMI Scales Industry?

    • The increasing awareness and concern for health among consumers serve as the primary catalyst for market growth. 

    • The market is experiencing significant growth due to the increasing health consciousness among consumers. These advanced scales provide more than just weight measurements, offering insights into body composition and BMI through features such as electrode placement for body fat analysis and bone density measurement. Privacy compliance is a crucial factor in the market, ensuring user data is securely stored and interpreted through data analytics. Smart scales are often connected to mobile apps, enabling users to track their progress and receive personalized feedback. Long battery life is another important consideration for consumers, ensuring they can consistently monitor their health data.
    • Market penetration is driven by the affordability of these devices, which are becoming increasingly cost-effective due to manufacturing advancements and software updates. Distribution channels are expanding to include both online and offline retailers, making smart scales more accessible to a wider audience. Data interpretation is a key selling point for these devices, with users seeking to understand their health data and use it to improve their overall wellness. Manufacturing costs are decreasing, making it easier for companies to produce high-quality smart scales at competitive prices.

    What are the market trends shaping the Smart Weight, Body Composition, And BMI Scales Industry?

    • Professional trend in the market includes the implementation of innovative features, such as a pregnancy mode. This mode is becoming increasingly popular among consumers.

    • Smart weight, body composition, and BMI scales have gained significant traction in the market due to their ability to provide accurate and advanced health measurements. These scales cater to various target demographics, including individuals focused on disease prevention and fitness tracking. The integration of data security features ensures the privacy and safety of users' health information. Advanced body fat percentage and weight tracking capabilities enable users to monitor their progress towards weight management goals. Wi-fi connectivity facilitates seamless data transfer and synchronization with fitness applications and wearables. Customer service and safety standards are essential considerations for manufacturers, ensuring user satisfaction and trust.
    • Some scales offer pregnancy-mode features, which efficiently track the health parameters of expectant mothers and provide information about their pregnancy progress. The market is expected to grow due to continuous product innovations and the increasing demand for advanced health monitoring solutions. These scales offer an immersive and harmonious user experience, emphasizing ease of use and accuracy. Smart weight, body composition, and BMI scales are not only essential tools for personal health management but also contribute to overall well-being by providing valuable insights into various health aspects, including visceral fat measurement and BMI assessment.

    What challenges does the Smart Weight, Body Composition, And BMI Scales Industry face during its growth?

    • The expansion of various smart wearable devices and their accompanying applications poses a significant challenge to the industry's growth trajectory. 

    • The market confronts increasing competition from alternative smart wearable devices and applications. As technology advances, the market is witnessing a rise in the availability and popularity of various smart devices, such as smartwatches and fitness trackers, which offer similar features to these scales. These wearable devices are equipped with sensors to monitor various health metrics, including weight, body composition, and heart rate, making them a preferred choice for consumers due to their diverse functionalities and added convenience. Moreover, marketing strategies, data synchronization, and Bluetooth connectivity are crucial factors influencing the market's growth. User interface (UI) and user experience (UX) play a significant role in attracting and retaining customers.
    • Sensor technology, dietary analysis, and health data management are other essential aspects driving the market's growth. Regulatory compliance is a critical consideration to ensure the safety and accuracy of these devices. Segmental body composition analysis is an emerging trend, offering more detailed insights into muscle mass and overall health. Despite the competition, the market continues to grow due to the increasing awareness of health and wellness, the convenience of smart devices, and the need for accurate health data management.

    Exclusive Customer Landscape

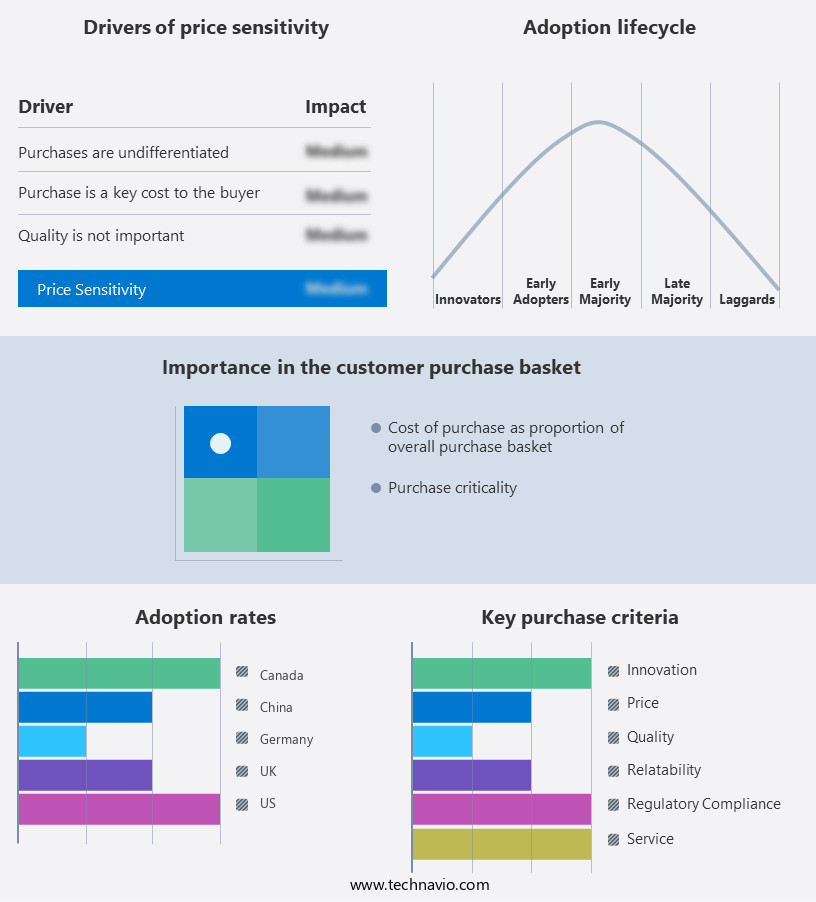
    The smart weight, body composition, and bmi scales market forecasting report includes the adoption lifecycle of the market, covering from the innovator’s stage to the laggard’s stage. It focuses on adoption rates in different regions based on penetration. Furthermore, the smart weight, body composition, and bmi scales market report also includes key purchase criteria and drivers of price sensitivity to help companies evaluate and develop their market growth analysis strategies.

    Smart Weight, Body Composition, And BMI Scales Market Share by Geography

     Customer Landscape

    Key Companies & Market Insights

    Companies are implementing various strategies, such as strategic alliances, smart weight, body composition, and bmi scales market forecast, partnerships, mergers and acquisitions, geographical expansion, and product/service launches, to enhance their presence in the industry.

    Actofit Wearables - This company specializes in advanced weight and body composition measurement tools. Our product line includes the Smart Scale Pro Max, Actofit Smart Scale PRIME, and Smartscale Pro. These innovative scales provide accurate weight measurements, as well as detailed body composition analysis. By tracking these metrics, users can monitor their progress toward health goals and maintain optimal wellness. These smart scales offer enhanced functionality, ensuring users stay informed and motivated in their fitness journey.

    The industry research and growth report includes detailed analyses of the competitive landscape of the market and information about key companies, including:

    • Actofit Wearables
    • Anker Technology UK Ltd.
    • BeatXP
    • Blipcare
    • Fitbit LLC
    • Garmin Ltd.
    • Huawei Technologies Co. Ltd.
    • iHealth Labs Inc.
    • Koogeek Inc.
    • Nureca Ltd.
    • PICOOC Technology Co. Ltd.
    • Polar Electro Oy
    • Pyle USA Sound Around Inc.
    • Qardio Inc.
    • Tanita Corp.
    • Vandelay Brands Ltd.
    • Wahoo Fitness LLC
    • Withings
    • Wyze Labs Inc.
    • Xiaomi Inc.

    Qualitative and quantitative analysis of companies has been conducted to help clients understand the wider business environment as well as the strengths and weaknesses of key industry players. Data is qualitatively analyzed to categorize companies as pure play, category-focused, industry-focused, and diversified; it is quantitatively analyzed to categorize companies as dominant, leading, strong, tentative, and weak.

    Recent Development and News in Smart Weight, Body Composition, And BMI Scales Market

    • In January 2024, Withings, a leading digital health company, launched the Body+ scale, which not only measures weight but also provides body composition analysis and tracking of trends in body fat percentage, water intake, and sleep patterns (Withings Press Release).
    • In March 2024, Fitbit, a leading wearable technology company, announced a strategic partnership with the American Heart Association to integrate heart health metrics into their smart scales, aiming to promote heart health monitoring and wellness (Fitbit Press Release).
    • In April 2025, Evolveia, a smart scale manufacturer, raised USD12 million in a Series B funding round led by Sequoia India, to expand its product line and enter new markets, including Europe and Asia (Crunchbase).
    • In May 2025, the U.S. Food and Drug Administration (FDA) approved the marketing of the iHealth Body Analysis Scale 2, which can measure weight, body mass index (BMI), body fat percentage, and water percentage, marking the first FDA clearance for a smart scale with these capabilities (FDA Press Release).

    Research Analyst Overview

    • The market is witnessing significant growth, driven by the integration of advanced features such as sleep monitoring, heart rate monitoring, and hydration monitoring. Subscription models are gaining popularity, offering users continuous access to health indicators, goal setting, calorie counting, and macro tracking. Compliance with stringent regulatory standards ensures the accuracy and reliability of these devices. Product testing and quality control are crucial elements in the market, with companies focusing on user profiles, activity tracking, and data visualization to enhance customer retention. Nutritional guidance and exercise recommendations are essential components of weight loss programs, which are increasingly being offered through cloud services and analytics dashboards.
    • Feedback loops and progress tracking enable users to monitor their fitness goals effectively, while platform compatibility with mobile operating systems facilitates seamless integration into daily routines. Report generation and data visualization tools provide valuable insights, helping users make informed decisions about their health and wellness journey. In summary, the market is dynamic, with a focus on advanced features, user experience, and regulatory compliance. These devices offer valuable insights into health indicators, enabling users to set and achieve fitness goals and improve overall well-being.

    Dive into Technavio’s robust research methodology, blending expert interviews, extensive data synthesis, and validated models for unparalleled Smart Weight, Body Composition, And BMI Scales Market insights. See full methodology.

    Market Scope

    Report Coverage

    Details

    Page number

    225

    Base year

    2024

    Historic period

    2019-2023

    Forecast period

    2025-2029

    Growth momentum & CAGR

    Accelerate at a CAGR of 5.3%

    Market growth 2025-2029

    USD 115.7 million

    Market structure

    Fragmented

    YoY growth 2024-2025(%)

    4.9

    Key countries

    US, China, Japan, Germany, France, South Korea, Canada, Russia, Mexico, and Italy

    Competitive landscape

    Leading Companies, Market Positioning of Companies, Competitive Strategies, and Industry Risks

    Request Free Sample

    What are the Key Data Covered in this Smart Weight, Body Composition, And BMI Scales Market Research and Growth Report?

    • CAGR of the Smart Weight, Body Composition, And BMI Scales industry during the forecast period
    • Detailed information on factors that will drive the growth and forecasting between 2025 and 2029
    • Precise estimation of the size of the market and its contribution of the industry in focus to the parent market
    • Accurate predictions about upcoming growth and trends and changes in consumer behaviour
    • Growth of the market across North America, Europe, APAC, South America, and Middle East and Africa
    • Thorough analysis of the market’s competitive landscape and detailed information about companies
    • Comprehensive analysis of factors that will challenge the smart weight, body composition, and bmi scales market growth of industry companies

    We can help! Our analysts can customize this smart weight, body composition, and bmi scales market research report to meet your requirements.

    Get in touch


    1 Executive Summary

    • 1.1 Market overview
      • Executive Summary - Chart on Market Overview
      • Executive Summary - Data Table on Market Overview
      • Executive Summary - Chart on Global Market Characteristics
      • Executive Summary - Chart on Market by Geography
      • Executive Summary - Chart on Market Segmentation by Distribution Channel
      • Executive Summary - Chart on Market Segmentation by Price
      • Executive Summary - Chart on Market Segmentation by Type
      • Executive Summary - Chart on Market Segmentation by Application
      • Executive Summary - Chart on Incremental Growth
      • Executive Summary - Data Table on Incremental Growth
      • Executive Summary - Chart on Company Market Positioning

    2 Technavio Analysis

    • 2.1 Analysis of price sensitivity, lifecycle, customer purchase basket, adoption rates, and purchase criteria
      • Analysis of price sensitivity, lifecycle, customer purchase basket, adoption rates, and purchase criteria
    • 2.2 Criticality of inputs and Factors of differentiation
      • Overview on criticality of inputs and factors of differentiation
    • 2.3 Factors of disruption
      • Overview on factors of disruption
    • 2.4 Impact of drivers and challenges
      • Impact of drivers and challenges in 2024 and 2029

    3 Market Landscape

    • 3.1 Market ecosystem
      • Parent Market
      • Data Table on - Parent Market
    • 3.2 Market characteristics
      • Market characteristics analysis
    • 3.3 Value chain analysis
      • Value chain analysis

    4 Market Sizing

    • 4.1 Market definition
      • Offerings of companies included in the market definition
    • 4.2 Market segment analysis
      • Market segments
    • 4.3 Market size 2024
      • 4.4 Market outlook: Forecast for 2024-2029
        • Chart on Global - Market size and forecast 2024-2029 ($ million)
        • Data Table on Global - Market size and forecast 2024-2029 ($ million)
        • Chart on Global Market: Year-over-year growth 2024-2029 (%)
        • Data Table on Global Market: Year-over-year growth 2024-2029 (%)

      5 Historic Market Size

      • 5.1 Global Smart Weight, Body Composition, And BMI Scales Market 2019 - 2023
        • Historic Market Size - Data Table on Global Smart Weight, Body Composition, And BMI Scales Market 2019 - 2023 ($ million)
      • 5.2 Distribution Channel segment analysis 2019 - 2023
        • Historic Market Size - Distribution Channel Segment 2019 - 2023 ($ million)
      • 5.3 Price segment analysis 2019 - 2023
        • Historic Market Size - Price Segment 2019 - 2023 ($ million)
      • 5.4 Type segment analysis 2019 - 2023
        • Historic Market Size - Type Segment 2019 - 2023 ($ million)
      • 5.5 Application segment analysis 2019 - 2023
        • Historic Market Size - Application Segment 2019 - 2023 ($ million)
      • 5.6 Geography segment analysis 2019 - 2023
        • Historic Market Size - Geography Segment 2019 - 2023 ($ million)
      • 5.7 Country segment analysis 2019 - 2023
        • Historic Market Size - Country Segment 2019 - 2023 ($ million)

      6 Qualitative Analysis

      • 6.1 Impact of AI on Global Smart Weight, Body Composition, and BMI Scales Market

        7 Five Forces Analysis

        • 7.1 Five forces summary
          • Five forces analysis - Comparison between 2024 and 2029
        • 7.2 Bargaining power of buyers
          • Bargaining power of buyers - Impact of key factors 2024 and 2029
        • 7.3 Bargaining power of suppliers
          • Bargaining power of suppliers - Impact of key factors in 2024 and 2029
        • 7.4 Threat of new entrants
          • Threat of new entrants - Impact of key factors in 2024 and 2029
        • 7.5 Threat of substitutes
          • Threat of substitutes - Impact of key factors in 2024 and 2029
        • 7.6 Threat of rivalry
          • Threat of rivalry - Impact of key factors in 2024 and 2029
        • 7.7 Market condition
          • Chart on Market condition - Five forces 2024 and 2029

        8 Market Segmentation by Distribution Channel

        • 8.1 Market segments
          • Chart on Distribution Channel - Market share 2024-2029 (%)
          • Data Table on Distribution Channel - Market share 2024-2029 (%)
        • 8.2 Comparison by Distribution Channel
          • Chart on Comparison by Distribution Channel
          • Data Table on Comparison by Distribution Channel
        • 8.3 Offline - Market size and forecast 2024-2029
          • Chart on Offline - Market size and forecast 2024-2029 ($ million)
          • Data Table on Offline - Market size and forecast 2024-2029 ($ million)
          • Chart on Offline - Year-over-year growth 2024-2029 (%)
          • Data Table on Offline - Year-over-year growth 2024-2029 (%)
        • 8.4 Online - Market size and forecast 2024-2029
          • Chart on Online - Market size and forecast 2024-2029 ($ million)
          • Data Table on Online - Market size and forecast 2024-2029 ($ million)
          • Chart on Online - Year-over-year growth 2024-2029 (%)
          • Data Table on Online - Year-over-year growth 2024-2029 (%)
        • 8.5 Market opportunity by Distribution Channel
          • Market opportunity by Distribution Channel ($ million)
          • Data Table on Market opportunity by Distribution Channel ($ million)

        9 Market Segmentation by Price

        • 9.1 Market segments
          • Chart on Price - Market share 2024-2029 (%)
          • Data Table on Price - Market share 2024-2029 (%)
        • 9.2 Comparison by Price
          • Chart on Comparison by Price
          • Data Table on Comparison by Price
        • 9.3 Less than $100 - Market size and forecast 2024-2029
          • Chart on Less than $100 - Market size and forecast 2024-2029 ($ million)
          • Data Table on Less than $100 - Market size and forecast 2024-2029 ($ million)
          • Chart on Less than $100 - Year-over-year growth 2024-2029 (%)
          • Data Table on Less than $100 - Year-over-year growth 2024-2029 (%)
        • 9.4 More than $100 - Market size and forecast 2024-2029
          • Chart on More than $100 - Market size and forecast 2024-2029 ($ million)
          • Data Table on More than $100 - Market size and forecast 2024-2029 ($ million)
          • Chart on More than $100 - Year-over-year growth 2024-2029 (%)
          • Data Table on More than $100 - Year-over-year growth 2024-2029 (%)
        • 9.5 Market opportunity by Price
          • Market opportunity by Price ($ million)
          • Data Table on Market opportunity by Price ($ million)

        10 Market Segmentation by Type

        • 10.1 Market segments
          • Chart on Type - Market share 2024-2029 (%)
          • Data Table on Type - Market share 2024-2029 (%)
        • 10.2 Comparison by Type
          • Chart on Comparison by Type
          • Data Table on Comparison by Type
        • 10.3 Wi-Fi - Market size and forecast 2024-2029
          • Chart on Wi-Fi - Market size and forecast 2024-2029 ($ million)
          • Data Table on Wi-Fi - Market size and forecast 2024-2029 ($ million)
          • Chart on Wi-Fi - Year-over-year growth 2024-2029 (%)
          • Data Table on Wi-Fi - Year-over-year growth 2024-2029 (%)
        • 10.4 Bluetooth - Market size and forecast 2024-2029
          • Chart on Bluetooth - Market size and forecast 2024-2029 ($ million)
          • Data Table on Bluetooth - Market size and forecast 2024-2029 ($ million)
          • Chart on Bluetooth - Year-over-year growth 2024-2029 (%)
          • Data Table on Bluetooth - Year-over-year growth 2024-2029 (%)
        • 10.5 Market opportunity by Type
          • Market opportunity by Type ($ million)
          • Data Table on Market opportunity by Type ($ million)

        11 Market Segmentation by Application

        • 11.1 Market segments
          • Chart on Application - Market share 2024-2029 (%)
          • Data Table on Application - Market share 2024-2029 (%)
        • 11.2 Comparison by Application
          • Chart on Comparison by Application
          • Data Table on Comparison by Application
        • 11.3 Household - Market size and forecast 2024-2029
          • Chart on Household - Market size and forecast 2024-2029 ($ million)
          • Data Table on Household - Market size and forecast 2024-2029 ($ million)
          • Chart on Household - Year-over-year growth 2024-2029 (%)
          • Data Table on Household - Year-over-year growth 2024-2029 (%)
        • 11.4 Gym - Market size and forecast 2024-2029
          • Chart on Gym - Market size and forecast 2024-2029 ($ million)
          • Data Table on Gym - Market size and forecast 2024-2029 ($ million)
          • Chart on Gym - Year-over-year growth 2024-2029 (%)
          • Data Table on Gym - Year-over-year growth 2024-2029 (%)
        • 11.5 Others - Market size and forecast 2024-2029
          • Chart on Others - Market size and forecast 2024-2029 ($ million)
          • Data Table on Others - Market size and forecast 2024-2029 ($ million)
          • Chart on Others - Year-over-year growth 2024-2029 (%)
          • Data Table on Others - Year-over-year growth 2024-2029 (%)
        • 11.6 Market opportunity by Application
          • Market opportunity by Application ($ million)
          • Data Table on Market opportunity by Application ($ million)

        12 Customer Landscape

        • 12.1 Customer landscape overview
          • Analysis of price sensitivity, lifecycle, customer purchase basket, adoption rates, and purchase criteria

        13 Geographic Landscape

        • 13.1 Geographic segmentation
          • Chart on Market share by geography 2024-2029 (%)
          • Data Table on Market share by geography 2024-2029 (%)
        • 13.2 Geographic comparison
          • Chart on Geographic comparison
          • Data Table on Geographic comparison
        • 13.3 North America - Market size and forecast 2024-2029
          • Chart on North America - Market size and forecast 2024-2029 ($ million)
          • Data Table on North America - Market size and forecast 2024-2029 ($ million)
          • Chart on North America - Year-over-year growth 2024-2029 (%)
          • Data Table on North America - Year-over-year growth 2024-2029 (%)
        • 13.4 Europe - Market size and forecast 2024-2029
          • Chart on Europe - Market size and forecast 2024-2029 ($ million)
          • Data Table on Europe - Market size and forecast 2024-2029 ($ million)
          • Chart on Europe - Year-over-year growth 2024-2029 (%)
          • Data Table on Europe - Year-over-year growth 2024-2029 (%)
        • 13.5 APAC - Market size and forecast 2024-2029
          • Chart on APAC - Market size and forecast 2024-2029 ($ million)
          • Data Table on APAC - Market size and forecast 2024-2029 ($ million)
          • Chart on APAC - Year-over-year growth 2024-2029 (%)
          • Data Table on APAC - Year-over-year growth 2024-2029 (%)
        • 13.6 South America - Market size and forecast 2024-2029
          • Chart on South America - Market size and forecast 2024-2029 ($ million)
          • Data Table on South America - Market size and forecast 2024-2029 ($ million)
          • Chart on South America - Year-over-year growth 2024-2029 (%)
          • Data Table on South America - Year-over-year growth 2024-2029 (%)
        • 13.7 Middle East and Africa - Market size and forecast 2024-2029
          • Chart on Middle East and Africa - Market size and forecast 2024-2029 ($ million)
          • Data Table on Middle East and Africa - Market size and forecast 2024-2029 ($ million)
          • Chart on Middle East and Africa - Year-over-year growth 2024-2029 (%)
          • Data Table on Middle East and Africa - Year-over-year growth 2024-2029 (%)
        • 13.8 US - Market size and forecast 2024-2029
          • Chart on US - Market size and forecast 2024-2029 ($ million)
          • Data Table on US - Market size and forecast 2024-2029 ($ million)
          • Chart on US - Year-over-year growth 2024-2029 (%)
          • Data Table on US - Year-over-year growth 2024-2029 (%)
        • 13.9 China - Market size and forecast 2024-2029
          • Chart on China - Market size and forecast 2024-2029 ($ million)
          • Data Table on China - Market size and forecast 2024-2029 ($ million)
          • Chart on China - Year-over-year growth 2024-2029 (%)
          • Data Table on China - Year-over-year growth 2024-2029 (%)
        • 13.10 Japan - Market size and forecast 2024-2029
          • Chart on Japan - Market size and forecast 2024-2029 ($ million)
          • Data Table on Japan - Market size and forecast 2024-2029 ($ million)
          • Chart on Japan - Year-over-year growth 2024-2029 (%)
          • Data Table on Japan - Year-over-year growth 2024-2029 (%)
        • 13.11 Germany - Market size and forecast 2024-2029
          • Chart on Germany - Market size and forecast 2024-2029 ($ million)
          • Data Table on Germany - Market size and forecast 2024-2029 ($ million)
          • Chart on Germany - Year-over-year growth 2024-2029 (%)
          • Data Table on Germany - Year-over-year growth 2024-2029 (%)
        • 13.12 South Korea - Market size and forecast 2024-2029
          • Chart on South Korea - Market size and forecast 2024-2029 ($ million)
          • Data Table on South Korea - Market size and forecast 2024-2029 ($ million)
          • Chart on South Korea - Year-over-year growth 2024-2029 (%)
          • Data Table on South Korea - Year-over-year growth 2024-2029 (%)
        • 13.13 France - Market size and forecast 2024-2029
          • Chart on France - Market size and forecast 2024-2029 ($ million)
          • Data Table on France - Market size and forecast 2024-2029 ($ million)
          • Chart on France - Year-over-year growth 2024-2029 (%)
          • Data Table on France - Year-over-year growth 2024-2029 (%)
        • 13.14 Canada - Market size and forecast 2024-2029
          • Chart on Canada - Market size and forecast 2024-2029 ($ million)
          • Data Table on Canada - Market size and forecast 2024-2029 ($ million)
          • Chart on Canada - Year-over-year growth 2024-2029 (%)
          • Data Table on Canada - Year-over-year growth 2024-2029 (%)
        • 13.15 Russia - Market size and forecast 2024-2029
          • Chart on Russia - Market size and forecast 2024-2029 ($ million)
          • Data Table on Russia - Market size and forecast 2024-2029 ($ million)
          • Chart on Russia - Year-over-year growth 2024-2029 (%)
          • Data Table on Russia - Year-over-year growth 2024-2029 (%)
        • 13.16 Mexico - Market size and forecast 2024-2029
          • Chart on Mexico - Market size and forecast 2024-2029 ($ million)
          • Data Table on Mexico - Market size and forecast 2024-2029 ($ million)
          • Chart on Mexico - Year-over-year growth 2024-2029 (%)
          • Data Table on Mexico - Year-over-year growth 2024-2029 (%)
        • 13.17 Italy - Market size and forecast 2024-2029
          • Chart on Italy - Market size and forecast 2024-2029 ($ million)
          • Data Table on Italy - Market size and forecast 2024-2029 ($ million)
          • Chart on Italy - Year-over-year growth 2024-2029 (%)
          • Data Table on Italy - Year-over-year growth 2024-2029 (%)
        • 13.18 Market opportunity by geography
          • Market opportunity by geography ($ million)
          • Data Tables on Market opportunity by geography ($ million)

        14 Drivers, Challenges, and Opportunity/Restraints

        • 14.1 Market drivers
          • 14.2 Market challenges
            • 14.3 Impact of drivers and challenges
              • Impact of drivers and challenges in 2024 and 2029
            • 14.4 Market opportunities/restraints

              15 Competitive Landscape

              • 15.1 Overview
                • 15.2 Competitive Landscape
                  • Overview on criticality of inputs and factors of differentiation
                • 15.3 Landscape disruption
                  • Overview on factors of disruption
                • 15.4 Industry risks
                  • Impact of key risks on business

                16 Competitive Analysis

                • 16.1 Companies profiled
                  • Companies covered
                • 16.2 Company ranking index
                  • Company ranking index
                • 16.3 Market positioning of companies
                  • Matrix on companies position and classification
                • 16.4 Actofit Wearables
                  • Actofit Wearables - Overview
                  • Actofit Wearables - Product / Service
                  • Actofit Wearables - Key offerings
                  • SWOT
                • 16.5 Blipcare
                  • Blipcare - Overview
                  • Blipcare - Product / Service
                  • Blipcare - Key offerings
                  • SWOT
                • 16.6 Fitbit LLC
                  • Fitbit LLC - Overview
                  • Fitbit LLC - Product / Service
                  • Fitbit LLC - Key offerings
                  • SWOT
                • 16.7 Garmin Ltd.
                  • Garmin Ltd. - Overview
                  • Garmin Ltd. - Business segments
                  • Garmin Ltd. - Key news
                  • Garmin Ltd. - Key offerings
                  • Garmin Ltd. - Segment focus
                  • SWOT
                • 16.8 Huawei Technologies Co. Ltd.
                  • Huawei Technologies Co. Ltd. - Overview
                  • Huawei Technologies Co. Ltd. - Product / Service
                  • Huawei Technologies Co. Ltd. - Key news
                  • Huawei Technologies Co. Ltd. - Key offerings
                  • SWOT
                • 16.9 iHealth Labs Inc.
                  • iHealth Labs Inc. - Overview
                  • iHealth Labs Inc. - Product / Service
                  • iHealth Labs Inc. - Key offerings
                  • SWOT
                • 16.10 Koogeek Inc.
                  • Koogeek Inc. - Overview
                  • Koogeek Inc. - Product / Service
                  • Koogeek Inc. - Key offerings
                  • SWOT
                • 16.11 PICOOC Technology Co. Ltd.
                  • PICOOC Technology Co. Ltd. - Overview
                  • PICOOC Technology Co. Ltd. - Product / Service
                  • PICOOC Technology Co. Ltd. - Key offerings
                  • SWOT
                • 16.12 Polar Electro Oy
                  • Polar Electro Oy - Overview
                  • Polar Electro Oy - Product / Service
                  • Polar Electro Oy - Key offerings
                  • SWOT
                • 16.13 Pyle USA Sound Around Inc.
                  • Pyle USA Sound Around Inc. - Overview
                  • Pyle USA Sound Around Inc. - Product / Service
                  • Pyle USA Sound Around Inc. - Key offerings
                  • SWOT
                • 16.14 Qardio Inc.
                  • Qardio Inc. - Overview
                  • Qardio Inc. - Product / Service
                  • Qardio Inc. - Key offerings
                  • SWOT
                • 16.15 Tanita Corp.
                  • Tanita Corp. - Overview
                  • Tanita Corp. - Product / Service
                  • Tanita Corp. - Key offerings
                  • SWOT
                • 16.16 Wahoo Fitness LLC
                  • Wahoo Fitness LLC - Overview
                  • Wahoo Fitness LLC - Product / Service
                  • Wahoo Fitness LLC - Key offerings
                  • SWOT
                • 16.17 Withings
                  • Withings - Overview
                  • Withings - Product / Service
                  • Withings - Key offerings
                  • SWOT
                • 16.18 Xiaomi Inc.
                  • Xiaomi Inc. - Overview
                  • Xiaomi Inc. - Business segments
                  • Xiaomi Inc. - Key news
                  • Xiaomi Inc. - Key offerings
                  • Xiaomi Inc. - Segment focus
                  • SWOT

                17 Appendix

                • 17.1 Scope of the report
                  • 17.2 Inclusions and exclusions checklist
                    • Inclusions checklist
                    • Exclusions checklist
                  • 17.3 Currency conversion rates for US$
                    • Currency conversion rates for US$
                  • 17.4 Research methodology
                    • Research methodology
                  • 17.5 Data procurement
                    • Information sources
                  • 17.6 Data validation
                    • Data validation
                  • 17.7 Validation techniques employed for market sizing
                    • Validation techniques employed for market sizing
                  • 17.8 Data synthesis
                    • Data synthesis
                  • 17.9 360 degree market analysis
                    • 360 degree market analysis
                  • 17.10 List of abbreviations
                    • List of abbreviations

                  Research Methodology

                  Technavio presents a detailed picture of the market by way of study, synthesis, and summation of data from multiple sources. The analysts have presented the various facets of the market with a particular focus on identifying the key industry influencers. The data thus presented is comprehensive, reliable, and the result of extensive research, both primary and secondary.

                  INFORMATION SOURCES

                  Primary sources

                  • Manufacturers and suppliers
                  • Channel partners
                  • Industry experts
                  • Strategic decision makers

                  Secondary sources

                  • Industry journals and periodicals
                  • Government data
                  • Financial reports of key industry players
                  • Historical data
                  • Press releases

                  DATA ANALYSIS

                  Data Synthesis

                  • Collation of data
                  • Estimation of key figures
                  • Analysis of derived insights

                  Data Validation

                  • Triangulation with data models
                  • Reference against proprietary databases
                  • Corroboration with industry experts

                  REPORT WRITING

                  Qualitative

                  • Market drivers
                  • Market challenges
                  • Market trends
                  • Five forces analysis

                  Quantitative

                  • Market size and forecast
                  • Market segmentation
                  • Geographical insights
                  • Competitive landscape

                  Interested in this report?

                  Get your sample now to see our research methodology and insights!

                  Download Now

                  Frequently Asked Questions

                  Smart Weight, Body Composition, And Bmi Scales market growth will increase by $ 115.7 mn during 2025-2029.

                  The Smart Weight, Body Composition, And Bmi Scales market is expected to grow at a CAGR of 5.3% during 2025-2029.

                  Smart Weight, Body Composition, And Bmi Scales market is segmented by Distribution Channel( Offline, Online) Price( Less than $100, More than $100, APAC, South America, Middle East and Africa) Type( Wi-Fi, Bluetooth, APAC, South America, Middle East and Africa)

                  Actofit Wearables, Anker Technology UK Ltd., BeatXP, Blipcare, Fitbit LLC, Garmin Ltd., Huawei Technologies Co. Ltd., iHealth Labs Inc., Koogeek Inc., Nureca Ltd., PICOOC Technology Co. Ltd., Polar Electro Oy, Pyle USA Sound Around Inc., Qardio Inc., Tanita Corp., Vandelay Brands Ltd., Wahoo Fitness LLC, Withings, Wyze Labs Inc., Xiaomi Inc. are a few of the key vendors in the Smart Weight, Body Composition, And Bmi Scales market.

                  North America will register the highest growth rate of 35% among the other regions. Therefore, the Smart Weight, Body Composition, And Bmi Scales market in North America is expected to garner significant business opportunities for the vendors during the forecast period.

                  US, China, Japan, Germany, France, South Korea, Canada, Russia, Mexico, Italy

                  • Rising health consciousness among peopleThe growing trend of health consciousness is playing a significant role in driving the growth of the global smart weight is the driving factor this market.
                  • body composition is the driving factor this market.
                  • and BMI scales market. As people are becoming more aware of the importance of maintaining a healthy lifestyle is the driving factor this market.
                  • they are actively seeking tools and devices that can help them monitor their body weight is the driving factor this market.
                  • composition is the driving factor this market.
                  • and BMI accurately and conveniently. Smart weight scales offer advanced features that go beyond traditional weighing scales by providing users with comprehensive insights into their overall health and fitness levels. These scales are usually equipped with connectivity options such as Bluetooth or Wi-Fi is the driving factor this market.
                  • allowing users to sync their data to mobile applications or fitness trackers. This enables individuals to track their weight is the driving factor this market.
                  • body composition (such as muscle mass is the driving factor this market.
                  • body fat percentage is the driving factor this market.
                  • bone mass) is the driving factor this market.
                  • and BMI over time is the driving factor this market.
                  • empowering them to make informed decisions regarding their wellness and fitness goals.The increasing prevalence of chronic diseases such as obesity is the driving factor this market.
                  • diabetes is the driving factor this market.
                  • and cardiovascular disorders is also contributing to the rising demand for smart weight scales. These devices enable individuals to monitor their weight and body composition more effectively and manage their health conditions accordingly. In addition is the driving factor this market.
                  • the integration of artificial intelligence and machine learning technologies in these scales allows for personalized recommendations and insights based on collected data is the driving factor this market.
                  • further enhancing the user experience and outcomes. Moreover is the driving factor this market.
                  • the availability of various smart weights is the driving factor this market.
                  • body composition is the driving factor this market.
                  • and BMI scales in different price ranges and designs is widening the scope of consumer adoption. The market in focus is witnessing the launch of innovative products with sleek designs is the driving factor this market.
                  • intuitive interfaces is the driving factor this market.
                  • and user-friendly features is the driving factor this market.
                  • attracting consumers who prioritize both functionality and aesthetics. Increased health consciousness is the driving factor this market.
                  • coupled with product utility awareness is the driving factor this market.
                  • will contribute to the growth of the global smart weight is the driving factor this market.
                  • body composition is the driving factor this market.
                  • and BMI scales market during the forecast period. is the driving factor this market.

                  The Smart Weight, Body Composition, And Bmi Scales market vendors should focus on grabbing business opportunities from the Offline segment as it accounted for the largest market share in the base year.