Smart Water Softeners Market Analysis, Size, and Forecast 2026-2030: North America (US, Canada, and Mexico), APAC (China, Japan, and India), Europe (Germany, UK, and France), Middle East and Africa (Saudi Arabia, UAE, and South Africa), South America (Brazil, Argentina, and Colombia), and Rest of World (ROW)

Smart Water Softeners Market Analysis, Size, and Forecast 2026-2030:
North America (US, Canada, and Mexico), APAC (China, Japan, and India), Europe (Germany, UK, and France), Middle East and Africa (Saudi Arabia, UAE, and South Africa), South America (Brazil, Argentina, and Colombia), and Rest of World (ROW)

Published: Jan 2026 282 Pages SKU: IRTNTR74373

Market Overview at a Glance

$317.8 Mn
Market Opportunity
9.1%
CAGR 2025 - 2030
43.1%
North America Growth
$320.2 Mn
Floor segment 2024

Smart Water Softeners Market Size 2026-2030

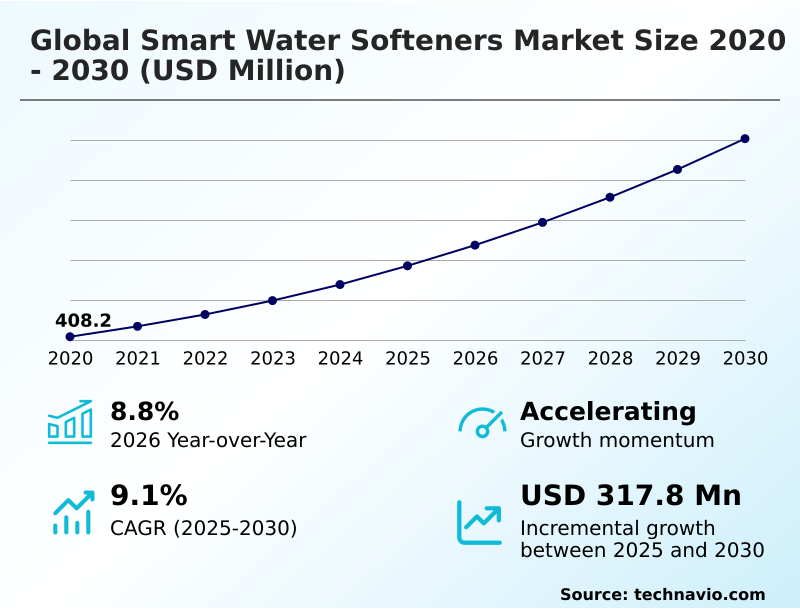
The smart water softeners market size is valued to increase by USD 317.8 million, at a CAGR of 9.1% from 2025 to 2030. Smart connectivity in residential water treatment will drive the smart water softeners market.

Major Market Trends & Insights

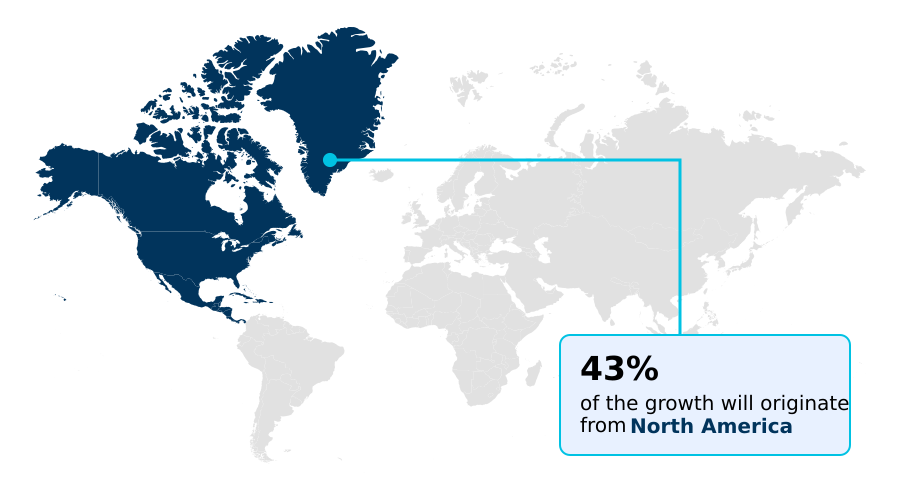
  • North America dominated the market and accounted for a 43.1% growth during the forecast period.
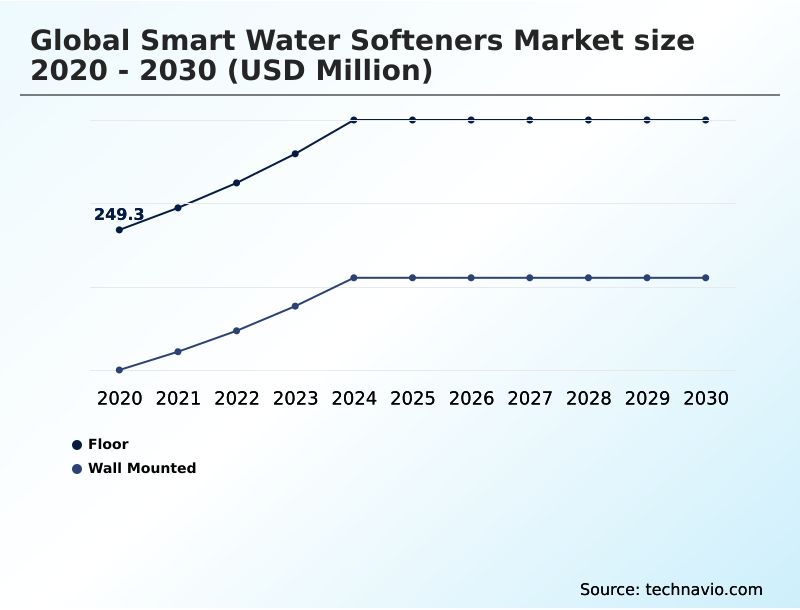
  • By Product Type - Floor segment was valued at USD 320.2 million in 2024
  • By End-user - Residential users segment accounted for the largest market revenue share in 2024

Market Size & Forecast

  • Market Opportunities: USD 495.1 million
  • Market Future Opportunities: USD 317.8 million
  • CAGR from 2025 to 2030 : 9.1%

Market Summary

  • The smart water softeners market is evolving beyond simple mineral removal, driven by the integration of IoT capabilities into traditional ion-exchange technology. This shift is fueled by consumer demand for convenience and sustainability, with features like demand-initiated regeneration becoming standard. These intelligent systems leverage water usage analytics to optimize resource consumption, significantly reducing salt and water waste.
  • This efficiency is critical as the industry grapples with tightening brine discharge regulation. For commercial property managers, this technology transforms operations; a predictive maintenance algorithm can analyze data across a portfolio of buildings, flagging potential system failures before they cause downtime or damage.
  • This capability, combined with smart home ecosystem integration for residential users, provides enhanced control through mobile application integration. Features such as automated salt level monitoring and emergency leak detection shut-off offer tangible value, moving these devices from discretionary upgrades to essential components of modern water management infrastructure, thereby enhancing both operational efficiency and asset protection.

What will be the Size of the Smart Water Softeners Market during the forecast period?

Get Key Insights on Market Forecast (PDF) Request Free Sample

How is the Smart Water Softeners Market Segmented?

The smart water softeners industry research report provides comprehensive data (region-wise segment analysis), with forecasts and estimates in "USD million" for the period 2026-2030, as well as historical data from 2020-2024 for the following segments.

  • Product type
    • Floor
    • Wall mounted
  • End-user
    • Residential users
    • Commercial facilities
    • Industrial applications
  • Distribution channel
    • Offline
    • Online
  • Geography
    • North America
      • US
      • Canada
      • Mexico
    • APAC
      • China
      • Japan
      • India
    • Europe
      • Germany
      • UK
      • France
    • Middle East and Africa
      • Saudi Arabia
      • UAE
      • South Africa
    • South America
      • Brazil
      • Argentina
      • Colombia
    • Rest of World (ROW)

By Product Type Insights

The floor segment is estimated to witness significant growth during the forecast period.

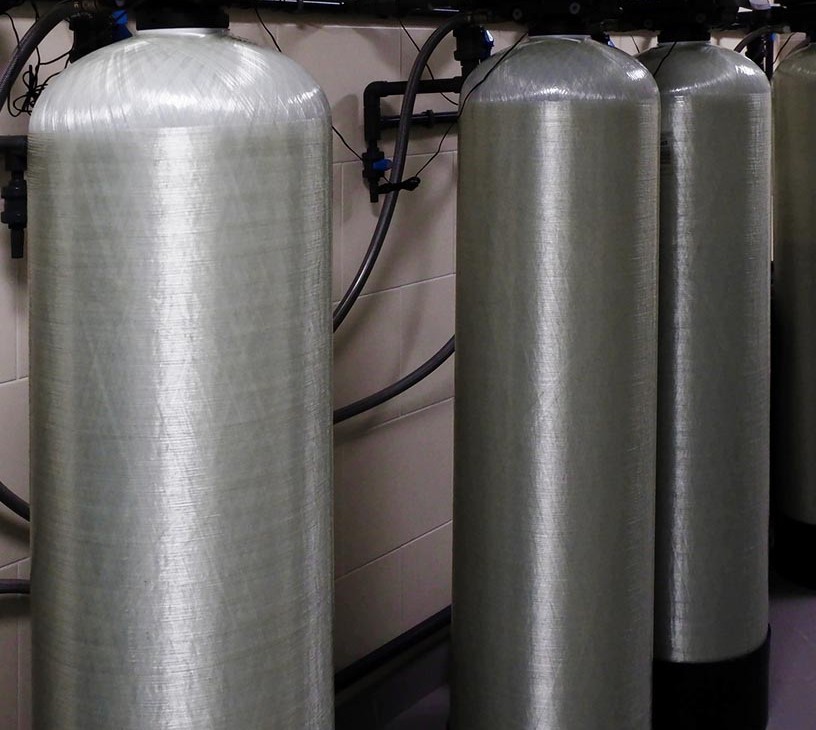
Floor-standing units are integral to whole-home water management, especially in properties requiring high-capacity solutions. These systems, which leverage established ion-exchange technology, are designed for robust performance, ensuring water quality consistency for larger households.

The inclusion of a flow rate meter and advanced sensors enables precise real-time data monitoring, feeding into water usage analytics that optimize performance. This facilitates a move toward a high-efficiency water softener model, reducing resource consumption.

As part of a smart home ecosystem integration strategy, these units provide centralized water control and aid in plumbing infrastructure preservation, with some models improving water efficiency by over 45% through intelligent cycle adjustments, showcasing their advanced capabilities.

Request Free Sample

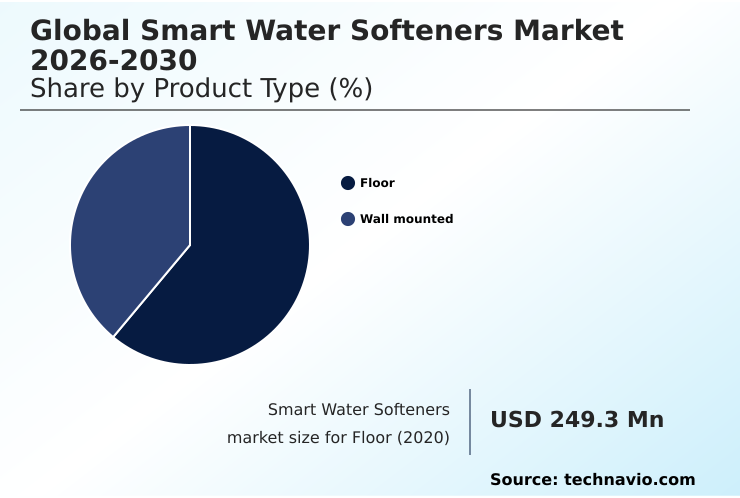
The Floor segment was valued at USD 320.2 million in 2024 and showed a gradual increase during the forecast period.

Request Free Sample

Regional Analysis

North America is estimated to contribute 43.1% to the growth of the global market during the forecast period.Technavio’s analysts have elaborately explained the regional trends and drivers that shape the market during the forecast period.

See How Smart Water Softeners Market Demand is Rising in North America Request Free Sample

The market's geographic distribution is heavily influenced by regional water hardness and regulatory environments. In areas with prevalent hard water, demand is high for systems that ensure scale buildup prevention and support plumbing infrastructure preservation.

The integration of a water hardness sensor allows for a fully automated regeneration cycle using ion exchange resin beads, optimizing performance based on real-time conditions.

This technology directly addresses the water conservation mandate in many regions, with smart systems reducing water waste by up to 50% compared to older models.

Features such as remote water shut-off and platforms for automated salt ordering are gaining traction, further solidifying the value proposition in both residential and commercial settings.
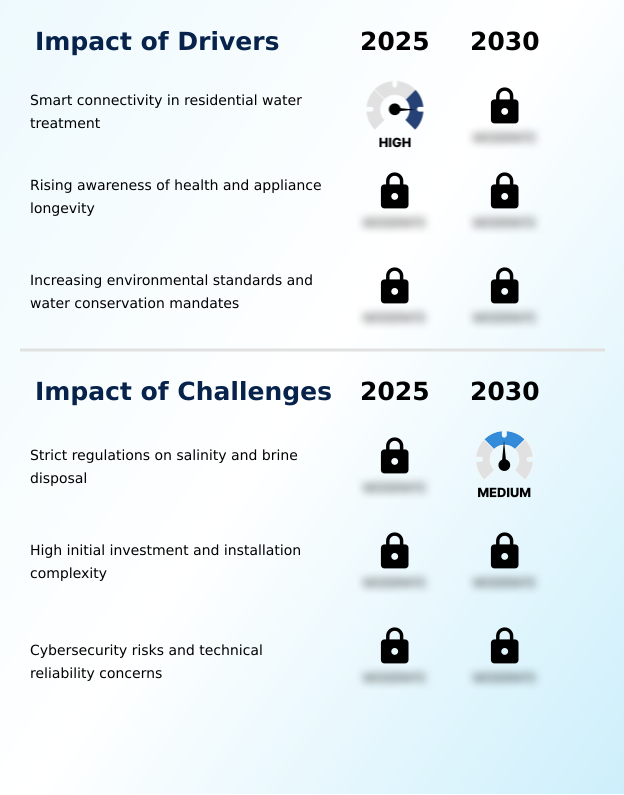
Market Dynamics

Our researchers analyzed the data with 2025 as the base year, along with the key drivers, trends, and challenges. A holistic analysis of drivers will help companies refine their marketing strategies to gain a competitive advantage.

  • Understanding the benefits of iot water softeners is crucial for assessing their role in modern infrastructure. A key question is how demand regeneration works, a process that optimizes resource use and provides significant high efficiency softener salt savings.
  • A smart water softener feature comparison reveals that top rated connected water softeners offer superior performance over legacy systems, answering the smart versus traditional softener efficiency debate. The application of iot in whole home water treatment is especially relevant for homeowners with unique needs, such as finding a smart softener for residential well water.
  • Many systems now include a softener with automatic leak shutoff, a critical feature for property protection. The user experience is defined by the wifi water softener mobile app and options for bluetooth remote softener monitoring, which are detailed in any comprehensive smart water softener installation guide.
  • The core technology enables an automated softener regeneration cycle and allows for predictive maintenance for softeners, moving toward fully autonomous operation. For consumers focused on sustainability, reducing salt use with smart softeners and understanding the environmental impact of brine discharge are key considerations. Alternatives like salt free smart water conditioning are also gaining traction.
  • The market now offers tailored solutions for both smart water softeners for homes and commercial building water softening, often managed through cloud based residential water management platforms, where integrated systems reduce related appliance repair costs by more than half.

What are the key market drivers leading to the rise in the adoption of Smart Water Softeners Industry?

  • The integration of smart connectivity within residential water treatment systems is a key driver for market growth.

  • The drive toward a sustainable home appliance model is a major market force, with demand-initiated regeneration at its core. This feature significantly cuts resource waste, a key factor in appliance longevity protection.
  • The user experience is enhanced through mobile application integration and a user-friendly application interface, made possible by components like a Wi-Fi enabled control valve and a Bluetooth connectivity module.
  • Features such as automated salt level monitoring and proactive leak detection provide tangible value, with systems offering smart home hub compatibility seeing adoption rates 30% higher than non-integrated counterparts.
  • This connectivity offers peace of mind, as automated alerts have been shown to prevent costly water damage in a significant number of installations.

What are the market trends shaping the Smart Water Softeners Industry?

  • The adoption of predictive maintenance and AI-driven analytics represents a significant upcoming trend, particularly within APAC and other emerging markets.

  • A significant trend is the deployment of a predictive maintenance algorithm to transition from reactive repairs to proactive asset management. Through a cloud-connected control valve, systems now provide remote system diagnostics and valve performance diagnostics, reducing operational downtime by up to 40%. This functionality delivers proactive maintenance alerts directly to service providers, enabling faster issue resolution.
  • Continuous system health monitoring and granular consumption insights are becoming standard, supported by firmware over-the-air updates that enhance capabilities post-installation. This evolution in the demand-initiated regeneration cycle is also paving the way for new business structures, including the water-as-a-service model, where performance outcomes are prioritized over hardware sales, with fault detection accuracy improving by over 90%.

What challenges does the Smart Water Softeners Industry face during its growth?

  • Stringent regulations concerning salinity and brine disposal present a primary challenge to the industry's growth trajectory.

  • Navigating stringent brine discharge regulation and chloride emission limits remains a primary challenge, driving interest in eco-friendly water treatment alternatives. While improvements in salt and water efficiency are notable, the market faces competition from technologies like the salt-free water conditioner, template-assisted crystallization, and electromagnetic descaler.
  • Concurrently, cybersecurity for iot devices is a growing concern; a single breach can cost five times more than the hardware itself. While features like an advanced brine tank sensor and automated leak detection shut-off enhance reliability, ensuring the digital security of these connected systems is critical for maintaining consumer trust and mitigating financial risk.

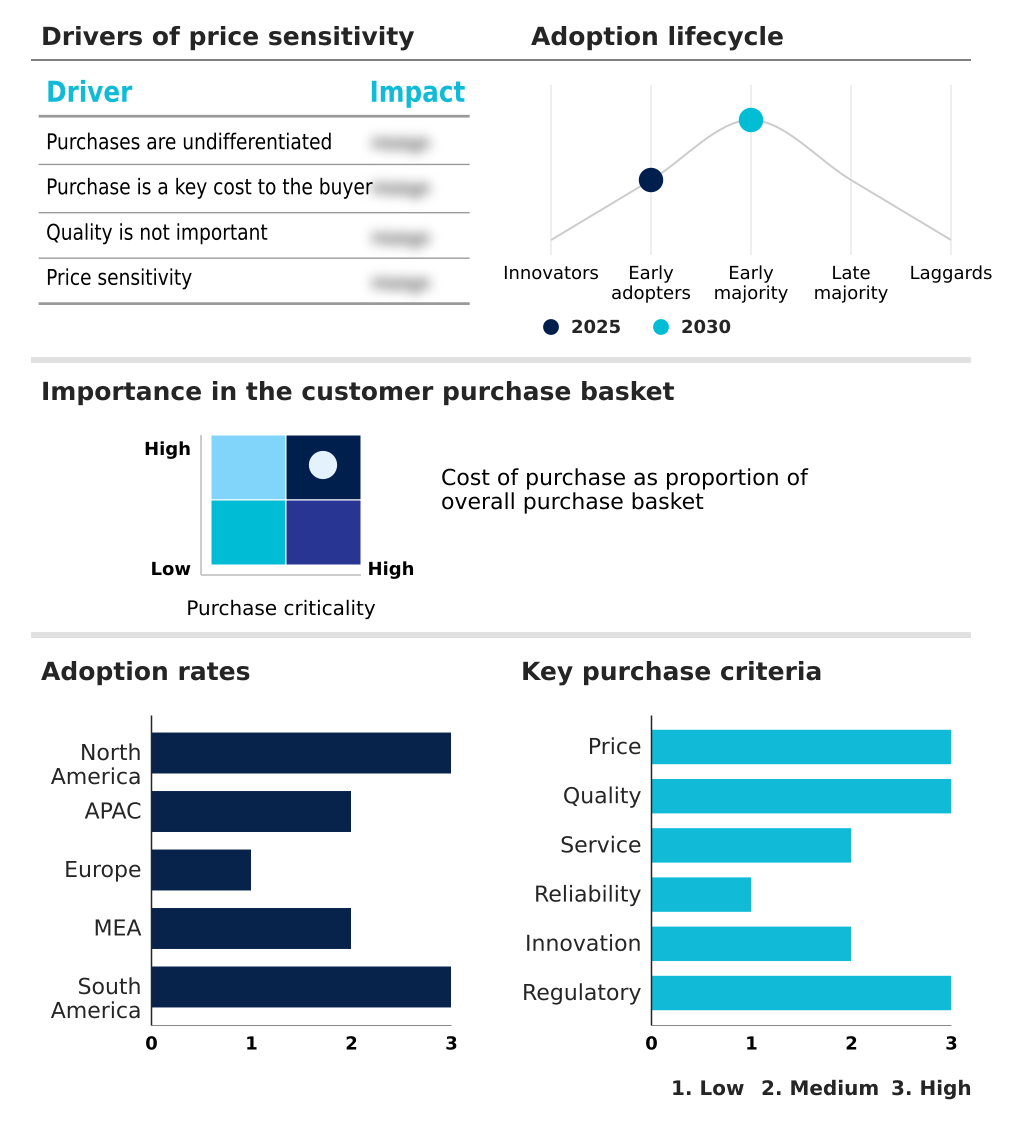
Exclusive Technavio Analysis on Customer Landscape

The smart water softeners market forecasting report includes the adoption lifecycle of the market, covering from the innovator’s stage to the laggard’s stage. It focuses on adoption rates in different regions based on penetration. Furthermore, the smart water softeners market report also includes key purchase criteria and drivers of price sensitivity to help companies evaluate and develop their market growth analysis strategies.

Customer Landscape of Smart Water Softeners Industry

Competitive Landscape

Companies are implementing various strategies, such as strategic alliances, smart water softeners market forecast, partnerships, mergers and acquisitions, geographical expansion, and product/service launches, to enhance their presence in the industry.

3M Co. - Key offerings center on integrated sediment filtration systems, designed to remove suspended materials and enhance water quality for comprehensive whole-house treatment.

The industry research and growth report includes detailed analyses of the competitive landscape of the market and information about key companies, including:

  • 3M Co.
  • A. O. Smith Corp.
  • BWT Holding GmbH
  • Canature Group Co. Ltd.
  • Culligan International Co.
  • Drop
  • EcoWater Systems LLC
  • Excalibur Water Systems Inc.
  • General Electric Co.
  • Harvey Water Softeners Ltd.
  • KENT RO Systems Ltd.
  • Kinetico Inc.
  • Pentair Plc
  • Rheem
  • SpringWell
  • US Water Systems Inc.
  • WaterScience
  • Waterworld USA
  • Whirlpool Corp.

Qualitative and quantitative analysis of companies has been conducted to help clients understand the wider business environment as well as the strengths and weaknesses of key industry players. Data is qualitatively analyzed to categorize companies as pure play, category-focused, industry-focused, and diversified; it is quantitatively analyzed to categorize companies as dominant, leading, strong, tentative, and weak.

Recent Development and News in Smart water softeners market

  • In March, 2025, ANGEL unveiled its next-generation water purification innovations at Aquatech Amsterdam 2025, showcasing a range of advanced purification products to address global water quality challenges.
  • In March, 2025, the Environmental Protection Agency of the United States released a preliminary guidance document suggesting stricter limits on chloride for wastewater treatment plants, signaling potential future regulations.
  • In February, 2025, Pentair plc announced the release of a new suite of cloud-connected control valves featuring advanced AI capabilities designed to autonomously adjust regeneration cycles based on predictive analytics.
  • In February, 2025, GE Appliances Air and Water Solutions announced the launch of its new GE Profile Professional Smart Valve Water Softener, an all-in-one solution for plumbing professionals.

Dive into Technavio’s robust research methodology, blending expert interviews, extensive data synthesis, and validated models for unparalleled Smart Water Softeners Market insights. See full methodology.

Market Scope
Page number 282
Base year 2025
Historic period 2020-2024
Forecast period 2026-2030
Growth momentum & CAGR Accelerate at a CAGR of 9.1%
Market growth 2026-2030 USD 317.8 million
Market structure Fragmented
YoY growth 2025-2026(%) 8.8%
Key countries US, Canada, Mexico, China, Japan, India, South Korea, Australia, Indonesia, Germany, UK, France, Italy, The Netherlands, Spain, Saudi Arabia, UAE, South Africa, Israel, Turkey, Brazil, Argentina and Colombia
Competitive landscape Leading Companies, Market Positioning of Companies, Competitive Strategies, and Industry Risks

Request Free Sample

Research Analyst Overview

  • The market is defined by the fusion of traditional ion-exchange technology with advanced digital oversight. A core competency is demand-initiated regeneration, enabled by a water hardness sensor and flow rate meter to optimize cycles and conserve resources.
  • The hardware ecosystem, including ion exchange resin beads and brine tank sensor components, is now augmented by a Wi-Fi enabled control valve or Bluetooth connectivity module. This facilitates mobile application integration for real-time data monitoring, water usage analytics, and salt level monitoring.
  • A key strategic consideration for leadership is the deployment of a predictive maintenance algorithm, which leverages valve performance diagnostics to issue proactive maintenance alerts and reduce lifecycle costs. This trend directly impacts R&D budgeting, as firms must balance physical engineering with software development, including firmware over-the-air updates. Features like remote water shut-off and leak detection shut-off are becoming standard.
  • As the smart home ecosystem integration matures, and alternatives like the salt-free water conditioner, template-assisted crystallization, and electromagnetic descaler evolve, firms must refine their strategies for the automated regeneration cycle and cloud-connected control valve to maintain a competitive edge, with some achieving a 30% reduction in service calls through these technologies.

What are the Key Data Covered in this Smart Water Softeners Market Research and Growth Report?

  • What is the expected growth of the Smart Water Softeners Market between 2026 and 2030?

    • USD 317.8 million, at a CAGR of 9.1%

  • What segmentation does the market report cover?

    • The report is segmented by Product Type (Floor, and Wall Mounted), End-user (Residential users, Commercial facilities, and Industrial applications), Distribution Channel (Offline, and Online) and Geography (North America, APAC, Europe, Middle East and Africa, South America)

  • Which regions are analyzed in the report?

    • North America, APAC, Europe, Middle East and Africa and South America

  • What are the key growth drivers and market challenges?

    • Smart connectivity in residential water treatment, Strict regulations on salinity and brine disposal

  • Who are the major players in the Smart Water Softeners Market?

    • 3M Co., A. O. Smith Corp., BWT Holding GmbH, Canature Group Co. Ltd., Culligan International Co., Drop, EcoWater Systems LLC, Excalibur Water Systems Inc., General Electric Co., Harvey Water Softeners Ltd., KENT RO Systems Ltd., Kinetico Inc., Pentair Plc, Rheem, SpringWell, US Water Systems Inc., WaterScience, Waterworld USA and Whirlpool Corp.

Market Research Insights

  • The market is characterized by a rapid shift toward integrated whole-home water management systems, where data-driven insights are paramount. These solutions prioritize appliance longevity protection and adherence to regional water conservation mandate policies, with high-efficiency units demonstrating up to a 50% reduction in water waste compared to legacy models.
  • The emphasis on a user-friendly application interface has improved customer engagement rates by over 40%, making system monitoring more accessible. However, this increased connectivity introduces challenges related to cybersecurity for iot devices.
  • Despite these risks, the ability of smart systems to provide proactive alerts reduces the likelihood of catastrophic water damage, a key factor driving adoption in both new construction and retrofit markets.

We can help! Our analysts can customize this smart water softeners market research report to meet your requirements.

Get in touch

1. Executive Summary

1.1 Market overview

Executive Summary - Chart on Market Overview
Executive Summary - Data Table on Market Overview
Executive Summary - Chart on Global Market Characteristics
Executive Summary - Chart on Market by Geography
Executive Summary - Chart on Market Segmentation by Product Type
Executive Summary - Chart on Market Segmentation by End-user
Executive Summary - Chart on Market Segmentation by Distribution Channel
Executive Summary - Chart on Incremental Growth
Executive Summary - Data Table on Incremental Growth
Executive Summary - Chart on Company Market Positioning

2. Technavio Analysis

2.1 Analysis of price sensitivity, lifecycle, customer purchase basket, adoption rates, and purchase criteria

2.2 Criticality of inputs and Factors of differentiation

Chart on Overview on criticality of inputs and factors of differentiation

2.3 Factors of disruption

Chart on Overview on factors of disruption

2.4 Impact of drivers and challenges

Chart on Impact of drivers and challenges in 2025 and 2030

3. Market Landscape

3.1 Market ecosystem

Chart on Parent Market
Data Table on - Parent Market

3.2 Market characteristics

Chart on Market characteristics analysis

3.3 Value chain analysis

Chart on Value chain analysis

4. Market Sizing

4.1 Market definition

Data Table on Offerings of companies included in the market definition

4.2 Market segment analysis

Market segments

4.3 Market size 2025

4.4 Market outlook: Forecast for 2025-2030

Chart on Global - Market size and forecast 2025-2030 ($ million)
Data Table on Global - Market size and forecast 2025-2030 ($ million)
Chart on Global Market: Year-over-year growth 2025-2030 (%)
Data Table on Global Market: Year-over-year growth 2025-2030 (%)

5. Historic Market Size

5.1 Global Smart Water Softeners Market 2020 - 2024

Historic Market Size - Data Table on Global Smart Water Softeners Market 2020 - 2024 ($ million)

5.2 Product Type segment analysis 2020 - 2024

Historic Market Size - Product Type Segment 2020 - 2024 ($ million)

5.3 End-user segment analysis 2020 - 2024

Historic Market Size - End-user Segment 2020 - 2024 ($ million)

5.4 Distribution Channel segment analysis 2020 - 2024

Historic Market Size - Distribution Channel Segment 2020 - 2024 ($ million)

5.5 Geography segment analysis 2020 - 2024

Historic Market Size - Geography Segment 2020 - 2024 ($ million)

5.6 Country segment analysis 2020 - 2024

Historic Market Size - Country Segment 2020 - 2024 ($ million)

6. Qualitative Analysis

6.1 Impact of AI on the Global Smart Water Softeners Market

7. Five Forces Analysis

7.1 Five forces summary

Five forces analysis - Comparison between 2025 and 2030

7.2 Bargaining power of buyers

Bargaining power of buyers - Impact of key factors 2025 and 2030

7.3 Bargaining power of suppliers

Bargaining power of suppliers - Impact of key factors in 2025 and 2030

7.4 Threat of new entrants

Threat of new entrants - Impact of key factors in 2025 and 2030

7.5 Threat of substitutes

Threat of substitutes - Impact of key factors in 2025 and 2030

7.6 Threat of rivalry

Threat of rivalry - Impact of key factors in 2025 and 2030

7.7 Market condition

Chart on Market condition - Five forces 2025 and 2030

8. Market Segmentation by Product Type

8.1 Market segments

Chart on Product Type - Market share 2025-2030 (%)
Data Table on Product Type - Market share 2025-2030 (%)

8.2 Comparison by Product Type

Chart on Comparison by Product Type
Data Table on Comparison by Product Type

8.3 Floor - Market size and forecast 2025-2030

Chart on Floor - Market size and forecast 2025-2030 ($ million)
Data Table on Floor - Market size and forecast 2025-2030 ($ million)
Chart on Floor - Year-over-year growth 2025-2030 (%)
Data Table on Floor - Year-over-year growth 2025-2030 (%)

8.4 Wall mounted - Market size and forecast 2025-2030

Chart on Wall mounted - Market size and forecast 2025-2030 ($ million)
Data Table on Wall mounted - Market size and forecast 2025-2030 ($ million)
Chart on Wall mounted - Year-over-year growth 2025-2030 (%)
Data Table on Wall mounted - Year-over-year growth 2025-2030 (%)

8.5 Market opportunity by Product Type

Market opportunity by Product Type ($ million)
Data Table on Market opportunity by Product Type ($ million)

9. Market Segmentation by End-user

9.1 Market segments

Chart on End-user - Market share 2025-2030 (%)
Data Table on End-user - Market share 2025-2030 (%)

9.2 Comparison by End-user

Chart on Comparison by End-user
Data Table on Comparison by End-user

9.3 Residential users - Market size and forecast 2025-2030

Chart on Residential users - Market size and forecast 2025-2030 ($ million)
Data Table on Residential users - Market size and forecast 2025-2030 ($ million)
Chart on Residential users - Year-over-year growth 2025-2030 (%)
Data Table on Residential users - Year-over-year growth 2025-2030 (%)

9.4 Commercial facilities - Market size and forecast 2025-2030

Chart on Commercial facilities - Market size and forecast 2025-2030 ($ million)
Data Table on Commercial facilities - Market size and forecast 2025-2030 ($ million)
Chart on Commercial facilities - Year-over-year growth 2025-2030 (%)
Data Table on Commercial facilities - Year-over-year growth 2025-2030 (%)

9.5 Industrial applications - Market size and forecast 2025-2030

Chart on Industrial applications - Market size and forecast 2025-2030 ($ million)
Data Table on Industrial applications - Market size and forecast 2025-2030 ($ million)
Chart on Industrial applications - Year-over-year growth 2025-2030 (%)
Data Table on Industrial applications - Year-over-year growth 2025-2030 (%)

9.6 Market opportunity by End-user

Market opportunity by End-user ($ million)
Data Table on Market opportunity by End-user ($ million)

10. Market Segmentation by Distribution Channel

10.1 Market segments

Chart on Distribution Channel - Market share 2025-2030 (%)
Data Table on Distribution Channel - Market share 2025-2030 (%)

10.2 Comparison by Distribution Channel

Chart on Comparison by Distribution Channel
Data Table on Comparison by Distribution Channel

10.3 Offline - Market size and forecast 2025-2030

Chart on Offline - Market size and forecast 2025-2030 ($ million)
Data Table on Offline - Market size and forecast 2025-2030 ($ million)
Chart on Offline - Year-over-year growth 2025-2030 (%)
Data Table on Offline - Year-over-year growth 2025-2030 (%)

10.4 Online - Market size and forecast 2025-2030

Chart on Online - Market size and forecast 2025-2030 ($ million)
Data Table on Online - Market size and forecast 2025-2030 ($ million)
Chart on Online - Year-over-year growth 2025-2030 (%)
Data Table on Online - Year-over-year growth 2025-2030 (%)

10.5 Market opportunity by Distribution Channel

Market opportunity by Distribution Channel ($ million)
Data Table on Market opportunity by Distribution Channel ($ million)

11. Customer Landscape

11.1 Customer landscape overview

Analysis of price sensitivity, lifecycle, customer purchase basket, adoption rates, and purchase criteria

12. Geographic Landscape

12.1 Geographic segmentation

Chart on Market share by geography 2025-2030 (%)
Data Table on Market share by geography 2025-2030 (%)

12.2 Geographic comparison

Chart on Geographic comparison
Data Table on Geographic comparison

12.3 North America - Market size and forecast 2025-2030

Chart on North America - Market size and forecast 2025-2030 ($ million)
Data Table on North America - Market size and forecast 2025-2030 ($ million)
Chart on North America - Year-over-year growth 2025-2030 (%)
Data Table on North America - Year-over-year growth 2025-2030 (%)
Chart on Regional Comparison - North America
Data Table on Regional Comparison - North America

12.3.1 US - Market size and forecast 2025-2030

Chart on US - Market size and forecast 2025-2030 ($ million)
Data Table on US - Market size and forecast 2025-2030 ($ million)
Chart on US - Year-over-year growth 2025-2030 (%)
Data Table on US - Year-over-year growth 2025-2030 (%)

12.3.2 Canada - Market size and forecast 2025-2030

Chart on Canada - Market size and forecast 2025-2030 ($ million)
Data Table on Canada - Market size and forecast 2025-2030 ($ million)
Chart on Canada - Year-over-year growth 2025-2030 (%)
Data Table on Canada - Year-over-year growth 2025-2030 (%)

12.3.3 Mexico - Market size and forecast 2025-2030

Chart on Mexico - Market size and forecast 2025-2030 ($ million)
Data Table on Mexico - Market size and forecast 2025-2030 ($ million)
Chart on Mexico - Year-over-year growth 2025-2030 (%)
Data Table on Mexico - Year-over-year growth 2025-2030 (%)

12.4 APAC - Market size and forecast 2025-2030

Chart on APAC - Market size and forecast 2025-2030 ($ million)
Data Table on APAC - Market size and forecast 2025-2030 ($ million)
Chart on APAC - Year-over-year growth 2025-2030 (%)
Data Table on APAC - Year-over-year growth 2025-2030 (%)
Chart on Regional Comparison - APAC
Data Table on Regional Comparison - APAC

12.4.1 China - Market size and forecast 2025-2030

Chart on China - Market size and forecast 2025-2030 ($ million)
Data Table on China - Market size and forecast 2025-2030 ($ million)
Chart on China - Year-over-year growth 2025-2030 (%)
Data Table on China - Year-over-year growth 2025-2030 (%)

12.4.2 Japan - Market size and forecast 2025-2030

Chart on Japan - Market size and forecast 2025-2030 ($ million)
Data Table on Japan - Market size and forecast 2025-2030 ($ million)
Chart on Japan - Year-over-year growth 2025-2030 (%)
Data Table on Japan - Year-over-year growth 2025-2030 (%)

12.4.3 India - Market size and forecast 2025-2030

Chart on India - Market size and forecast 2025-2030 ($ million)
Data Table on India - Market size and forecast 2025-2030 ($ million)
Chart on India - Year-over-year growth 2025-2030 (%)
Data Table on India - Year-over-year growth 2025-2030 (%)

12.4.4 South Korea - Market size and forecast 2025-2030

Chart on South Korea - Market size and forecast 2025-2030 ($ million)
Data Table on South Korea - Market size and forecast 2025-2030 ($ million)
Chart on South Korea - Year-over-year growth 2025-2030 (%)
Data Table on South Korea - Year-over-year growth 2025-2030 (%)

12.4.5 Australia - Market size and forecast 2025-2030

Chart on Australia - Market size and forecast 2025-2030 ($ million)
Data Table on Australia - Market size and forecast 2025-2030 ($ million)
Chart on Australia - Year-over-year growth 2025-2030 (%)
Data Table on Australia - Year-over-year growth 2025-2030 (%)

12.4.6 Indonesia - Market size and forecast 2025-2030

Chart on Indonesia - Market size and forecast 2025-2030 ($ million)
Data Table on Indonesia - Market size and forecast 2025-2030 ($ million)
Chart on Indonesia - Year-over-year growth 2025-2030 (%)
Data Table on Indonesia - Year-over-year growth 2025-2030 (%)

12.5 Europe - Market size and forecast 2025-2030

Chart on Europe - Market size and forecast 2025-2030 ($ million)
Data Table on Europe - Market size and forecast 2025-2030 ($ million)
Chart on Europe - Year-over-year growth 2025-2030 (%)
Data Table on Europe - Year-over-year growth 2025-2030 (%)
Chart on Regional Comparison - Europe
Data Table on Regional Comparison - Europe

12.5.1 Germany - Market size and forecast 2025-2030

Chart on Germany - Market size and forecast 2025-2030 ($ million)
Data Table on Germany - Market size and forecast 2025-2030 ($ million)
Chart on Germany - Year-over-year growth 2025-2030 (%)
Data Table on Germany - Year-over-year growth 2025-2030 (%)

12.5.2 UK - Market size and forecast 2025-2030

Chart on UK - Market size and forecast 2025-2030 ($ million)
Data Table on UK - Market size and forecast 2025-2030 ($ million)
Chart on UK - Year-over-year growth 2025-2030 (%)
Data Table on UK - Year-over-year growth 2025-2030 (%)

12.5.3 France - Market size and forecast 2025-2030

Chart on France - Market size and forecast 2025-2030 ($ million)
Data Table on France - Market size and forecast 2025-2030 ($ million)
Chart on France - Year-over-year growth 2025-2030 (%)
Data Table on France - Year-over-year growth 2025-2030 (%)

12.5.4 Italy - Market size and forecast 2025-2030

Chart on Italy - Market size and forecast 2025-2030 ($ million)
Data Table on Italy - Market size and forecast 2025-2030 ($ million)
Chart on Italy - Year-over-year growth 2025-2030 (%)
Data Table on Italy - Year-over-year growth 2025-2030 (%)

12.5.5 The Netherlands - Market size and forecast 2025-2030

Chart on The Netherlands - Market size and forecast 2025-2030 ($ million)
Data Table on The Netherlands - Market size and forecast 2025-2030 ($ million)
Chart on The Netherlands - Year-over-year growth 2025-2030 (%)
Data Table on The Netherlands - Year-over-year growth 2025-2030 (%)

12.5.6 Spain - Market size and forecast 2025-2030

Chart on Spain - Market size and forecast 2025-2030 ($ million)
Data Table on Spain - Market size and forecast 2025-2030 ($ million)
Chart on Spain - Year-over-year growth 2025-2030 (%)
Data Table on Spain - Year-over-year growth 2025-2030 (%)

12.6 Middle East and Africa - Market size and forecast 2025-2030

Chart on Middle East and Africa - Market size and forecast 2025-2030 ($ million)
Data Table on Middle East and Africa - Market size and forecast 2025-2030 ($ million)
Chart on Middle East and Africa - Year-over-year growth 2025-2030 (%)
Data Table on Middle East and Africa - Year-over-year growth 2025-2030 (%)
Chart on Regional Comparison - Middle East and Africa
Data Table on Regional Comparison - Middle East and Africa

12.6.1 Saudi Arabia - Market size and forecast 2025-2030

Chart on Saudi Arabia - Market size and forecast 2025-2030 ($ million)
Data Table on Saudi Arabia - Market size and forecast 2025-2030 ($ million)
Chart on Saudi Arabia - Year-over-year growth 2025-2030 (%)
Data Table on Saudi Arabia - Year-over-year growth 2025-2030 (%)

12.6.2 UAE - Market size and forecast 2025-2030

Chart on UAE - Market size and forecast 2025-2030 ($ million)
Data Table on UAE - Market size and forecast 2025-2030 ($ million)
Chart on UAE - Year-over-year growth 2025-2030 (%)
Data Table on UAE - Year-over-year growth 2025-2030 (%)

12.6.3 South Africa - Market size and forecast 2025-2030

Chart on South Africa - Market size and forecast 2025-2030 ($ million)
Data Table on South Africa - Market size and forecast 2025-2030 ($ million)
Chart on South Africa - Year-over-year growth 2025-2030 (%)
Data Table on South Africa - Year-over-year growth 2025-2030 (%)

12.6.4 Israel - Market size and forecast 2025-2030

Chart on Israel - Market size and forecast 2025-2030 ($ million)
Data Table on Israel - Market size and forecast 2025-2030 ($ million)
Chart on Israel - Year-over-year growth 2025-2030 (%)
Data Table on Israel - Year-over-year growth 2025-2030 (%)

12.6.5 Turkey - Market size and forecast 2025-2030

Chart on Turkey - Market size and forecast 2025-2030 ($ million)
Data Table on Turkey - Market size and forecast 2025-2030 ($ million)
Chart on Turkey - Year-over-year growth 2025-2030 (%)
Data Table on Turkey - Year-over-year growth 2025-2030 (%)

12.7 South America - Market size and forecast 2025-2030

Chart on South America - Market size and forecast 2025-2030 ($ million)
Data Table on South America - Market size and forecast 2025-2030 ($ million)
Chart on South America - Year-over-year growth 2025-2030 (%)
Data Table on South America - Year-over-year growth 2025-2030 (%)
Chart on Regional Comparison - South America
Data Table on Regional Comparison - South America

12.7.1 Brazil - Market size and forecast 2025-2030

Chart on Brazil - Market size and forecast 2025-2030 ($ million)
Data Table on Brazil - Market size and forecast 2025-2030 ($ million)
Chart on Brazil - Year-over-year growth 2025-2030 (%)
Data Table on Brazil - Year-over-year growth 2025-2030 (%)

12.7.2 Argentina - Market size and forecast 2025-2030

Chart on Argentina - Market size and forecast 2025-2030 ($ million)
Data Table on Argentina - Market size and forecast 2025-2030 ($ million)
Chart on Argentina - Year-over-year growth 2025-2030 (%)
Data Table on Argentina - Year-over-year growth 2025-2030 (%)

12.7.3 Colombia - Market size and forecast 2025-2030

Chart on Colombia - Market size and forecast 2025-2030 ($ million)
Data Table on Colombia - Market size and forecast 2025-2030 ($ million)
Chart on Colombia - Year-over-year growth 2025-2030 (%)
Data Table on Colombia - Year-over-year growth 2025-2030 (%)

12.8 Market opportunity by geography

Market opportunity by geography ($ million)
Data Tables on Market opportunity by geography ($ million)

13. Drivers, Challenges, and Opportunity

13.1 Market drivers

Smart connectivity in residential water treatment
Rising awareness of health and appliance longevity
Increasing environmental standards and water conservation mandates

13.2 Market challenges

Strict regulations on salinity and brine disposal
High initial investment and installation complexity
Cybersecurity risks and technical reliability concerns

13.3 Impact of drivers and challenges

Impact of drivers and challenges in 2025 and 2030

13.4 Market opportunities

Predictive maintenance and AI-driven analytics in APAC and emerging markets
Integration of IoT in home ecosystems
Demand-initiated regeneration and sustainability in Europe

14. Competitive Landscape

14.1 Overview

14.2

Overview on criticality of inputs and factors of differentiation

14.3 Landscape disruption

Overview on factors of disruption

14.4 Industry risks

Impact of key risks on business

15. Competitive Analysis

15.1 Companies profiled

Companies covered

15.2 Company ranking index

15.3 Market positioning of companies

Matrix on companies position and classification

15.4 3M Co.

3M Co. - Overview
3M Co. - Business segments
3M Co. - Key news
3M Co. - Key offerings
3M Co. - Segment focus
SWOT

15.5 A. O. Smith Corp.

A. O. Smith Corp. - Overview
A. O. Smith Corp. - Business segments
A. O. Smith Corp. - Key news
A. O. Smith Corp. - Key offerings
A. O. Smith Corp. - Segment focus
SWOT

15.6 BWT Holding GmbH

BWT Holding GmbH - Overview
BWT Holding GmbH - Product / Service
BWT Holding GmbH - Key offerings
SWOT

15.7 Canature Group Co. Ltd.

Canature Group Co. Ltd. - Overview
Canature Group Co. Ltd. - Product / Service
Canature Group Co. Ltd. - Key offerings
SWOT

15.8 Culligan International Co.

Culligan International Co. - Overview
Culligan International Co. - Product / Service
Culligan International Co. - Key offerings
SWOT

15.9 Drop

Drop - Overview
Drop - Product / Service
Drop - Key offerings
SWOT

15.10 EcoWater Systems LLC

EcoWater Systems LLC - Overview
EcoWater Systems LLC - Product / Service
EcoWater Systems LLC - Key offerings
SWOT

15.11 General Electric Co.

General Electric Co. - Overview
General Electric Co. - Business segments
General Electric Co. - Key news
General Electric Co. - Key offerings
General Electric Co. - Segment focus
SWOT

15.12 Harvey Water Softeners Ltd.

Harvey Water Softeners Ltd. - Overview
Harvey Water Softeners Ltd. - Product / Service
Harvey Water Softeners Ltd. - Key offerings
SWOT

15.13 KENT RO Systems Ltd.

KENT RO Systems Ltd. - Overview
KENT RO Systems Ltd. - Product / Service
KENT RO Systems Ltd. - Key offerings
SWOT

15.14 Kinetico Inc.

Kinetico Inc. - Overview
Kinetico Inc. - Product / Service
Kinetico Inc. - Key offerings
SWOT

15.15 Pentair Plc

Pentair Plc - Overview
Pentair Plc - Business segments
Pentair Plc - Key news
Pentair Plc - Key offerings
Pentair Plc - Segment focus
SWOT

15.16 US Water Systems Inc.

US Water Systems Inc. - Overview
US Water Systems Inc. - Product / Service
US Water Systems Inc. - Key offerings
SWOT

15.17 Waterworld USA

Waterworld USA - Overview
Waterworld USA - Product / Service
Waterworld USA - Key offerings
SWOT

15.18 Whirlpool Corp.

Whirlpool Corp. - Overview
Whirlpool Corp. - Business segments
Whirlpool Corp. - Key offerings
Whirlpool Corp. - Segment focus
SWOT

16. Appendix

16.1 Scope of the report

Market definition
Objectives
Notes and caveats

16.2 Inclusions and exclusions checklist

Inclusions checklist
Exclusions checklist

16.3 Currency conversion rates for US$

16.4 Research methodology

16.5 Data procurement

Information sources

16.6 Data validation

16.7 Validation techniques employed for market sizing

16.8 Data synthesis

16.9 360 degree market analysis

16.10 List of abbreviations

Research Methodology

Technavio presents a detailed picture of the market by way of study, synthesis, and summation of data from multiple sources. The analysts have presented the various facets of the market with a particular focus on identifying the key industry influencers. The data thus presented is comprehensive, reliable, and the result of extensive research, both primary and secondary.

INFORMATION SOURCES

Primary sources

  • Manufacturers and suppliers
  • Channel partners
  • Industry experts
  • Strategic decision makers

Secondary sources

  • Industry journals and periodicals
  • Government data
  • Financial reports of key industry players
  • Historical data
  • Press releases

DATA ANALYSIS

Data Synthesis

  • Collation of data
  • Estimation of key figures
  • Analysis of derived insights

Data Validation

  • Triangulation with data models
  • Reference against proprietary databases
  • Corroboration with industry experts

REPORT WRITING

Qualitative

  • Market drivers
  • Market challenges
  • Market trends
  • Five forces analysis

Quantitative

  • Market size and forecast
  • Market segmentation
  • Geographical insights
  • Competitive landscape

Interested in this report?

Get your sample now to see our research methodology and insights!

Download Now

Frequently Asked Questions

Smart Water Softeners market growth will increase by USD 317.8 million during 2026-2030.

The Smart Water Softeners market is expected to grow at a CAGR of 9.1% during 2026-2030.

Smart Water Softeners market is segmented by Product type (Floor, Wall mounted) End-user (Residential users, Commercial facilities, Industrial applications) Distribution channel (Offline, Online)

3M Co., A. O. Smith Corp., BWT Holding GmbH, Canature Group Co. Ltd., Culligan International Co., Drop, EcoWater Systems LLC, Excalibur Water Systems Inc., General Electric Co., Harvey Water Softeners Ltd., KENT RO Systems Ltd., Kinetico Inc., Pentair Plc, Rheem, SpringWell, US Water Systems Inc., WaterScience, Waterworld USA, Whirlpool Corp. are a few of the key vendors in the Smart Water Softeners market.

North America will register the highest growth rate of 43.1% among the other regions. Therefore, the Smart Water Softeners market in North America is expected to garner significant business opportunities for the vendors during the forecast period.

US, Canada, Mexico, China, Japan, India, South Korea, Australia, Indonesia, Germany, UK, France, Italy, The Netherlands, Spain, Saudi Arabia, UAE, South Africa, Israel, Turkey, Brazil, Argentina, Colombia

  • Smart connectivity in residential water treatment is the driving factor this market.

The Smart Water Softeners market vendors should focus on grabbing business opportunities from the Product type segment as it accounted for the largest market share in the base year.