Sleeping Pillow Market Analysis, Size, and Forecast 2025-2029: APAC (China, India, and Japan), Europe (UK, Germany, and France), North America (US, Canada, and Mexico), Middle East and Africa (UAE, Saudi Arabia, and South Africa), South America (Brazil and Argentina), and Rest of World (ROW)

Sleeping Pillow Market Analysis, Size, and Forecast 2025-2029:
APAC (China, India, and Japan), Europe (UK, Germany, and France), North America (US, Canada, and Mexico), Middle East and Africa (UAE, Saudi Arabia, and South Africa), South America (Brazil and Argentina), and Rest of World (ROW)

Published: Dec 2025 279 Pages SKU: IRTNTR73819

Market Overview at a Glance

$10.53 B
Market Opportunity
6.7%
CAGR 2024 - 2029
51.6%
APAC Growth
$16.15 B
Offline segment 2023

Sleeping Pillow Market Size 2025-2029

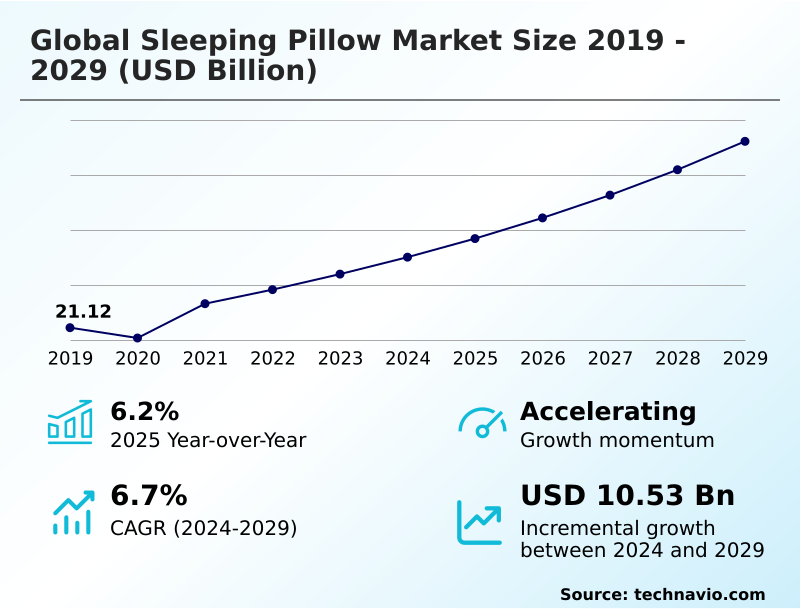
The sleeping pillow market size is valued to increase by USD 10.53 billion, at a CAGR of 6.7% from 2024 to 2029. Heightened consumer focus on sleep health and wellness will drive the sleeping pillow market.

Major Market Trends & Insights

  • APAC dominated the market and accounted for a 51.6% growth during the forecast period.
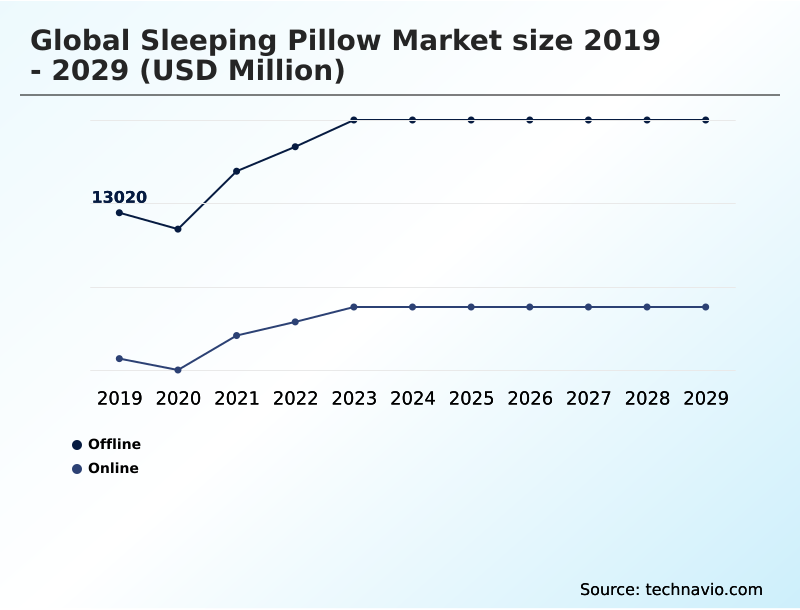
  • By Distribution Channel - Offline segment was valued at USD 16.15 billion in 2023
  • By Type - Memory foam segment accounted for the largest market revenue share in 2023

Market Size & Forecast

  • Market Opportunities: USD 16.95 billion
  • Market Future Opportunities: USD 10.53 billion
  • CAGR from 2024 to 2029 : 6.7%

Market Summary

What will be the Size of the Sleeping Pillow Market during the forecast period?

Get Key Insights on Market Forecast (PDF) Request Free Sample

How is the Sleeping Pillow Market Segmented?

The sleeping pillow industry research report provides comprehensive data (region-wise segment analysis), with forecasts and estimates in "USD million" for the period 2025-2029, as well as historical data from 2019-2023 for the following segments.

  • Distribution channel
    • Offline
    • Online
  • Type
    • Memory foam
    • Microbead
    • Down
    • Feather
  • End-user
    • Residential
    • Commercial
  • Geography
    • APAC
      • China
      • India
      • Japan
    • Europe
      • UK
      • Germany
      • France
    • North America
      • US
      • Canada
      • Mexico
    • Middle East and Africa
      • UAE
      • Saudi Arabia
      • South Africa
    • South America
      • Brazil
      • Argentina
    • Rest of World (ROW)

By Distribution Channel Insights

The offline segment is estimated to witness significant growth during the forecast period.

Request Free Sample

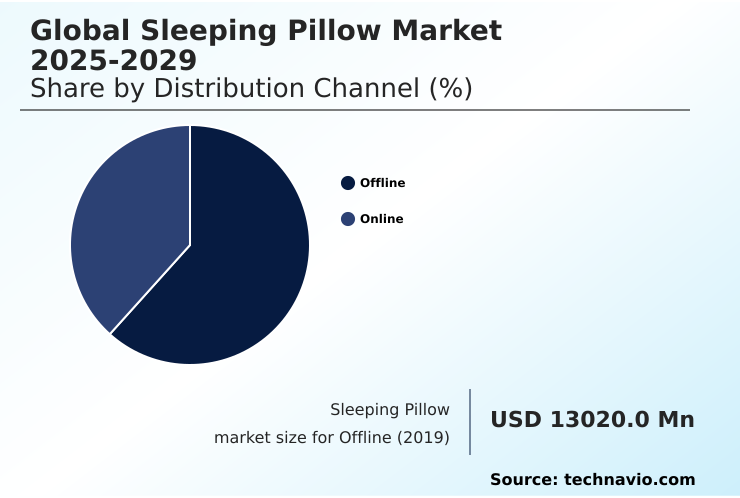
The Offline segment was valued at USD 16.15 billion in 2023 and showed a gradual increase during the forecast period.

Request Free Sample

Regional Analysis

APAC is estimated to contribute 51.6% to the growth of the global market during the forecast period.Technavio’s analysts have elaborately explained the regional trends and drivers that shape the market during the forecast period.

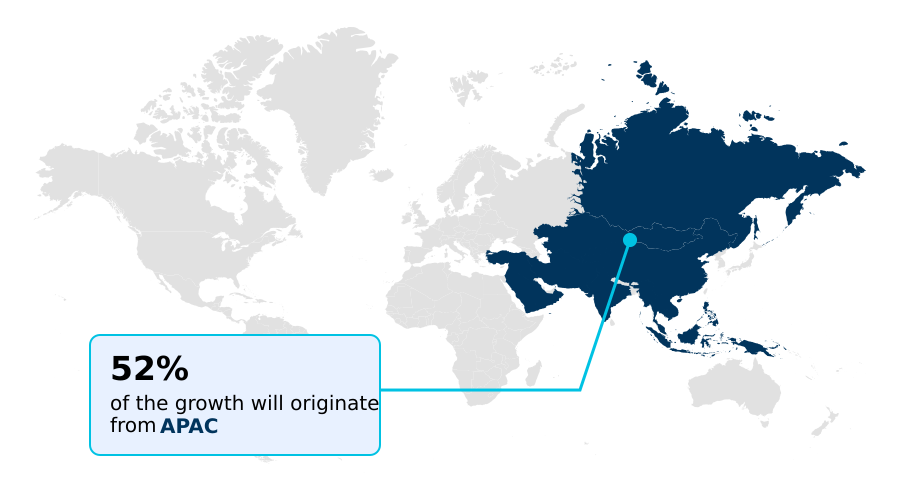
See How Sleeping Pillow Market Demand is Rising in APAC Request Free Sample

Market Dynamics

Our researchers analyzed the data with 2024 as the base year, along with the key drivers, trends, and challenges. A holistic analysis of drivers will help companies refine their marketing strategies to gain a competitive advantage.

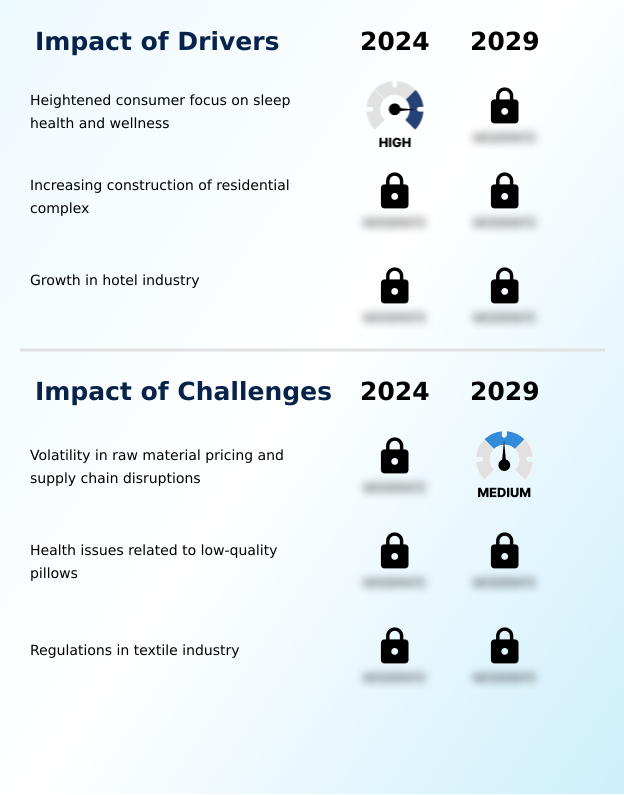
What are the key market drivers leading to the rise in the adoption of Sleeping Pillow Industry?

What are the market trends shaping the Sleeping Pillow Industry?

What challenges does the Sleeping Pillow Industry face during its growth?

Exclusive Technavio Analysis on Customer Landscape

The sleeping pillow market forecasting report includes the adoption lifecycle of the market, covering from the innovator’s stage to the laggard’s stage. It focuses on adoption rates in different regions based on penetration. Furthermore, the sleeping pillow market report also includes key purchase criteria and drivers of price sensitivity to help companies evaluate and develop their market growth analysis strategies.

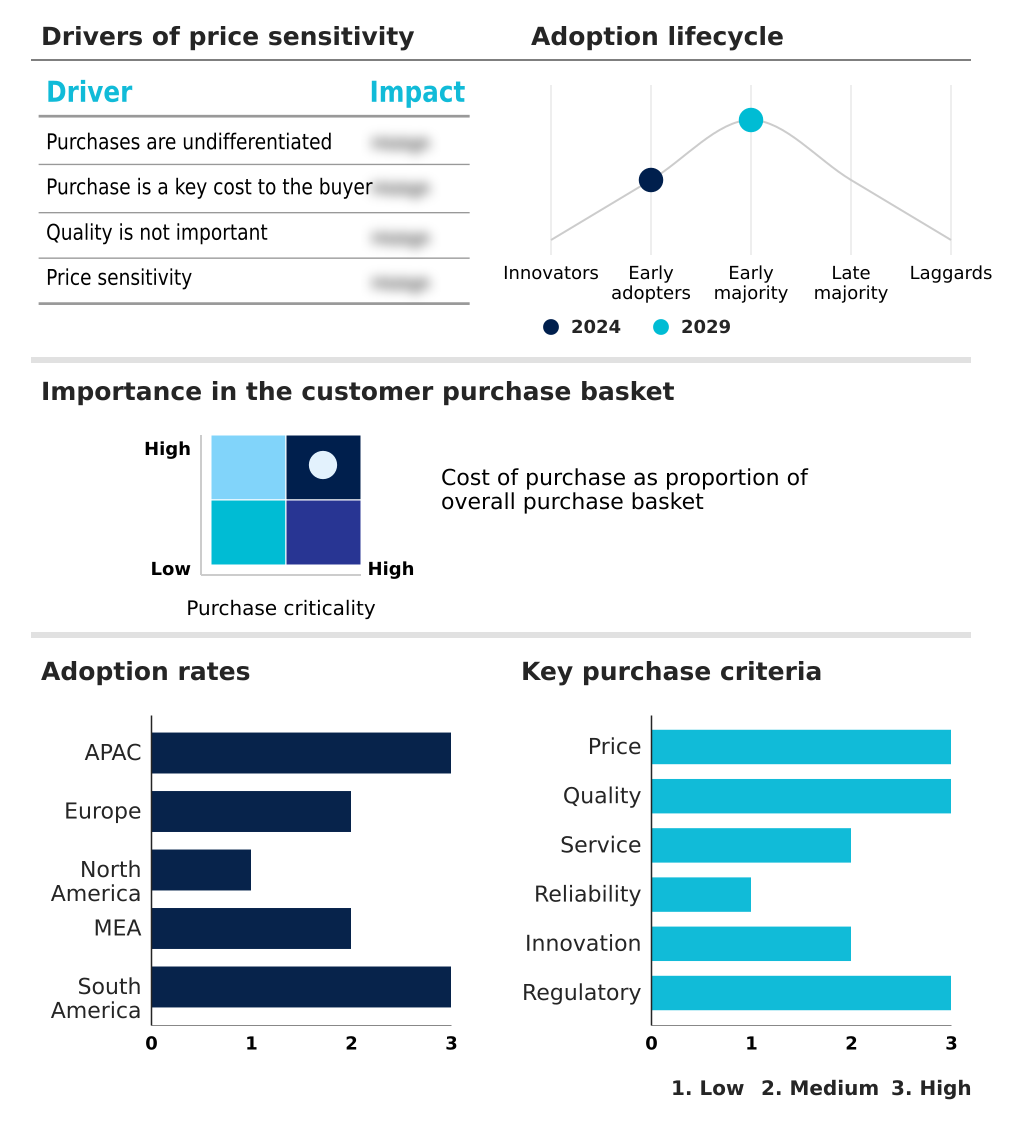
Customer Landscape of Sleeping Pillow Industry

Competitive Landscape

Companies are implementing various strategies, such as strategic alliances, sleeping pillow market forecast, partnerships, mergers and acquisitions, geographical expansion, and product/service launches, to enhance their presence in the industry.

Casper Sleep Inc. -

The industry research and growth report includes detailed analyses of the competitive landscape of the market and information about key companies, including:

  • Casper Sleep Inc.
  • Centuary Fibre Plates Pvt. Ltd.
  • Czech Feather and Down Co.
  • Down and Feather Company LLC.
  • Emma Sleep India Pvt. Ltd.
  • John Cotton Europe Sp. z o
  • King Koil India Pvt. Ltd.
  • Kurlon Enterprise Ltd.
  • Pillows.com
  • Restful Nights
  • Sheela Foam Ltd.
  • Sleep and Beyond
  • Sleep Management Pvt. Ltd.
  • Sleepsia India Pvt. Ltd.
  • Sleepyhead Home Decor
  • The Clean Bedroom LLC
  • The Sleep Co.
  • The White Willow
  • Wakefit Innovations Pvt. Ltd.
  • Welspun Global Brands Ltd.

Qualitative and quantitative analysis of companies has been conducted to help clients understand the wider business environment as well as the strengths and weaknesses of key industry players. Data is qualitatively analyzed to categorize companies as pure play, category-focused, industry-focused, and diversified; it is quantitatively analyzed to categorize companies as dominant, leading, strong, tentative, and weak.

Recent Development and News in Sleeping pillow market

Dive into Technavio’s robust research methodology, blending expert interviews, extensive data synthesis, and validated models for unparalleled Sleeping Pillow Market insights. See full methodology.

Market Scope
Page number 279
Base year 2024
Historic period 2019-2023
Forecast period 2025-2029
Growth momentum & CAGR Accelerate at a CAGR of 6.7%
Market growth 2025-2029 USD 10533.5 million
Market structure Fragmented
YoY growth 2024-2025(%) 6.2%
Key countries China, India, Japan, South Korea, Australia, Indonesia, UK, Germany, France, Italy, Spain, The Netherlands, US, Canada, Mexico, UAE, Saudi Arabia, South Africa, Turkey, Egypt, Brazil, Argentina and Chile
Competitive landscape Leading Companies, Market Positioning of Companies, Competitive Strategies, and Industry Risks

Request Free Sample

Research Analyst Overview

What are the Key Data Covered in this Sleeping Pillow Market Research and Growth Report?

  • What is the expected growth of the Sleeping Pillow Market between 2025 and 2029?

    • USD 10.53 billion, at a CAGR of 6.7%

  • What segmentation does the market report cover?

    • The report is segmented by Distribution Channel (Offline, and Online), Type (Memory foam, Microbead, Down, and Feather), End-user (Residential, and Commercial) and Geography (APAC, Europe, North America, Middle East and Africa, South America)

  • Which regions are analyzed in the report?

    • APAC, Europe, North America, Middle East and Africa and South America

  • What are the key growth drivers and market challenges?

    • Heightened consumer focus on sleep health and wellness, Volatility in raw material pricing and supply chain disruptions

  • Who are the major players in the Sleeping Pillow Market?

    • Casper Sleep Inc., Centuary Fibre Plates Pvt. Ltd., Czech Feather and Down Co., Down and Feather Company LLC., Emma Sleep India Pvt. Ltd., John Cotton Europe Sp. z o, King Koil India Pvt. Ltd., Kurlon Enterprise Ltd., Pillows.com, Restful Nights, Sheela Foam Ltd., Sleep and Beyond, Sleep Management Pvt. Ltd., Sleepsia India Pvt. Ltd., Sleepyhead Home Decor, The Clean Bedroom LLC, The Sleep Co., The White Willow, Wakefit Innovations Pvt. Ltd. and Welspun Global Brands Ltd.

Market Research Insights

We can help! Our analysts can customize this sleeping pillow market research report to meet your requirements.

Get in touch

1. Executive Summary

1.1 Market overview

Executive Summary - Chart on Market Overview
Executive Summary - Data Table on Market Overview
Executive Summary - Chart on Global Market Characteristics
Executive Summary - Chart on Market by Geography
Executive Summary - Chart on Market Segmentation by Distribution Channel
Executive Summary - Chart on Market Segmentation by Type
Executive Summary - Chart on Market Segmentation by End-user
Executive Summary - Chart on Incremental Growth
Executive Summary - Data Table on Incremental Growth
Executive Summary - Chart on Company Market Positioning

2. Technavio Analysis

2.1 Analysis of price sensitivity, lifecycle, customer purchase basket, adoption rates, and purchase criteria

2.2 Criticality of inputs and Factors of differentiation

Chart on Overview on criticality of inputs and factors of differentiation

2.3 Factors of disruption

Chart on Overview on factors of disruption

2.4 Impact of drivers and challenges

Chart on Impact of drivers and challenges in 2024 and 2029

3. Market Landscape

3.1 Market ecosystem

Chart on Parent Market
Data Table on - Parent Market

3.2 Market characteristics

Chart on Market characteristics analysis

3.3 Value chain analysis

Chart on Value chain analysis

4. Market Sizing

4.1 Market definition

Data Table on Offerings of companies included in the market definition

4.2 Market segment analysis

Market segments

4.3 Market size 2024

4.4 Market outlook: Forecast for 2024-2029

Chart on Global - Market size and forecast 2024-2029 ($ million)
Data Table on Global - Market size and forecast 2024-2029 ($ million)
Chart on Global Market: Year-over-year growth 2024-2029 (%)
Data Table on Global Market: Year-over-year growth 2024-2029 (%)

5. Historic Market Size

5.1 Global Sleeping Pillow Market 2019 - 2023

Historic Market Size - Data Table on Global Sleeping Pillow Market 2019 - 2023 ($ million)

5.2 Distribution Channel segment analysis 2019 - 2023

Historic Market Size - Distribution Channel Segment 2019 - 2023 ($ million)

5.3 Type segment analysis 2019 - 2023

Historic Market Size - Type Segment 2019 - 2023 ($ million)

5.4 End-user segment analysis 2019 - 2023

Historic Market Size - End-user Segment 2019 - 2023 ($ million)

5.5 Geography segment analysis 2019 - 2023

Historic Market Size - Geography Segment 2019 - 2023 ($ million)

5.6 Country segment analysis 2019 - 2023

Historic Market Size - Country Segment 2019 - 2023 ($ million)

6. Qualitative Analysis

6.1 The AI impact on the Global Sleeping Pillow Market

7. Five Forces Analysis

7.1 Five forces summary

Five forces analysis - Comparison between 2024 and 2029

7.2 Bargaining power of buyers

Bargaining power of buyers - Impact of key factors 2024 and 2029

7.3 Bargaining power of suppliers

Bargaining power of suppliers - Impact of key factors in 2024 and 2029

7.4 Threat of new entrants

Threat of new entrants - Impact of key factors in 2024 and 2029

7.5 Threat of substitutes

Threat of substitutes - Impact of key factors in 2024 and 2029

7.6 Threat of rivalry

Threat of rivalry - Impact of key factors in 2024 and 2029

7.7 Market condition

Chart on Market condition - Five forces 2024 and 2029

8. Market Segmentation by Distribution Channel

8.1 Market segments

Chart on Distribution Channel - Market share 2024-2029 (%)
Data Table on Distribution Channel - Market share 2024-2029 (%)

8.2 Comparison by Distribution Channel

Chart on Comparison by Distribution Channel
Data Table on Comparison by Distribution Channel

8.3 Offline - Market size and forecast 2024-2029

Chart on Offline - Market size and forecast 2024-2029 ($ million)
Data Table on Offline - Market size and forecast 2024-2029 ($ million)
Chart on Offline - Year-over-year growth 2024-2029 (%)
Data Table on Offline - Year-over-year growth 2024-2029 (%)

8.4 Online - Market size and forecast 2024-2029

Chart on Online - Market size and forecast 2024-2029 ($ million)
Data Table on Online - Market size and forecast 2024-2029 ($ million)
Chart on Online - Year-over-year growth 2024-2029 (%)
Data Table on Online - Year-over-year growth 2024-2029 (%)

8.5 Market opportunity by Distribution Channel

Market opportunity by Distribution Channel ($ million)
Data Table on Market opportunity by Distribution Channel ($ million)

9. Market Segmentation by Type

9.1 Market segments

Chart on Type - Market share 2024-2029 (%)
Data Table on Type - Market share 2024-2029 (%)

9.2 Comparison by Type

Chart on Comparison by Type
Data Table on Comparison by Type

9.3 Memory foam - Market size and forecast 2024-2029

Chart on Memory foam - Market size and forecast 2024-2029 ($ million)
Data Table on Memory foam - Market size and forecast 2024-2029 ($ million)
Chart on Memory foam - Year-over-year growth 2024-2029 (%)
Data Table on Memory foam - Year-over-year growth 2024-2029 (%)

9.4 Microbead - Market size and forecast 2024-2029

Chart on Microbead - Market size and forecast 2024-2029 ($ million)
Data Table on Microbead - Market size and forecast 2024-2029 ($ million)
Chart on Microbead - Year-over-year growth 2024-2029 (%)
Data Table on Microbead - Year-over-year growth 2024-2029 (%)

9.5 Down - Market size and forecast 2024-2029

Chart on Down - Market size and forecast 2024-2029 ($ million)
Data Table on Down - Market size and forecast 2024-2029 ($ million)
Chart on Down - Year-over-year growth 2024-2029 (%)
Data Table on Down - Year-over-year growth 2024-2029 (%)

9.6 Feather - Market size and forecast 2024-2029

Chart on Feather - Market size and forecast 2024-2029 ($ million)
Data Table on Feather - Market size and forecast 2024-2029 ($ million)
Chart on Feather - Year-over-year growth 2024-2029 (%)
Data Table on Feather - Year-over-year growth 2024-2029 (%)

9.7 Market opportunity by Type

Market opportunity by Type ($ million)
Data Table on Market opportunity by Type ($ million)

10. Market Segmentation by End-user

10.1 Market segments

Chart on End-user - Market share 2024-2029 (%)
Data Table on End-user - Market share 2024-2029 (%)

10.2 Comparison by End-user

Chart on Comparison by End-user
Data Table on Comparison by End-user

10.3 Residential - Market size and forecast 2024-2029

Chart on Residential - Market size and forecast 2024-2029 ($ million)
Data Table on Residential - Market size and forecast 2024-2029 ($ million)
Chart on Residential - Year-over-year growth 2024-2029 (%)
Data Table on Residential - Year-over-year growth 2024-2029 (%)

10.4 Commercial - Market size and forecast 2024-2029

Chart on Commercial - Market size and forecast 2024-2029 ($ million)
Data Table on Commercial - Market size and forecast 2024-2029 ($ million)
Chart on Commercial - Year-over-year growth 2024-2029 (%)
Data Table on Commercial - Year-over-year growth 2024-2029 (%)

10.5 Market opportunity by End-user

Market opportunity by End-user ($ million)
Data Table on Market opportunity by End-user ($ million)

11. Customer Landscape

11.1 Customer landscape overview

Analysis of price sensitivity, lifecycle, customer purchase basket, adoption rates, and purchase criteria

12. Geographic Landscape

12.1 Geographic segmentation

Chart on Market share by geography 2024-2029 (%)
Data Table on Market share by geography 2024-2029 (%)

12.2 Geographic comparison

Chart on Geographic comparison
Data Table on Geographic comparison

12.3 APAC - Market size and forecast 2024-2029

Chart on APAC - Market size and forecast 2024-2029 ($ million)
Data Table on APAC - Market size and forecast 2024-2029 ($ million)
Chart on APAC - Year-over-year growth 2024-2029 (%)
Data Table on APAC - Year-over-year growth 2024-2029 (%)
Chart on Regional Comparison - APAC
Data Table on Regional Comparison - APAC

12.3.1 China - Market size and forecast 2024-2029

Chart on China - Market size and forecast 2024-2029 ($ million)
Data Table on China - Market size and forecast 2024-2029 ($ million)
Chart on China - Year-over-year growth 2024-2029 (%)
Data Table on China - Year-over-year growth 2024-2029 (%)

12.3.2 India - Market size and forecast 2024-2029

Chart on India - Market size and forecast 2024-2029 ($ million)
Data Table on India - Market size and forecast 2024-2029 ($ million)
Chart on India - Year-over-year growth 2024-2029 (%)
Data Table on India - Year-over-year growth 2024-2029 (%)

12.3.3 Japan - Market size and forecast 2024-2029

Chart on Japan - Market size and forecast 2024-2029 ($ million)
Data Table on Japan - Market size and forecast 2024-2029 ($ million)
Chart on Japan - Year-over-year growth 2024-2029 (%)
Data Table on Japan - Year-over-year growth 2024-2029 (%)

12.3.4 South Korea - Market size and forecast 2024-2029

Chart on South Korea - Market size and forecast 2024-2029 ($ million)
Data Table on South Korea - Market size and forecast 2024-2029 ($ million)
Chart on South Korea - Year-over-year growth 2024-2029 (%)
Data Table on South Korea - Year-over-year growth 2024-2029 (%)

12.3.5 Australia - Market size and forecast 2024-2029

Chart on Australia - Market size and forecast 2024-2029 ($ million)
Data Table on Australia - Market size and forecast 2024-2029 ($ million)
Chart on Australia - Year-over-year growth 2024-2029 (%)
Data Table on Australia - Year-over-year growth 2024-2029 (%)

12.3.6 Indonesia - Market size and forecast 2024-2029

Chart on Indonesia - Market size and forecast 2024-2029 ($ million)
Data Table on Indonesia - Market size and forecast 2024-2029 ($ million)
Chart on Indonesia - Year-over-year growth 2024-2029 (%)
Data Table on Indonesia - Year-over-year growth 2024-2029 (%)

12.4 Europe - Market size and forecast 2024-2029

Chart on Europe - Market size and forecast 2024-2029 ($ million)
Data Table on Europe - Market size and forecast 2024-2029 ($ million)
Chart on Europe - Year-over-year growth 2024-2029 (%)
Data Table on Europe - Year-over-year growth 2024-2029 (%)
Chart on Regional Comparison - Europe
Data Table on Regional Comparison - Europe

12.4.1 UK - Market size and forecast 2024-2029

Chart on UK - Market size and forecast 2024-2029 ($ million)
Data Table on UK - Market size and forecast 2024-2029 ($ million)
Chart on UK - Year-over-year growth 2024-2029 (%)
Data Table on UK - Year-over-year growth 2024-2029 (%)

12.4.2 Germany - Market size and forecast 2024-2029

Chart on Germany - Market size and forecast 2024-2029 ($ million)
Data Table on Germany - Market size and forecast 2024-2029 ($ million)
Chart on Germany - Year-over-year growth 2024-2029 (%)
Data Table on Germany - Year-over-year growth 2024-2029 (%)

12.4.3 France - Market size and forecast 2024-2029

Chart on France - Market size and forecast 2024-2029 ($ million)
Data Table on France - Market size and forecast 2024-2029 ($ million)
Chart on France - Year-over-year growth 2024-2029 (%)
Data Table on France - Year-over-year growth 2024-2029 (%)

12.4.4 Italy - Market size and forecast 2024-2029

Chart on Italy - Market size and forecast 2024-2029 ($ million)
Data Table on Italy - Market size and forecast 2024-2029 ($ million)
Chart on Italy - Year-over-year growth 2024-2029 (%)
Data Table on Italy - Year-over-year growth 2024-2029 (%)

12.4.5 Spain - Market size and forecast 2024-2029

Chart on Spain - Market size and forecast 2024-2029 ($ million)
Data Table on Spain - Market size and forecast 2024-2029 ($ million)
Chart on Spain - Year-over-year growth 2024-2029 (%)
Data Table on Spain - Year-over-year growth 2024-2029 (%)

12.4.6 The Netherlands - Market size and forecast 2024-2029

Chart on The Netherlands - Market size and forecast 2024-2029 ($ million)
Data Table on The Netherlands - Market size and forecast 2024-2029 ($ million)
Chart on The Netherlands - Year-over-year growth 2024-2029 (%)
Data Table on The Netherlands - Year-over-year growth 2024-2029 (%)

12.5 North America - Market size and forecast 2024-2029

Chart on North America - Market size and forecast 2024-2029 ($ million)
Data Table on North America - Market size and forecast 2024-2029 ($ million)
Chart on North America - Year-over-year growth 2024-2029 (%)
Data Table on North America - Year-over-year growth 2024-2029 (%)
Chart on Regional Comparison - North America
Data Table on Regional Comparison - North America

12.5.1 US - Market size and forecast 2024-2029

Chart on US - Market size and forecast 2024-2029 ($ million)
Data Table on US - Market size and forecast 2024-2029 ($ million)
Chart on US - Year-over-year growth 2024-2029 (%)
Data Table on US - Year-over-year growth 2024-2029 (%)

12.5.2 Canada - Market size and forecast 2024-2029

Chart on Canada - Market size and forecast 2024-2029 ($ million)
Data Table on Canada - Market size and forecast 2024-2029 ($ million)
Chart on Canada - Year-over-year growth 2024-2029 (%)
Data Table on Canada - Year-over-year growth 2024-2029 (%)

12.5.3 Mexico - Market size and forecast 2024-2029

Chart on Mexico - Market size and forecast 2024-2029 ($ million)
Data Table on Mexico - Market size and forecast 2024-2029 ($ million)
Chart on Mexico - Year-over-year growth 2024-2029 (%)
Data Table on Mexico - Year-over-year growth 2024-2029 (%)

12.6 Middle East and Africa - Market size and forecast 2024-2029

Chart on Middle East and Africa - Market size and forecast 2024-2029 ($ million)
Data Table on Middle East and Africa - Market size and forecast 2024-2029 ($ million)
Chart on Middle East and Africa - Year-over-year growth 2024-2029 (%)
Data Table on Middle East and Africa - Year-over-year growth 2024-2029 (%)
Chart on Regional Comparison - Middle East and Africa
Data Table on Regional Comparison - Middle East and Africa

12.6.1 UAE - Market size and forecast 2024-2029

Chart on UAE - Market size and forecast 2024-2029 ($ million)
Data Table on UAE - Market size and forecast 2024-2029 ($ million)
Chart on UAE - Year-over-year growth 2024-2029 (%)
Data Table on UAE - Year-over-year growth 2024-2029 (%)

12.6.2 Saudi Arabia - Market size and forecast 2024-2029

Chart on Saudi Arabia - Market size and forecast 2024-2029 ($ million)
Data Table on Saudi Arabia - Market size and forecast 2024-2029 ($ million)
Chart on Saudi Arabia - Year-over-year growth 2024-2029 (%)
Data Table on Saudi Arabia - Year-over-year growth 2024-2029 (%)

12.6.3 South Africa - Market size and forecast 2024-2029

Chart on South Africa - Market size and forecast 2024-2029 ($ million)
Data Table on South Africa - Market size and forecast 2024-2029 ($ million)
Chart on South Africa - Year-over-year growth 2024-2029 (%)
Data Table on South Africa - Year-over-year growth 2024-2029 (%)

12.6.4 Turkey - Market size and forecast 2024-2029

Chart on Turkey - Market size and forecast 2024-2029 ($ million)
Data Table on Turkey - Market size and forecast 2024-2029 ($ million)
Chart on Turkey - Year-over-year growth 2024-2029 (%)
Data Table on Turkey - Year-over-year growth 2024-2029 (%)

12.6.5 Egypt - Market size and forecast 2024-2029

Chart on Egypt - Market size and forecast 2024-2029 ($ million)
Data Table on Egypt - Market size and forecast 2024-2029 ($ million)
Chart on Egypt - Year-over-year growth 2024-2029 (%)
Data Table on Egypt - Year-over-year growth 2024-2029 (%)

12.7 South America - Market size and forecast 2024-2029

Chart on South America - Market size and forecast 2024-2029 ($ million)
Data Table on South America - Market size and forecast 2024-2029 ($ million)
Chart on South America - Year-over-year growth 2024-2029 (%)
Data Table on South America - Year-over-year growth 2024-2029 (%)
Chart on Regional Comparison - South America
Data Table on Regional Comparison - South America

12.7.1 Brazil - Market size and forecast 2024-2029

Chart on Brazil - Market size and forecast 2024-2029 ($ million)
Data Table on Brazil - Market size and forecast 2024-2029 ($ million)
Chart on Brazil - Year-over-year growth 2024-2029 (%)
Data Table on Brazil - Year-over-year growth 2024-2029 (%)

12.7.2 Argentina - Market size and forecast 2024-2029

Chart on Argentina - Market size and forecast 2024-2029 ($ million)
Data Table on Argentina - Market size and forecast 2024-2029 ($ million)
Chart on Argentina - Year-over-year growth 2024-2029 (%)
Data Table on Argentina - Year-over-year growth 2024-2029 (%)

12.7.3 Chile - Market size and forecast 2024-2029

Chart on Chile - Market size and forecast 2024-2029 ($ million)
Data Table on Chile - Market size and forecast 2024-2029 ($ million)
Chart on Chile - Year-over-year growth 2024-2029 (%)
Data Table on Chile - Year-over-year growth 2024-2029 (%)

12.8 Market opportunity by geography

Market opportunity by geography ($ million)
Data Tables on Market opportunity by geography ($ million)

13. Drivers, Challenges, and Opportunity

13.1 Market drivers

Heightened consumer focus on sleep health and wellness
Increasing construction of residential complex
Growth in hotel industry

13.2 Market challenges

Volatility in raw material pricing and supply chain disruptions
Health issues related to low-quality pillows
Regulations in textile industry

13.3 Impact of drivers and challenges

Impact of drivers and challenges in 2024 and 2029

13.4 Market opportunities

Personalization and customization of sleep solutions
Innovative product launches
Growing demand for sleeping pillows from hospitals and nursing homes

14. Competitive Landscape

14.1 Overview

14.2

Overview on criticality of inputs and factors of differentiation

14.3 Landscape disruption

Overview on factors of disruption

14.4 Industry risks

Impact of key risks on business

15. Competitive Analysis

15.1 Companies profiled

Companies covered

15.2 Company ranking index

15.3 Market positioning of companies

Matrix on companies position and classification

15.4 Casper Sleep Inc.

Casper Sleep Inc. - Overview
Casper Sleep Inc. - Product / Service
Casper Sleep Inc. - Key offerings
SWOT

15.5 Centuary Fibre Plates Pvt. Ltd.

Centuary Fibre Plates Pvt. Ltd. - Overview
Centuary Fibre Plates Pvt. Ltd. - Product / Service
Centuary Fibre Plates Pvt. Ltd. - Key offerings
SWOT

15.6 Czech Feather and Down Co.

Czech Feather and Down Co. - Overview
Czech Feather and Down Co. - Product / Service
Czech Feather and Down Co. - Key offerings
SWOT

15.7 Down and Feather Company LLC.

Down and Feather Company LLC. - Overview
Down and Feather Company LLC. - Product / Service
Down and Feather Company LLC. - Key offerings
SWOT

15.8 Emma Sleep India Pvt. Ltd.

Emma Sleep India Pvt. Ltd. - Overview
Emma Sleep India Pvt. Ltd. - Product / Service
Emma Sleep India Pvt. Ltd. - Key offerings
SWOT

15.9 John Cotton Europe Sp. z o

John Cotton Europe Sp. z o - Overview
John Cotton Europe Sp. z o - Product / Service
John Cotton Europe Sp. z o - Key offerings
SWOT

15.10 King Koil India Pvt. Ltd.

King Koil India Pvt. Ltd. - Overview
King Koil India Pvt. Ltd. - Product / Service
King Koil India Pvt. Ltd. - Key offerings
SWOT

15.11 Kurlon Enterprise Ltd.

Kurlon Enterprise Ltd. - Overview
Kurlon Enterprise Ltd. - Product / Service
Kurlon Enterprise Ltd. - Key offerings
SWOT

15.12 Pillows.com

Pillows.com - Overview
Pillows.com - Product / Service
Pillows.com - Key offerings
SWOT

15.13 Restful Nights

Restful Nights - Overview
Restful Nights - Product / Service
Restful Nights - Key offerings
SWOT

15.14 Sheela Foam Ltd.

Sheela Foam Ltd. - Overview
Sheela Foam Ltd. - Product / Service
Sheela Foam Ltd. - Key offerings
SWOT

15.15 Sleep and Beyond

Sleep and Beyond - Overview
Sleep and Beyond - Product / Service
Sleep and Beyond - Key offerings
SWOT

15.16 Sleep Management Pvt. Ltd.

Sleep Management Pvt. Ltd. - Overview
Sleep Management Pvt. Ltd. - Product / Service
Sleep Management Pvt. Ltd. - Key offerings
SWOT

15.17 Sleepsia India Pvt. Ltd.

Sleepsia India Pvt. Ltd. - Overview
Sleepsia India Pvt. Ltd. - Product / Service
Sleepsia India Pvt. Ltd. - Key offerings
SWOT

15.18 Sleepyhead Home Decor

Sleepyhead Home Decor - Overview
Sleepyhead Home Decor - Product / Service
Sleepyhead Home Decor - Key offerings
SWOT

16. Appendix

16.1 Scope of the report

Market definition
Objectives
Notes and caveats

16.2 Inclusions and exclusions checklist

Inclusions checklist
Exclusions checklist

16.3 Currency conversion rates for US$

16.4 Research methodology

16.5 Data procurement

Information sources

16.6 Data validation

16.7 Validation techniques employed for market sizing

16.8 Data synthesis

16.9 360 degree market analysis

16.10 List of abbreviations

Research Methodology

Technavio presents a detailed picture of the market by way of study, synthesis, and summation of data from multiple sources. The analysts have presented the various facets of the market with a particular focus on identifying the key industry influencers. The data thus presented is comprehensive, reliable, and the result of extensive research, both primary and secondary.

INFORMATION SOURCES

Primary sources

  • Manufacturers and suppliers
  • Channel partners
  • Industry experts
  • Strategic decision makers

Secondary sources

  • Industry journals and periodicals
  • Government data
  • Financial reports of key industry players
  • Historical data
  • Press releases

DATA ANALYSIS

Data Synthesis

  • Collation of data
  • Estimation of key figures
  • Analysis of derived insights

Data Validation

  • Triangulation with data models
  • Reference against proprietary databases
  • Corroboration with industry experts

REPORT WRITING

Qualitative

  • Market drivers
  • Market challenges
  • Market trends
  • Five forces analysis

Quantitative

  • Market size and forecast
  • Market segmentation
  • Geographical insights
  • Competitive landscape

Interested in this report?

Get your sample now to see our research methodology and insights!

Download Now

Frequently Asked Questions

Sleeping Pillow market growth will increase by USD 10533.5 million during 2025-2029.

The Sleeping Pillow market is expected to grow at a CAGR of 6.7% during 2025-2029.

Sleeping Pillow market is segmented by Distribution channel (Offline, Online) Type (Memory foam, Microbead, Down, Feather) End-user (Residential, Commercial)

Casper Sleep Inc., Centuary Fibre Plates Pvt. Ltd., Czech Feather and Down Co., Down and Feather Company LLC., Emma Sleep India Pvt. Ltd., John Cotton Europe Sp. z o, King Koil India Pvt. Ltd., Kurlon Enterprise Ltd., Pillows.com, Restful Nights, Sheela Foam Ltd., Sleep and Beyond, Sleep Management Pvt. Ltd., Sleepsia India Pvt. Ltd., Sleepyhead Home Decor, The Clean Bedroom LLC, The Sleep Co., The White Willow, Wakefit Innovations Pvt. Ltd., Welspun Global Brands Ltd. are a few of the key vendors in the Sleeping Pillow market.

APAC will register the highest growth rate of 51.6% among the other regions. Therefore, the Sleeping Pillow market in APAC is expected to garner significant business opportunities for the vendors during the forecast period.

China, India, Japan, South Korea, Australia, Indonesia, UK, Germany, France, Italy, Spain, The Netherlands, US, Canada, Mexico, UAE, Saudi Arabia, South Africa, Turkey, Egypt, Brazil, Argentina, Chile

  • Heightened consumer focus on sleep health and wellness is the driving factor this market.

The Sleeping Pillow market vendors should focus on grabbing business opportunities from the Distribution channel segment as it accounted for the largest market share in the base year.