Skincare Products Market Analysis, Size, and Forecast 2025-2029: North America (US and Canada), Europe (France, Germany, and UK), APAC (Australia, China, India, Japan, and South Korea), and Rest of World (ROW)

Skincare Products Market Analysis, Size, and Forecast 2025-2029:
North America (US and Canada), Europe (France, Germany, and UK), APAC (Australia, China, India, Japan, and South Korea), and Rest of World (ROW)

Published: Jun 2025 229 Pages SKU: IRTNTR41014

Skincare Products Market Size 2025-2029

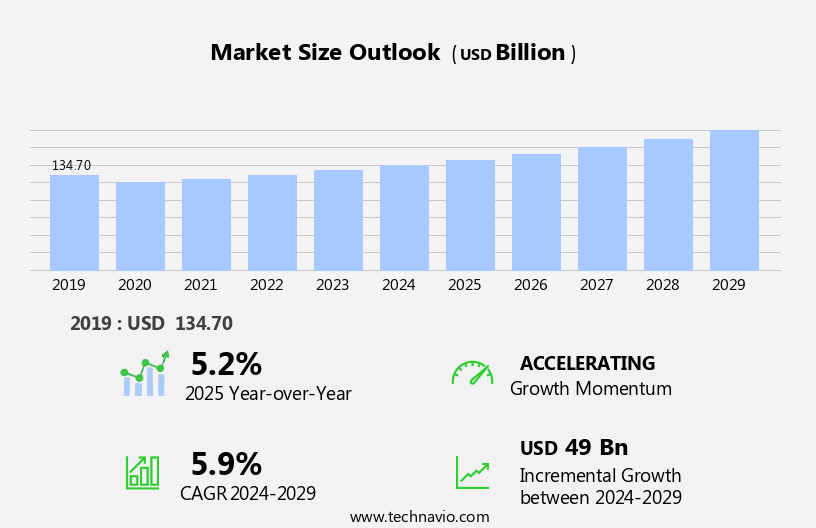
The skincare products market size is forecast to increase by USD 49 billion, at a CAGR of 5.9% between 2024 and 2029.

  • The market is witnessing significant growth, driven by the increasing popularity of home salon and spa services. This trend reflects consumers' preference for convenience and affordability, as well as the desire for personalized skincare solutions. Anti-inflammatory ingredients, facial massage, LED light therapy, chemical peels, derma rollers, and beauty devices are popular trends in skincare routines. Additionally, the market is witnessing a rise in research and development activities, leading to the introduction of innovative products that cater to diverse skin types and concerns. However, the market faces challenges from stringent regulations for manufacturing skincare products.
  • Companies seeking to capitalize on market opportunities must navigate these challenges effectively, investing in research and development to create innovative, regulatory-compliant products. Furthermore, strategic partnerships and collaborations with regulatory bodies can help streamline the approval process and ensure a competitive edge in the market. Compliance with these regulations adds to the production costs, potentially limiting profitability for manufacturers. Skin analysis technology offers personalized skincare recommendations, while cosmeceutical ingredients, such as retinoids and vitamin C, are staples in professional skincare offerings.

What will be the Size of the Skincare Products Market during the forecast period?

Skincare Products Market Size

Explore in-depth regional segment analysis with market size data - historical 2019-2023 and forecasts 2025-2029 - in the full report.  
Request Free Sample

The market continues to evolve, driven by consumer demand for innovative and effective solutions. Vitamin C serums and lip balms remain popular choices, with ongoing research and development leading to new formulations and applications. Distribution channels expand, with e-commerce sales increasing, and consumer behavior shifts towards personalized skincare solutions based on skin concerns and types. Quality control and clinical trials are essential for ensuring product efficacy and safety, while natural ingredients, such as clay masks and active ingredients like glycolic acid, gain favor for their benefits. Brand loyalty is a significant factor, with consumers seeking reliable and trusted brands. Retinol serums and night creams are staples in many skincare routines, while pricing strategies and ingredient sourcing influence purchasing decisions.

Hydrating serums cater to various skin types, including combination, sensitive, oily, and dry, and anti-aging serums remain in high demand. UVA and UVB protection are crucial, with broad-spectrum sunscreens becoming increasingly important. Marketing strategies focus on targeting specific customer segments, and supply chain optimization is essential for meeting consumer demand. Sheet masks and peel-off masks offer convenient and effective solutions for various skin concerns. The skincare market's continuous dynamism reflects the industry's commitment to addressing evolving consumer needs and preferences.

How is this Skincare Products Industry segmented?

The skincare products industry research report provides comprehensive data (region-wise segment analysis), with forecasts and estimates in "USD billion" for the period 2025-2029, as well as historical data from 2019-2023 for the following segments.

  • Distribution Channel
    • Offline
    • Online
  • Product
    • Face skincare products
    • Body skincare products
  • Product Specification
    • Moisturizers
    • Anti-aging skincare products
    • Skin brightening products
    • Sun protection products
    • Others
  • Geography
    • North America
      • US
      • Canada
    • Europe
      • France
      • Germany
      • UK
    • APAC
      • Australia
      • China
      • India
      • Japan
      • South Korea
    • Rest of World (ROW)

By Distribution Channel Insights

The Offline segment is estimated to witness significant growth during the forecast period. In the dynamic skincare market, hyaluronic acid, facial oils, and facial scrubs continue to be popular choices among consumers. E-commerce sales have seen a significant rise, offering convenience and accessibility. Broad spectrum UVB protection remains a priority for customers, driving demand for sunscreens and other protective products. Customer segmentation based on skin concerns, such as oily, dry, sensitive, and combination, influences purchasing decisions. Active ingredients like salicylic acid, retinol serums, and glycolic acid target specific skin issues.

Marketing strategies focus on brand loyalty and consumer behavior. The supply chain ensures a steady flow of products, with UVA protection and sheet masks gaining popularity. Peel-off masks and hydrating serums cater to various skin types. Pricing strategies vary, with premium and budget options available. The distribution channels include offline retailers like specialty stores, hypermarkets, supermarkets, convenience stores, and drug stores, which accounted for the highest share in 2024 due to their engaging shopping experiences.

Skincare Products Market Size

Request Free Sample

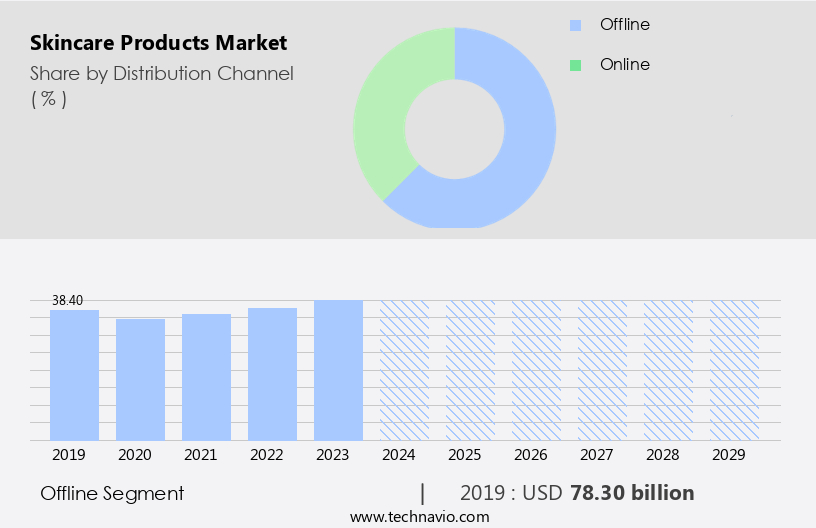
The Offline segment was valued at USD 78.30 billion in 2019 and showed a gradual increase during the forecast period.

The Skincare Products Market is rapidly evolving with a growing focus on prescription skincare that targets personalized skin concerns. Consumers are increasingly choosing clinical-grade products designed to improve skin elasticity, restore skin firmness, and smooth out uneven skin texture. These demands are driving innovation as brands develop solutions backed by dermatological science to deliver visible, long-lasting results. The market is experiencing significant growth, driven by the increasing popularity of home salon and spa services.

Regional Analysis

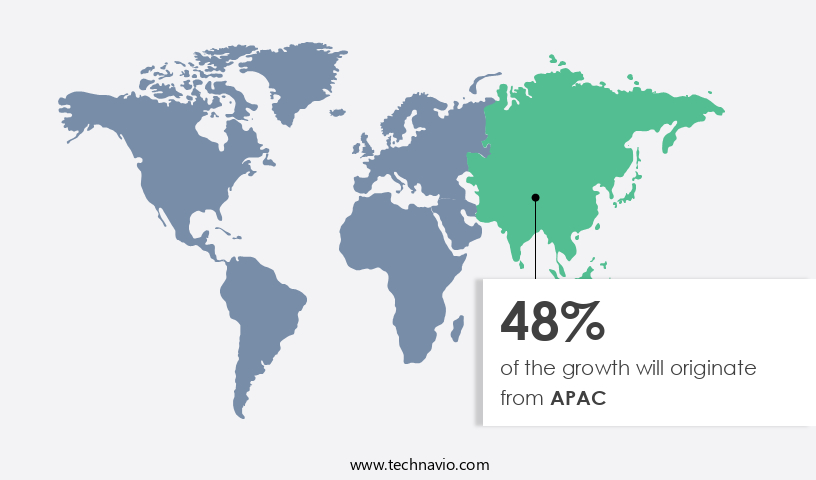
APAC is estimated to contribute 48% to the growth of the global market during the forecast period.Technavio's analysts have elaborately explained the regional trends and drivers that shape the market during the forecast period.

Skincare Products Market Share by Geography

 Request Free Sample

In the dynamic skincare market, hyaluronic acid, facial oils, facial scrubs, and various other products continue to gain popularity. The demand for broad spectrum UVB protection and customer segmentation based on skin concerns persists. Salicylic acid and retinol serums are favored for addressing specific skin issues, while night creams and eye creams cater to the needs of those seeking rejuvenation. Brand loyalty is a significant factor, with consumers often returning to trusted brands. Pricing strategy and ingredient sourcing are crucial elements in the market, with a growing preference for natural ingredients. Sheet masks, peel-off masks, and UVA protection are among the trends. The personal care industry embraces technology advancements, such as nanotechnology and biotechnology, to enhance manufacturing processes and create more effective active ingredients like hyaluronic acid and salicylic acid.

The supply chain is streamlined through e-commerce sales, ensuring easy access to a wide range of skincare products. Consumer behavior is influenced by factors like quality control, clinical trials, and the availability of active ingredients such as glycolic acid, hydrating serums, and active ingredients for various skin types, including combination, sensitive, oily, and dry skin. Anti-aging serums and sun protection continue to dominate the market, driven by increasing awareness of the importance of skincare. The APAC region, in particular, shows a high demand due to a growing concern for personal hygiene and wellness. Social media campaigns and celebrity endorsements further fuel the market's growth.

Market Dynamics

Our researchers analyzed the data with 2024 as the base year, along with the key drivers, trends, and challenges. A holistic analysis of drivers will help companies refine their marketing strategies to gain a competitive advantage.

What are the key market drivers leading to the rise in the adoption of Skincare Products Industry?

  • The significant increase in the popularity of in-home salon and spa services is the primary growth factor for this market. The market has experienced notable growth in recent years, particularly in the segments of retinol serums, night creams, eye creams, and various types of masks such as sheet masks and peel-off masks. This trend is evident in regions like North America, Europe, and APAC, where the demand for personalized and convenient grooming solutions has risen. A key factor driving this growth is the increasing awareness of the importance of proper skincare and the availability of advanced formulations. For instance, retinol serums, which contain vitamin A derivatives, are popular for their ability to reduce the appearance of fine lines and wrinkles.
  • Night creams, enriched with essential nutrients, are essential for skin regeneration during sleep. Pricing strategy and ingredient sourcing are crucial aspects of the market. Companies focus on offering competitive pricing while ensuring the highest quality ingredients, often sourced from reputable suppliers. UVA protection is another essential feature, as consumers become more conscious of the long-term effects of sun exposure on their skin. The supply chain for skincare products is complex, involving various stages from raw material sourcing to manufacturing, distribution, and retail sales. Effective marketing strategies, such as social media campaigns and influencer collaborations, help brands reach their target audience and build brand loyalty.

What are the market trends shaping the Skincare Products Industry?

  • The market is witnessing an upward trend towards heightened research and development efforts and the introduction of innovative new products. This inclination is driven by the increasing demand for advancements and improvements in various industries. Skincare product innovation continues to thrive as conglomerate companies invest substantially in research and development. This investment is driven by the increasing global demand for advanced skincare solutions. One notable trend is the development of multifunctional products, catering to consumers seeking cost-effective solutions. For instance, L'Oreal Paris's Revitalift Triple Power Anti-Aging Moisturizer, launched in October 2024, combines pro retinol, hyaluronic acid, and vitamin C to deeply hydrate, visibly reduce wrinkles, and brighten overall skin tone. Quality control and clinical trials are crucial components of this process, ensuring the efficacy and safety of these advanced formulations.
  • Natural ingredients, such as clay masks and active ingredients like glycolic acid, are also gaining popularity in the market due to their ability to address various skin concerns. Overall, The market is witnessing significant growth, driven by consumer behavior and the continuous pursuit of high-quality, effective solutions. Eye creams, designed specifically for the delicate skin around the eyes, are another significant segment of the skincare market. They cater to the increasing demand for products that address the specific concerns of aging, dark circles, and puffiness. Overall, the market is expected to continue its growth trajectory, driven by consumer preferences for personalized, effective, and convenient solutions.

What challenges does the Skincare Products Industry face during its growth?

  • The stringent regulations governing the manufacturing process of skincare products pose a significant challenge to the industry's growth, requiring companies to adhere to rigorous standards to ensure product safety and efficacy. In the US skincare market, the Food and Drug Administration (FDA) regulates the use of ingredients in skincare products, ensuring their safety for consumers. However, the FDA does not pre-test these products before they reach the market. For example, alpha-hydroxy acids (AHAs) are common ingredients in hydrating serums and anti-aging products. Excessive use of AHAs may lead to increased skin sensitivity to the sun, resulting in sunburn. The FDA regulates cosmetic and skincare products under the Federal Food, Drug, and Cosmetic Act (FFD&C Act) and the Fair Packaging and Labeling Act (FPLA).
  • Manufacturers must adhere to these regulations to ensure accurate and clear product labeling and packaging. Skincare product categories include hydrating serums for dry skin and anti-aging serums for combination and oily skin types. Sensitive skin individuals require extra caution when using skincare products, and manufacturers must clearly label any potential irritants. The US market for skincare products continues to grow, driven by consumer demand for effective and safe solutions for various skin concerns. Retail sales are influenced by various factors, including pricing strategy, customer loyalty, and supply chain management.

Exclusive Customer Landscape

The skincare products market forecasting report includes the adoption lifecycle of the market, covering from the innovator's stage to the laggard's stage. It focuses on adoption rates in different regions based on penetration. Furthermore, the skincare products market report also includes key purchase criteria and drivers of price sensitivity to help companies evaluate and develop their market growth analysis strategies.
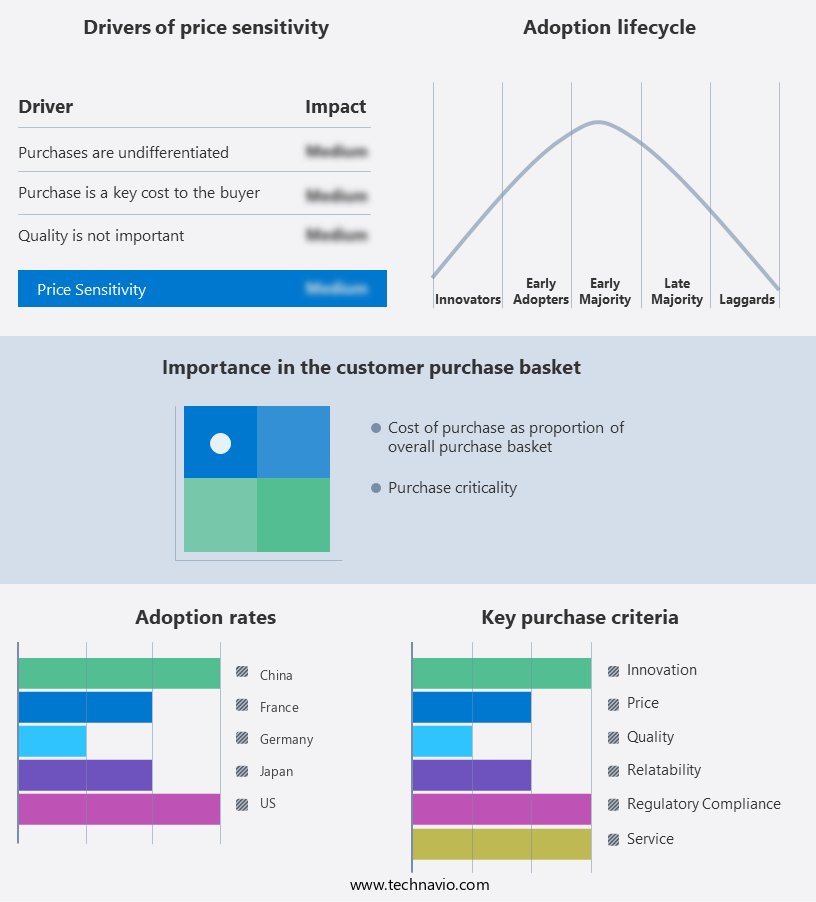
Skincare Products Market Share by Geography

 Customer Landscape

Key Companies & Market Insights

Companies are implementing various strategies, such as strategic alliances, skincare products market forecast, partnerships, mergers and acquisitions, geographical expansion, and product/service launches, to enhance their presence in the industry.

Alchimie Forever LLC - This company specializes in skincare solutions, providing innovative products such as the Treatment Enzyme peel cleansing powder and Moisture plumping nectar cream.

The industry research and growth report includes detailed analyses of the competitive landscape of the market and information about key companies, including:

  • Alchimie Forever LLC
  • Amorepacific Corp.
  • Amway Corp.
  • Bare Necessities Zero Waste Solutions Pvt. Ltd.
  • Beiersdorf AG
  • Belviso Co.
  • Botanic Organic Products LLC
  • Chanel Ltd.
  • Colgate Palmolive Co.
  • Coty Inc.
  • Emami Ltd.
  • Himalaya Global Holdings Ltd.
  • Johnson and Johnson Services Inc.
  • Kao Corp.
  • Lancer Skincare LLC
  • LOreal SA
  • LVMH Moet Hennessy Louis Vuitton SE
  • Natura and Co Holding SA
  • Patanjali Ayurved Ltd.
  • Revlon Inc.
  • Shiseido Co. Ltd.
  • The Estee Lauder Co. Inc.
  • The Procter and Gamble Co.
  • Unilever PLC
  • VLCC Health Care Ltd.
  • Weleda

Qualitative and quantitative analysis of companies has been conducted to help clients understand the wider business environment as well as the strengths and weaknesses of key industry players. Data is qualitatively analyzed to categorize companies as pure play, category-focused, industry-focused, and diversified; it is quantitatively analyzed to categorize companies as dominant, leading, strong, tentative, and weak.

Recent Development and News in Skincare Products Market

  • In January 2024, L'Oréal, a global cosmetics leader, launched a new range of skincare products, "Revitalift Derm," infused with stable RHA (Resilience-boosting Hyaluronic Acid) technology. This innovation addresses multiple signs of aging, marking a significant advancement in the anti-aging skincare segment (Source: L'Oréal Press Release).
  • In March 2024, Estée Lauder Companies entered into a strategic partnership with Deciem, a skincare brand known for its "The Ordinary" line. This collaboration aimed to expand Estée Lauder's reach in the niche skincare market and leverage Deciem's innovative, science-focused product offerings (Source: Estée Lauder Companies Press Release).
  • In May 2024, Unilever, a multinational consumer goods corporation, announced the acquisition of Paula's Choice, a leading online skincare retailer and brand. This acquisition strengthened Unilever's digital presence and expanded its skincare product portfolio (Source: Unilever Press Release).
  • In February 2025, the European Union approved the use of nanotechnology in cosmetics, including skincare products. This regulatory approval opened new opportunities for companies to develop and launch innovative, nanotech-based skincare solutions (Source: European Commission Press Release).

Research Analyst Overview

In the dynamic skincare market, consumers seek effective solutions for various skin concerns, including skin lightening, skin analysis, and skin brightening. Skincare regimens have evolved to address multiple issues, integrating skin barrier repair, sun damage protection, and anti-irritant ingredients. Cosmeceutical ingredients, such as anti-oxidant capacity and elastin production boosters, enhance product efficacy. Skin hydration, firmness, elasticity, and texture remain top priorities, necessitating innovation in over-the-counter skincare and prescription options. Shelf life, environmental impact, and packaging materials are crucial considerations for brands.

Sebum regulation and collagen production are key areas of focus for those concerned with age spots and free radical damage. Sun damage prevention and skin tone evenness are ongoing concerns, driving the demand for anti-irritant and anti-inflammatory ingredients. Market leaders invest in research and development, ensuring the efficacy of their anti-aging and skin brightening products. The integration of technology and natural ingredients continues to shape the skincare landscape.

Dive into Technavio's robust research methodology, blending expert interviews, extensive data synthesis, and validated models for unparalleled Skincare Products Market insights. See full methodology.

Market Scope

Report Coverage

Details

Page number

229

Base year

2024

Historic period

2019-2023

Forecast period

2025-2029

Growth momentum & CAGR

Accelerate at a CAGR of 5.9%

Market growth 2025-2029

USD 49 billion

Market structure

Fragmented

YoY growth 2024-2025(%)

5.2

Key countries

US, China, India, Japan, Germany, France, Canada, South Korea, Australia, and UK

Competitive landscape

Leading Companies, Market Positioning of Companies, Competitive Strategies, and Industry Risks

Request Free Sample

What are the Key Data Covered in this Skincare Products Market Research and Growth Report?

  • CAGR of the Skincare Products industry during the forecast period
  • Detailed information on factors that will drive the growth and forecasting between 2025 and 2029
  • Precise estimation of the size of the market and its contribution of the industry in focus to the parent market
  • Accurate predictions about upcoming growth and trends and changes in consumer behaviour
  • Growth of the market across APAC, North America, Europe, South America, and Middle East and Africa
  • Thorough analysis of the market's competitive landscape and detailed information about companies
  • Comprehensive analysis of factors that will challenge the skincare products market growth of industry companies

We can help! Our analysts can customize this skincare products market research report to meet your requirements.

Get in touch

1 Executive Summary

  • 1.1 Market overview
    • Executive Summary - Chart on Market Overview
    • Executive Summary - Data Table on Market Overview
    • Executive Summary - Chart on Global Market Characteristics
    • Executive Summary - Chart on Market by Geography
    • Executive Summary - Chart on Market Segmentation by Distribution Channel
    • Executive Summary - Chart on Market Segmentation by Product
    • Executive Summary - Chart on Market Segmentation by Product Specification
    • Executive Summary - Chart on Incremental Growth
    • Executive Summary - Data Table on Incremental Growth
    • Executive Summary - Chart on Company Market Positioning

2 Technavio Analysis

  • 2.1 Analysis of price sensitivity, lifecycle, customer purchase basket, adoption rates, and purchase criteria
    • Analysis of price sensitivity, lifecycle, customer purchase basket, adoption rates, and purchase criteria
  • 2.2 Criticality of inputs and Factors of differentiation
    • Overview on criticality of inputs and factors of differentiation
  • 2.3 Factors of disruption
    • Overview on factors of disruption
  • 2.4 Impact of drivers and challenges
    • Impact of drivers and challenges in 2024 and 2029

3 Market Landscape

  • 3.1 Market ecosystem
    • Parent Market
    • Data Table on - Parent Market
  • 3.2 Market characteristics
    • Market characteristics analysis
  • 3.3 Value chain analysis
    • Value chain analysis

4 Market Sizing

  • 4.1 Market definition
    • Offerings of companies included in the market definition
  • 4.2 Market segment analysis
    • Market segments
  • 4.3 Market size 2024
    • 4.4 Market outlook: Forecast for 2024-2029
      • Chart on Global - Market size and forecast 2024-2029 ($ billion)
      • Data Table on Global - Market size and forecast 2024-2029 ($ billion)
      • Chart on Global Market: Year-over-year growth 2024-2029 (%)
      • Data Table on Global Market: Year-over-year growth 2024-2029 (%)

    5 Historic Market Size

    • 5.1 Global Skincare Products Market 2019 - 2023
      • Historic Market Size - Data Table on Global Skincare Products Market 2019 - 2023 ($ billion)
    • 5.2 Distribution Channel segment analysis 2019 - 2023
      • Historic Market Size - Distribution Channel Segment 2019 - 2023 ($ billion)
    • 5.3 Product segment analysis 2019 - 2023
      • Historic Market Size - Product Segment 2019 - 2023 ($ billion)
    • 5.4 Product Specification segment analysis 2019 - 2023
      • Historic Market Size - Product Specification Segment 2019 - 2023 ($ billion)
    • 5.5 Geography segment analysis 2019 - 2023
      • Historic Market Size - Geography Segment 2019 - 2023 ($ billion)
    • 5.6 Country segment analysis 2019 - 2023
      • Historic Market Size - Country Segment 2019 - 2023 ($ billion)

    6 Qualitative Analysis

    • 6.1 Impact of AI in global skincare products market

      7 Five Forces Analysis

      • 7.1 Five forces summary
        • Five forces analysis - Comparison between 2024 and 2029
      • 7.2 Bargaining power of buyers
        • Bargaining power of buyers - Impact of key factors 2024 and 2029
      • 7.3 Bargaining power of suppliers
        • Bargaining power of suppliers - Impact of key factors in 2024 and 2029
      • 7.4 Threat of new entrants
        • Threat of new entrants - Impact of key factors in 2024 and 2029
      • 7.5 Threat of substitutes
        • Threat of substitutes - Impact of key factors in 2024 and 2029
      • 7.6 Threat of rivalry
        • Threat of rivalry - Impact of key factors in 2024 and 2029
      • 7.7 Market condition
        • Chart on Market condition - Five forces 2024 and 2029

      8 Market Segmentation by Distribution Channel

      • 8.1 Market segments
        • Chart on Distribution Channel - Market share 2024-2029 (%)
        • Data Table on Distribution Channel - Market share 2024-2029 (%)
      • 8.2 Comparison by Distribution Channel
        • Chart on Comparison by Distribution Channel
        • Data Table on Comparison by Distribution Channel
      • 8.3 Offline - Market size and forecast 2024-2029
        • Chart on Offline - Market size and forecast 2024-2029 ($ billion)
        • Data Table on Offline - Market size and forecast 2024-2029 ($ billion)
        • Chart on Offline - Year-over-year growth 2024-2029 (%)
        • Data Table on Offline - Year-over-year growth 2024-2029 (%)
      • 8.4 Online - Market size and forecast 2024-2029
        • Chart on Online - Market size and forecast 2024-2029 ($ billion)
        • Data Table on Online - Market size and forecast 2024-2029 ($ billion)
        • Chart on Online - Year-over-year growth 2024-2029 (%)
        • Data Table on Online - Year-over-year growth 2024-2029 (%)
      • 8.5 Market opportunity by Distribution Channel
        • Market opportunity by Distribution Channel ($ billion)
        • Data Table on Market opportunity by Distribution Channel ($ billion)

      9 Market Segmentation by Product

      • 9.1 Market segments
        • Chart on Product - Market share 2024-2029 (%)
        • Data Table on Product - Market share 2024-2029 (%)
      • 9.2 Comparison by Product
        • Chart on Comparison by Product
        • Data Table on Comparison by Product
      • 9.3 Face skincare products - Market size and forecast 2024-2029
        • Chart on Face skincare products - Market size and forecast 2024-2029 ($ billion)
        • Data Table on Face skincare products - Market size and forecast 2024-2029 ($ billion)
        • Chart on Face skincare products - Year-over-year growth 2024-2029 (%)
        • Data Table on Face skincare products - Year-over-year growth 2024-2029 (%)
      • 9.4 Body skincare products - Market size and forecast 2024-2029
        • Chart on Body skincare products - Market size and forecast 2024-2029 ($ billion)
        • Data Table on Body skincare products - Market size and forecast 2024-2029 ($ billion)
        • Chart on Body skincare products - Year-over-year growth 2024-2029 (%)
        • Data Table on Body skincare products - Year-over-year growth 2024-2029 (%)
      • 9.5 Market opportunity by Product
        • Market opportunity by Product ($ billion)
        • Data Table on Market opportunity by Product ($ billion)

      10 Market Segmentation by Product Specification

      • 10.1 Market segments
        • Chart on Product Specification - Market share 2024-2029 (%)
        • Data Table on Product Specification - Market share 2024-2029 (%)
      • 10.2 Comparison by Product Specification
        • Chart on Comparison by Product Specification
        • Data Table on Comparison by Product Specification
      • 10.3 Moisturizers - Market size and forecast 2024-2029
        • Chart on Moisturizers - Market size and forecast 2024-2029 ($ billion)
        • Data Table on Moisturizers - Market size and forecast 2024-2029 ($ billion)
        • Chart on Moisturizers - Year-over-year growth 2024-2029 (%)
        • Data Table on Moisturizers - Year-over-year growth 2024-2029 (%)
      • 10.4 Anti-aging skincare products - Market size and forecast 2024-2029
        • Chart on Anti-aging skincare products - Market size and forecast 2024-2029 ($ billion)
        • Data Table on Anti-aging skincare products - Market size and forecast 2024-2029 ($ billion)
        • Chart on Anti-aging skincare products - Year-over-year growth 2024-2029 (%)
        • Data Table on Anti-aging skincare products - Year-over-year growth 2024-2029 (%)
      • 10.5 Skin brightening products - Market size and forecast 2024-2029
        • Chart on Skin brightening products - Market size and forecast 2024-2029 ($ billion)
        • Data Table on Skin brightening products - Market size and forecast 2024-2029 ($ billion)
        • Chart on Skin brightening products - Year-over-year growth 2024-2029 (%)
        • Data Table on Skin brightening products - Year-over-year growth 2024-2029 (%)
      • 10.6 Sun protection products - Market size and forecast 2024-2029
        • Chart on Sun protection products - Market size and forecast 2024-2029 ($ billion)
        • Data Table on Sun protection products - Market size and forecast 2024-2029 ($ billion)
        • Chart on Sun protection products - Year-over-year growth 2024-2029 (%)
        • Data Table on Sun protection products - Year-over-year growth 2024-2029 (%)
      • 10.7 Others - Market size and forecast 2024-2029
        • Chart on Others - Market size and forecast 2024-2029 ($ billion)
        • Data Table on Others - Market size and forecast 2024-2029 ($ billion)
        • Chart on Others - Year-over-year growth 2024-2029 (%)
        • Data Table on Others - Year-over-year growth 2024-2029 (%)
      • 10.8 Market opportunity by Product Specification
        • Market opportunity by Product Specification ($ billion)
        • Data Table on Market opportunity by Product Specification ($ billion)

      11 Customer Landscape

      • 11.1 Customer landscape overview
        • Analysis of price sensitivity, lifecycle, customer purchase basket, adoption rates, and purchase criteria

      12 Geographic Landscape

      • 12.1 Geographic segmentation
        • Chart on Market share by geography 2024-2029 (%)
        • Data Table on Market share by geography 2024-2029 (%)
      • 12.2 Geographic comparison
        • Chart on Geographic comparison
        • Data Table on Geographic comparison
      • 12.3 APAC - Market size and forecast 2024-2029
        • Chart on APAC - Market size and forecast 2024-2029 ($ billion)
        • Data Table on APAC - Market size and forecast 2024-2029 ($ billion)
        • Chart on APAC - Year-over-year growth 2024-2029 (%)
        • Data Table on APAC - Year-over-year growth 2024-2029 (%)
      • 12.4 North America - Market size and forecast 2024-2029
        • Chart on North America - Market size and forecast 2024-2029 ($ billion)
        • Data Table on North America - Market size and forecast 2024-2029 ($ billion)
        • Chart on North America - Year-over-year growth 2024-2029 (%)
        • Data Table on North America - Year-over-year growth 2024-2029 (%)
      • 12.5 Europe - Market size and forecast 2024-2029
        • Chart on Europe - Market size and forecast 2024-2029 ($ billion)
        • Data Table on Europe - Market size and forecast 2024-2029 ($ billion)
        • Chart on Europe - Year-over-year growth 2024-2029 (%)
        • Data Table on Europe - Year-over-year growth 2024-2029 (%)
      • 12.6 South America - Market size and forecast 2024-2029
        • Chart on South America - Market size and forecast 2024-2029 ($ billion)
        • Data Table on South America - Market size and forecast 2024-2029 ($ billion)
        • Chart on South America - Year-over-year growth 2024-2029 (%)
        • Data Table on South America - Year-over-year growth 2024-2029 (%)
      • 12.7 Middle East and Africa - Market size and forecast 2024-2029
        • Chart on Middle East and Africa - Market size and forecast 2024-2029 ($ billion)
        • Data Table on Middle East and Africa - Market size and forecast 2024-2029 ($ billion)
        • Chart on Middle East and Africa - Year-over-year growth 2024-2029 (%)
        • Data Table on Middle East and Africa - Year-over-year growth 2024-2029 (%)
      • 12.8 US - Market size and forecast 2024-2029
        • Chart on US - Market size and forecast 2024-2029 ($ billion)
        • Data Table on US - Market size and forecast 2024-2029 ($ billion)
        • Chart on US - Year-over-year growth 2024-2029 (%)
        • Data Table on US - Year-over-year growth 2024-2029 (%)
      • 12.9 China - Market size and forecast 2024-2029
        • Chart on China - Market size and forecast 2024-2029 ($ billion)
        • Data Table on China - Market size and forecast 2024-2029 ($ billion)
        • Chart on China - Year-over-year growth 2024-2029 (%)
        • Data Table on China - Year-over-year growth 2024-2029 (%)
      • 12.10 India - Market size and forecast 2024-2029
        • Chart on India - Market size and forecast 2024-2029 ($ billion)
        • Data Table on India - Market size and forecast 2024-2029 ($ billion)
        • Chart on India - Year-over-year growth 2024-2029 (%)
        • Data Table on India - Year-over-year growth 2024-2029 (%)
      • 12.11 Japan - Market size and forecast 2024-2029
        • Chart on Japan - Market size and forecast 2024-2029 ($ billion)
        • Data Table on Japan - Market size and forecast 2024-2029 ($ billion)
        • Chart on Japan - Year-over-year growth 2024-2029 (%)
        • Data Table on Japan - Year-over-year growth 2024-2029 (%)
      • 12.12 Germany - Market size and forecast 2024-2029
        • Chart on Germany - Market size and forecast 2024-2029 ($ billion)
        • Data Table on Germany - Market size and forecast 2024-2029 ($ billion)
        • Chart on Germany - Year-over-year growth 2024-2029 (%)
        • Data Table on Germany - Year-over-year growth 2024-2029 (%)
      • 12.13 France - Market size and forecast 2024-2029
        • Chart on France - Market size and forecast 2024-2029 ($ billion)
        • Data Table on France - Market size and forecast 2024-2029 ($ billion)
        • Chart on France - Year-over-year growth 2024-2029 (%)
        • Data Table on France - Year-over-year growth 2024-2029 (%)
      • 12.14 Canada - Market size and forecast 2024-2029
        • Chart on Canada - Market size and forecast 2024-2029 ($ billion)
        • Data Table on Canada - Market size and forecast 2024-2029 ($ billion)
        • Chart on Canada - Year-over-year growth 2024-2029 (%)
        • Data Table on Canada - Year-over-year growth 2024-2029 (%)
      • 12.15 South Korea - Market size and forecast 2024-2029
        • Chart on South Korea - Market size and forecast 2024-2029 ($ billion)
        • Data Table on South Korea - Market size and forecast 2024-2029 ($ billion)
        • Chart on South Korea - Year-over-year growth 2024-2029 (%)
        • Data Table on South Korea - Year-over-year growth 2024-2029 (%)
      • 12.16 Australia - Market size and forecast 2024-2029
        • Chart on Australia - Market size and forecast 2024-2029 ($ billion)
        • Data Table on Australia - Market size and forecast 2024-2029 ($ billion)
        • Chart on Australia - Year-over-year growth 2024-2029 (%)
        • Data Table on Australia - Year-over-year growth 2024-2029 (%)
      • 12.17 UK - Market size and forecast 2024-2029
        • Chart on UK - Market size and forecast 2024-2029 ($ billion)
        • Data Table on UK - Market size and forecast 2024-2029 ($ billion)
        • Chart on UK - Year-over-year growth 2024-2029 (%)
        • Data Table on UK - Year-over-year growth 2024-2029 (%)
      • 12.18 Market opportunity by geography
        • Market opportunity by geography ($ billion)
        • Data Tables on Market opportunity by geography ($ billion)

      13 Drivers, Challenges, and Opportunity/Restraints

      • 13.1 Market drivers
        • 13.2 Market challenges
          • 13.3 Impact of drivers and challenges
            • Impact of drivers and challenges in 2024 and 2029
          • 13.4 Market opportunities/restraints

            14 Competitive Landscape

            • 14.1 Overview
              • 14.2 Competitive Landscape
                • Overview on criticality of inputs and factors of differentiation
              • 14.3 Landscape disruption
                • Overview on factors of disruption
              • 14.4 Industry risks
                • Impact of key risks on business

              15 Competitive Analysis

              • 15.1 Companies profiled
                • Companies covered
              • 15.2 Company ranking index
                • Company ranking index
              • 15.3 Market positioning of companies
                • Matrix on companies position and classification
              • 15.4 Amorepacific Corp.
                • Amorepacific Corp. - Overview
                • Amorepacific Corp. - Business segments
                • Amorepacific Corp. - Key news
                • Amorepacific Corp. - Key offerings
                • Amorepacific Corp. - Segment focus
                • SWOT
              • 15.5 Beiersdorf AG
                • Beiersdorf AG - Overview
                • Beiersdorf AG - Business segments
                • Beiersdorf AG - Key news
                • Beiersdorf AG - Key offerings
                • Beiersdorf AG - Segment focus
                • SWOT
              • 15.6 Colgate Palmolive Co.
                • Colgate Palmolive Co. - Overview
                • Colgate Palmolive Co. - Business segments
                • Colgate Palmolive Co. - Key news
                • Colgate Palmolive Co. - Key offerings
                • Colgate Palmolive Co. - Segment focus
                • SWOT
              • 15.7 Coty Inc.
                • Coty Inc. - Overview
                • Coty Inc. - Business segments
                • Coty Inc. - Key news
                • Coty Inc. - Key offerings
                • Coty Inc. - Segment focus
                • SWOT
              • 15.8 Himalaya Global Holdings Ltd.
                • Himalaya Global Holdings Ltd. - Overview
                • Himalaya Global Holdings Ltd. - Product / Service
                • Himalaya Global Holdings Ltd. - Key offerings
                • SWOT
              • 15.9 Johnson and Johnson Services Inc.
                • Johnson and Johnson Services Inc. - Overview
                • Johnson and Johnson Services Inc. - Business segments
                • Johnson and Johnson Services Inc. - Key news
                • Johnson and Johnson Services Inc. - Key offerings
                • Johnson and Johnson Services Inc. - Segment focus
                • SWOT
              • 15.10 Kao Corp.
                • Kao Corp. - Overview
                • Kao Corp. - Business segments
                • Kao Corp. - Key news
                • Kao Corp. - Key offerings
                • Kao Corp. - Segment focus
                • SWOT
              • 15.11 LOreal SA
                • LOreal SA - Overview
                • LOreal SA - Business segments
                • LOreal SA - Key news
                • LOreal SA - Key offerings
                • LOreal SA - Segment focus
                • SWOT
              • 15.12 Natura and Co Holding SA
                • Natura and Co Holding SA - Overview
                • Natura and Co Holding SA - Business segments
                • Natura and Co Holding SA - Key offerings
                • Natura and Co Holding SA - Segment focus
                • SWOT
              • 15.13 Patanjali Ayurved Ltd.
                • Patanjali Ayurved Ltd. - Overview
                • Patanjali Ayurved Ltd. - Product / Service
                • Patanjali Ayurved Ltd. - Key offerings
                • SWOT
              • 15.14 Revlon Inc.
                • Revlon Inc. - Overview
                • Revlon Inc. - Business segments
                • Revlon Inc. - Key offerings
                • Revlon Inc. - Segment focus
                • SWOT
              • 15.15 Shiseido Co. Ltd.
                • Shiseido Co. Ltd. - Overview
                • Shiseido Co. Ltd. - Business segments
                • Shiseido Co. Ltd. - Key news
                • Shiseido Co. Ltd. - Key offerings
                • Shiseido Co. Ltd. - Segment focus
                • SWOT
              • 15.16 The Estee Lauder Co. Inc.
                • The Estee Lauder Co. Inc. - Overview
                • The Estee Lauder Co. Inc. - Product / Service
                • The Estee Lauder Co. Inc. - Key news
                • The Estee Lauder Co. Inc. - Key offerings
                • SWOT
              • 15.17 The Procter and Gamble Co.
                • The Procter and Gamble Co. - Overview
                • The Procter and Gamble Co. - Business segments
                • The Procter and Gamble Co. - Key offerings
                • The Procter and Gamble Co. - Segment focus
                • SWOT
              • 15.18 Unilever PLC
                • Unilever PLC - Overview
                • Unilever PLC - Business segments
                • Unilever PLC - Key offerings
                • Unilever PLC - Segment focus
                • SWOT

              16 Appendix

              • 16.1 Scope of the report
                • 16.2 Inclusions and exclusions checklist
                  • Inclusions checklist
                  • Exclusions checklist
                • 16.3 Currency conversion rates for US$
                  • Currency conversion rates for US$
                • 16.4 Research methodology
                  • Research methodology
                • 16.5 Data procurement
                  • Information sources
                • 16.6 Data validation
                  • Data validation
                • 16.7 Validation techniques employed for market sizing
                  • Validation techniques employed for market sizing
                • 16.8 Data synthesis
                  • Data synthesis
                • 16.9 360 degree market analysis
                  • 360 degree market analysis
                • 16.10 List of abbreviations
                  • List of abbreviations

                Research Methodology

                Technavio presents a detailed picture of the market by way of study, synthesis, and summation of data from multiple sources. The analysts have presented the various facets of the market with a particular focus on identifying the key industry influencers. The data thus presented is comprehensive, reliable, and the result of extensive research, both primary and secondary.

                INFORMATION SOURCES

                Primary sources

                • Manufacturers and suppliers
                • Channel partners
                • Industry experts
                • Strategic decision makers

                Secondary sources

                • Industry journals and periodicals
                • Government data
                • Financial reports of key industry players
                • Historical data
                • Press releases

                DATA ANALYSIS

                Data Synthesis

                • Collation of data
                • Estimation of key figures
                • Analysis of derived insights

                Data Validation

                • Triangulation with data models
                • Reference against proprietary databases
                • Corroboration with industry experts

                REPORT WRITING

                Qualitative

                • Market drivers
                • Market challenges
                • Market trends
                • Five forces analysis

                Quantitative

                • Market size and forecast
                • Market segmentation
                • Geographical insights
                • Competitive landscape

                Interested in this report?

                Get your sample now to see our research methodology and insights!

                Download Now

                Frequently Asked Questions

                Skincare Products market growth will increase by $ 49 bn during 2025-2029.

                The Skincare Products market is expected to grow at a CAGR of 5.9% during 2025-2029.

                Skincare Products market is segmented by Distribution Channel( Offline, Online) Product( Face skincare products, Body skincare products, Sun protection products, Moisturizers, Others) Product Specification( Moisturizers, Anti-aging skincare products, Skin brightening products, Sun protection products, Others)

                Alchimie Forever LLC, Amorepacific Corp., Amway Corp., Bare Necessities Zero Waste Solutions Pvt. Ltd., Beiersdorf AG, Belviso Co., Botanic Organic Products LLC, Chanel Ltd., Colgate Palmolive Co., Coty Inc., Emami Ltd., Himalaya Global Holdings Ltd., Johnson and Johnson Services Inc., Kao Corp., Lancer Skincare LLC, LOreal SA, LVMH Moet Hennessy Louis Vuitton SE, Natura and Co Holding SA, Patanjali Ayurved Ltd., Revlon Inc., Shiseido Co. Ltd., The Estee Lauder Co. Inc., The Procter and Gamble Co., Unilever PLC, VLCC Health Care Ltd., Weleda are a few of the key vendors in the Skincare Products market.

                APAC will register the highest growth rate of 48% among the other regions. Therefore, the Skincare Products market in APAC is expected to garner significant business opportunities for the vendors during the forecast period.

                US, China, India, Japan, Germany, France, Canada, South Korea, Australia, UK

                • Rising adoption of home salon and spa servicesPersonalized home salons and spa services are an emerging trend in regions such as North America is the driving factor this market.
                • Europe is the driving factor this market.
                • and APAC. Over the last decade is the driving factor this market.
                • the number of app-based salon and spa service providers that offer at-home grooming services has grown significantly. Mobile apps enable consumers to order salon and spa services and meet make-over artists personally at the given address. There are several home salons and spa service providers in the market. For instance is the driving factor this market.
                • Housejoy is a home and personal salon service provider in India. It provides home salon services is the driving factor this market.
                • including makeup and spa services. The company offers several grooming and pampering packages is the driving factor this market.
                • such as Monthly Essential Package is the driving factor this market.
                • Monthly Grooming Package is the driving factor this market.
                • Tip to Toe Package is the driving factor this market.
                • Skin Radiance Package is the driving factor this market.
                • and Summer Skin Package is the driving factor this market.
                • to increase the frequency of services. One of the packages offered by the company is the SeaSoul body spa is the driving factor this market.
                • in which the professionals use herbal skincare products. Such offerings from makeup service providers lead to higher volume consumption of skincare products such as herbal body lotions is the driving factor this market.
                • facial creams is the driving factor this market.
                • and others. Similarly is the driving factor this market.
                • Glamsquad Inc. is the driving factor this market.
                • headquartered in the US is the driving factor this market.
                • offers hair is the driving factor this market.
                • facial is the driving factor this market.
                • makeup is the driving factor this market.
                • and special event services to its clients. It also offers makeup lessons and service packages is the driving factor this market.
                • such as summer packages is the driving factor this market.
                • makeup packages is the driving factor this market.
                • skincare packages is the driving factor this market.
                • and nail packages.Housejoy and Glamsquad have mobile and desktop applications for clients to book an appointment for grooming services. These services have witnessed an expansion and high demand due to their low service charges and the convenience of grooming services at home. Therefore is the driving factor this market.
                • the availability of such personalized home salons and spa services is expected to propel the growth of the global skincare products market during the forecast period. is the driving factor this market.

                The Skincare Products market vendors should focus on grabbing business opportunities from the Offline segment as it accounted for the largest market share in the base year.