Shipbuilding Market Analysis APAC, Europe, South America, North America, Middle East and Africa - China, South Korea, Japan, The Philippines, Poland, UK, US, France, Brazil, Saudi Arabia - Size and Forecast 2025-2029

Shipbuilding Market Analysis APAC, Europe, South America, North America, Middle East and Africa - China, South Korea, Japan, The Philippines, Poland, UK, US, France, Brazil, Saudi Arabia - Size and Forecast 2025-2029

Published: Jan 2025 202 Pages SKU: IRTNTR41384

Market Overview at a Glance

$26.1 B
Market Opportunity
4.4%
CAGR
4.2
YoY growth 2024-2025(%)

Shipbuilding Market Size 2025-2029 

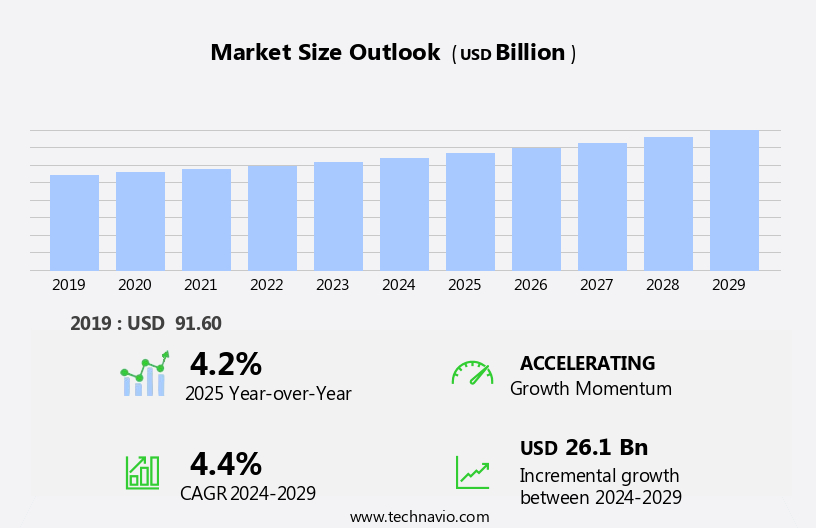
The shipbuilding market size is forecast to increase by USD 26.1 billion at a CAGR of 4.4% between 2024 and 2029.

  • The market is growing rapidly, driven by rising seaborne trade and the increasing demand for new vessels. Additionally, the shift toward eco-friendly ships is gaining traction, shaping the future of the maritime industry.
  • However, fluctuations in raw material prices pose a challenge for shipbuilders, as they can significantly impact production costs. The shipping industry's technological advancements, such as designing with 3D printing technology, implementing big data and drones for production planning, and developing autonomous ships, have revolutionized the manufacturing process. To mitigate this risk, companies are exploring alternative materials and sourcing strategies. Overall, the market is expected to continue its growth trajectory, driven by these trends and the ongoing demand for efficient and sustainable shipping solutions.

What will be the Shipbuilding Market Size During the Forecast Period?

Shipbuilding Market Size

 Request Free Sample

  • The market encompasses the manufacturing process of designing and constructing floating vessels for various trading activities and maintenance purposes. This industry plays a pivotal role in international seaborne trade, facilitating the transportation of commodities and goods across the globe. Technological improvement and upgradation are key drivers in the market, with a focus on fuel efficiency and the adoption of multi-fuel engines. Shipping companies continue to deploy modern fleets to meet the demands of growing international trade. However, overcapacity in the market poses a challenge, leading to intense competition and price pressures. The market caters to various vessel types, including container ships, LNG carriers, and specialized carriers.
  • Moreover, the manufacturing process of these vessels involves intricate designing and engineering, ensuring they meet the latest regulatory requirements and industry standards. Trading activities, such as imports and exports, are major consumers of shipping services, driving the growth of the market. Industrialization in emerging economies and the increasing importance of fuel efficiency in shipping are also significant factors influencing the market. The aging oil tanker fleet and the rise of commodity ship types, such as bulk carriers and tankers, further add to the market dynamics. Trade-related agreements and international regulations play a crucial role in shaping the market, with countries implementing policies to support their domestic industries and promote sustainable shipping practices. The industry continues to evolve, with a focus on innovation and technological advancements to meet the changing needs of global trade.

How is this market segmented and which is the largest segment?

The market research report provides comprehensive data (region-wise segment analysis), with forecasts and estimates in "USD billion" for the period 2025-2029, as well as historical data from 2019-2023 for the following segments.

  • Application
    • Commercial
    • Defense
  • Type
    • Oil tankers
    • Bulk carriers
    • Cargo ships
    • Others
  • Geography
    • APAC
      • China
      • Japan
      • South Korea
    • Europe
      • UK
      • France
    • South America
      • Brazil
    • North America
      • US
    • Middle East and Africa

By Application Insights

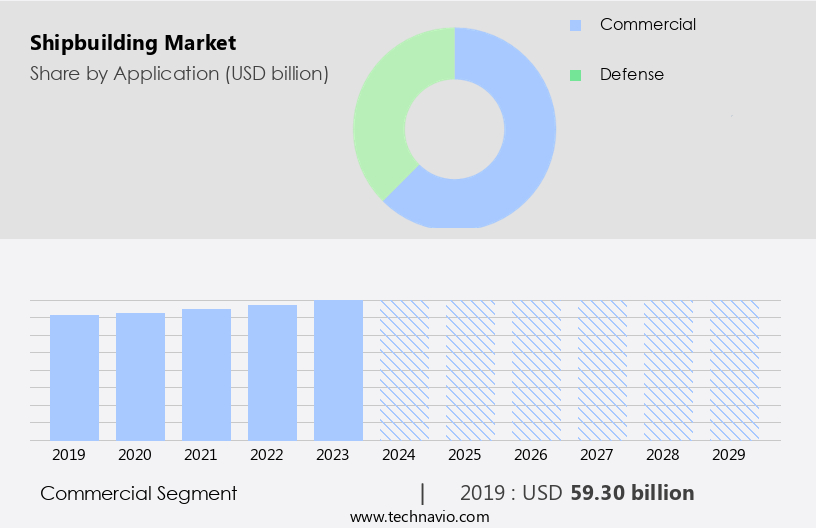
  • The commercial segment is estimated to witness significant growth during the forecast period.

The commercial market is experiencing growth due to the expanding international trade and maritime logistics. The rise in container handling operations at marine ports is driving the demand for commercial ships and vessels, particularly containerships, which are crucial for global trade. New seaports in emerging economies in Asia Pacific are further fueling the need for new container vessels, contributing to the expansion of the commercial shipbuilding sector. This segment encompasses various types of ships, including containerships, bulkers, tankers, cruise ships, and ferries. Containerships, which carry cargo in intermodal containers, have significantly influenced the development of global trade routes. The economic cycles and geopolitical tensions can impact the demand for commercial ships, but the overall trend remains positive.

Shipbuilding Market Size

Get a glance at the market report of share of various segments Request Free Sample

The commercial segment was valued at USD 59.30 billion in 2019 and showed a gradual increase during the forecast period.

Regional Analysis

  • APAC is estimated to contribute 61% to the growth of the global market during the forecast period.

Technavio's analysts have elaborately explained the regional trends and drivers that shape the market during the forecast period.

Shipbuilding Market Share by Geography

For more insights on the market share of various regions, Request Free Sample

The Asia Pacific (APAC) market is experiencing growth due to the expanding maritime transportation sector in the region. Countries such as China, Japan, South Korea, Singapore, Hong Kong, Thailand, and Malaysia are significant contributors to seaport transportation of goods, driving the shipbuilding industry's growth. These nations have numerous seaport hubs with high commercial container and vessel traffic. Furthermore, advancements in naval shipbuilding are fueling market expansion in the APAC region. Additionally, increasing population pressures in APAC countries necessitate governments to provide power for domestic and industrial use, leading to increased demand for shipbuilding. The APAC  market encompasses designing, manufacturing, and maintaining floating vessels for trading activities and technical improvement or upgradation purposes.

Market Dynamics

Our researchers analyzed the data with 2024 as the base year, along with the key drivers, trends, and challenges. A holistic analysis of drivers will help companies refine their marketing strategies to gain a competitive advantage.

What are the key market drivers leading to the rise in adoption of Shipbuilding Market?

Increasing seaborne trading is the key driver of the market.

  • The market has witnessed significant growth over the past few decades, driven by the expanding international seaborne trade and industrialization. Economic activities, such as foreign direct investments and increasing consumer purchasing power, have fueled the demand for transportation of goods via sea. Advanced technologies, including fuel-efficient multi-fuel engines and 3D printing, have made shipping an eco-friendly and cost-effective transportation method. Furthermore, the growth of the cruise industry and maritime tourism sector have added to the demand for new vessel construction.
  • However, economic cycles and geopolitical tensions can impact the market's growth. The market dynamics include the production planning process, which includes cutting and processing, assembling and launching, outfitting, and cargo vessel manufacturing. Various vessel types, such as container, tanker, multipurpose, and specialized carriers, are in high demand due to the increasing trade in goods. Trade-related agreements and free trade agreements have also influenced the shipping industry's growth. The market outlook remains positive, with ongoing technical improvements, upgradation of aging vessels, and the increasing importance of waterway transportation.

What are the market trends shaping the Shipbuilding Market?

An increase in demand for eco-friendly ships is the upcoming trend in the market.

  • The market encompasses the manufacturing process of designing, constructing, and outfitting floating vessels for trading activities and maintenance purposes. This industry plays a significant role in industrialization and international seaborne trade, as ships serve as a crucial transportation method for goods and commodities. With the focus on technical improvement and upgradation, the market is witnessing advancements such as the adoption of 3D printing technology, design standards, and big data analysis.
  • Furthermore, the industry outlook is positive, with the emergence of maritime tourism industry, autonomous ships, and multi-fuel engines. However, economic cycles and geopolitical tensions can impact the production planning and fleet deployment, leading to overcapacity and vessel types such as container ships, LNG tankers, and specialized carriers facing aging and trade-related challenges. Regulations, including those related to ballast water management and reducing greenhouse gas emissions, are essential in mitigating the environmental impact of the industry.

What challenges does Shipbuilding Market face during the growth?

Fluctuations in raw material prices are key challenges affecting the market growth.

  • The market is a significant sector in international seaborne trade and industrialization, encompassing the designing, manufacturing, and trading activities related to the construction of floating vessels. The manufacturing process involves various stages such as cutting and processing, assembling and launching, outfitting, and production planning. The market growth is influenced by several factors, including technical improvement, upgradation, imports, and exports. Raw materials, particularly steel and iron, play a crucial role in shipbuilding. Their costs and availability can impact the market's growth. For instance, the price of steel has shown considerable fluctuations since 2016, and this trend is expected to continue during the forecast period.
  • However, this volatility may pose challenges for the shipbuilding industry. Technical advancements, such as 3D printing technology, are transforming the industry. Design standards are evolving, with the integration of big data, drones, autonomous ships, and 3D printing in the design and production process. Vessel types, including container ships, tankers, multipurpose ships, and specialized carriers, are subject to economic cycles, geopolitical tensions, and trade-related agreements. Fuel efficiency and the adoption of multi-fuel engines are essential considerations for shipping companies, as they seek to optimize their transportation method. The cruise industry and cargo vessel manufacturers are focusing on the development of larger and more efficient vessels to cater to the growing demand for waterway transportation in goods trade.
  • In conclusion, the outlook for the shipbuilding industry is positive, with opportunities in LNG trade, fleet deployment, and overcapacity management. However, aging oil tankers and commodity ship types pose challenges for the market. In conclusion, the market is a dynamic and complex industry, influenced by various factors such as raw material costs, technological advancements, economic cycles, and geopolitical tensions. The market's growth is essential for the transportation of goods and the development of maritime tourism. Adapting to these trends and challenges will be crucial for the success of players in the shipbuilding industry.

Exclusive Customer Landscape

The market forecasting report includes the adoption lifecycle of the market, covering from the innovator's stage to the laggard's stage. It focuses on adoption rates in different regions based on penetration. Furthermore, the market report also includes key purchase criteria and drivers of price sensitivity to help companies evaluate and develop their market growth analysis strategies.
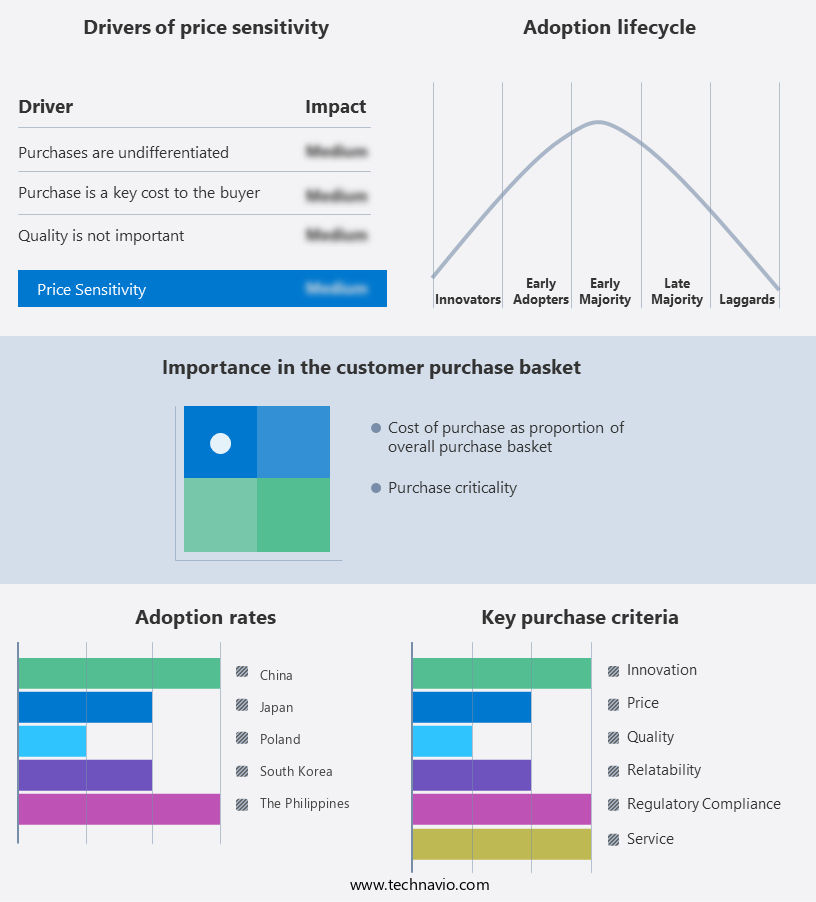
Shipbuilding Market Share by Geography

 Customer Landscape

Key Companies & Market Insights

Companies are implementing various strategies, such as strategic alliances, market forecast , partnerships, mergers and acquisitions, geographical expansion, and product/service launches, to enhance their presence in the market.

BAE Systems Plc - The company specializes in providing comprehensive shipbuilding solutions for the United States military, encompassing the construction of Naval vessels, Submarines, and Maritime services.

The market research and growth report includes detailed analyses of the competitive landscape of the market and information about key companies, including:

  • BAE Systems Plc
  • Cheoy Lee Shipyards Ltd.
  • Conrad Industries Inc.
  • Damen Shipyards Group
  • Derecktor Shipyards
  • Fincantieri Spa
  • Fr. Fassmer GmbH and Co. KG
  • General Dynamics Corp.
  • Huntington Ingalls Industries Inc.
  • Hyundai Heavy Industries Group
  • IHI Corp.
  • Imabari Shipbuilding Co. Ltd.
  • International Maritime Industries
  • Mitsubishi Heavy Industries Ltd.
  • Oshima Shipbuilding Co. Ltd.
  • Paramount Maritime Holdings
  • Samsung Heavy Industries Co. Ltd.
  • Sumitomo Heavy Industries Ltd.
  • Ulstein Group ASA
  • Uzmar Shipbuilding and Trade Inc.

Qualitative and quantitative analysis of companies has been conducted to help clients understand the wider business environment as well as the strengths and weaknesses of key market players. Data is qualitatively analyzed to categorize companies as pure play, category-focused, industry-focused, and diversified; it is quantitatively analyzed to categorize companies as dominant, leading, strong, tentative, and weak.

Research Analyst Overview

The market is a critical sector that plays a significant role in the international seaborne trade. This industry involves the manufacturing process of designing, building, and maintaining floating vessels for various trading activities and purposes. The market's growth is influenced by several factors, including industrialization, fuel efficiency, and technological advancements. Floating vessels are essential for transportation method in the global economy, facilitating the movement of goods and raw materials across the world. The shipbuilding industry's outlook remains positive, driven by the increasing demand for cargo vessels, including container, tanker, multipurpose ships, and specialized carriers. Designing and manufacturing ships is a complex process that involves several stages. These stages include cutting and processing, assembling and launching, outfitting, and maintenance purposes. The production planning for each stage is crucial to ensure the timely delivery of vessels to meet the needs of shipping companies and the maritime tourism industry. Technical improvement and upgradation are essential aspects of the market.

Furthermore, fuel efficiency is a significant concern for shipping companies, leading to the adoption of multi-fuel engines and other energy-saving technologies. Additionally, the use of 3D printing technology in the manufacturing process is gaining popularity due to its potential to reduce production time and costs. The international maritime industry is subject to economic cycles and geopolitical tensions that can impact the market. Global trade routes and fleet deployment are critical factors that influence the demand for new vessels. Overcapacity and aging oil tankers are challenges that the industry faces, leading to the need for trade-related agreements and the transportation of goods via waterway transportation. The cargo vessel manufacturing sector is a significant contributor to the market's growth. Container carriers and cargo vessels play a vital role in the goods trade, with container ships being the largest segment. Liquefied natural gas (LNG) trade is also a growing segment, with specialized carriers in high demand due to the increasing use of LNG as a fuel source.

In summary, the shipping industry's outlook remains positive, with the cruise industry and other sectors continuing to drive demand for new vessels. The use of big data, drones, and autonomous ships is transforming the industry, with advancements in design standards and augmented reality technology set to revolutionize the shipbuilding process. In conclusion, the market is a dynamic and evolving industry that plays a crucial role in the global economy. The manufacturing process of designing, building, and maintaining floating vessels is a complex process influenced by several factors, including fuel efficiency, technological advancements, and economic cycles. The industry's outlook remains positive, with the demand for cargo vessels, particularly container ships and specialized carriers, driving growth. The use of innovative technologies, such as 3D printing and autonomous ships, is set to transform the industry and create new opportunities for growth.

Market Scope

Report Coverage

Details

Page number

202

Base year

2024

Historic period

2019-2023

Forecast period

2025-2029

Growth momentum & CAGR

Accelerate at a CAGR of 4.4%

Market growth 2025-2029

USD 26.1 billion

Market structure

Fragmented

YoY growth 2024-2025(%)

4.2

Key countries

China, South Korea, Japan, The Philippines, Poland, UK, US, France, Brazil, and Saudi Arabia

Competitive landscape

Leading Companies, Market Positioning of Companies, Competitive Strategies, and Industry Risks

Request Free Sample

What are the Key Data Covered in this Market Research and Growth Report?

  • CAGR of the market during the forecast period
  • Detailed information on factors that will drive the market growth and forecasting between 2025 and 2029
  • Precise estimation of the size of the market  and its contribution of the market in focus to the parent market
  • Accurate predictions about upcoming market growth and trends and changes in consumer behaviour
  • Growth of the market across APAC, Europe, South America, North America, and Middle East and Africa
  • Thorough analysis of the market's competitive landscape and detailed information about companies
  • Comprehensive analysis of factors that will challenge the growth of market companies

We can help! Our analysts can customize this market research report to meet your requirements. Get in touch

1 Executive Summary

  • 1.1 Market overview
    • Executive Summary - Chart on Market Overview
    • Executive Summary - Data Table on Market Overview
    • Executive Summary - Chart on Global Market Characteristics
    • Executive Summary - Chart on Market by Geography
    • Executive Summary - Chart on Market Segmentation by Application
    • Executive Summary - Chart on Market Segmentation by Type
    • Executive Summary - Chart on Incremental Growth
    • Executive Summary - Data Table on Incremental Growth
    • Executive Summary - Chart on Company Market Positioning

2 Technavio Analysis

  • 2.1 Analysis of price sensitivity, lifecycle, customer purchase basket, adoption rates, and purchase criteria
    • Analysis of price sensitivity, lifecycle, customer purchase basket, adoption rates, and purchase criteria
  • 2.2 Criticality of inputs and Factors of differentiation
    • Overview on criticality of inputs and factors of differentiation
  • 2.3 Factors of disruption
    • Overview on factors of disruption
  • 2.4 Impact of drivers and challenges
    • Impact of drivers and challenges in 2024 and 2029

3 Market Landscape

  • 3.1 Market ecosystem
    • Parent Market
    • Data Table on - Parent Market
  • 3.2 Market characteristics
    • Market characteristics analysis
  • 3.3 Value chain analysis
    • Value chain analysis

4 Market Sizing

  • 4.1 Market definition
    • Offerings of companies included in the market definition
  • 4.2 Market segment analysis
    • Market segments
  • 4.3 Market size 2024
    • 4.4 Market outlook: Forecast for 2024-2029
      • Chart on Global - Market size and forecast 2024-2029 ($ billion)
      • Data Table on Global - Market size and forecast 2024-2029 ($ billion)
      • Chart on Global Market: Year-over-year growth 2024-2029 (%)
      • Data Table on Global Market: Year-over-year growth 2024-2029 (%)

    5 Historic Market Size

    • 5.1 Global Shipbuilding Market 2019 - 2023
      • Historic Market Size - Data Table on Global Shipbuilding Market 2019 - 2023 ($ billion)
    • 5.2 Application segment analysis 2019 - 2023
      • Historic Market Size - Application Segment 2019 - 2023 ($ billion)
    • 5.3 Type segment analysis 2019 - 2023
      • Historic Market Size - Type Segment 2019 - 2023 ($ billion)
    • 5.4 Geography segment analysis 2019 - 2023
      • Historic Market Size - Geography Segment 2019 - 2023 ($ billion)
    • 5.5 Country segment analysis 2019 - 2023
      • Historic Market Size - Country Segment 2019 - 2023 ($ billion)

    6 Qualitative Analysis

    • 6.1 AI Impact on Shipbuilding market

      7 Five Forces Analysis

      • 7.1 Five forces summary
        • Five forces analysis - Comparison between 2024 and 2029
      • 7.2 Bargaining power of buyers
        • Bargaining power of buyers - Impact of key factors 2024 and 2029
      • 7.3 Bargaining power of suppliers
        • Bargaining power of suppliers - Impact of key factors in 2024 and 2029
      • 7.4 Threat of new entrants
        • Threat of new entrants - Impact of key factors in 2024 and 2029
      • 7.5 Threat of substitutes
        • Threat of substitutes - Impact of key factors in 2024 and 2029
      • 7.6 Threat of rivalry
        • Threat of rivalry - Impact of key factors in 2024 and 2029
      • 7.7 Market condition
        • Chart on Market condition - Five forces 2024 and 2029

      8 Market Segmentation by Application

      • 8.1 Market segments
        • Chart on Application - Market share 2024-2029 (%)
        • Data Table on Application - Market share 2024-2029 (%)
      • 8.2 Comparison by Application
        • Chart on Comparison by Application
        • Data Table on Comparison by Application
      • 8.3 Commercial - Market size and forecast 2024-2029
        • Chart on Commercial - Market size and forecast 2024-2029 ($ billion)
        • Data Table on Commercial - Market size and forecast 2024-2029 ($ billion)
        • Chart on Commercial - Year-over-year growth 2024-2029 (%)
        • Data Table on Commercial - Year-over-year growth 2024-2029 (%)
      • 8.4 Defense - Market size and forecast 2024-2029
        • Chart on Defense - Market size and forecast 2024-2029 ($ billion)
        • Data Table on Defense - Market size and forecast 2024-2029 ($ billion)
        • Chart on Defense - Year-over-year growth 2024-2029 (%)
        • Data Table on Defense - Year-over-year growth 2024-2029 (%)
      • 8.5 Market opportunity by Application
        • Market opportunity by Application ($ billion)
        • Data Table on Market opportunity by Application ($ billion)

      9 Market Segmentation by Type

      • 9.1 Market segments
        • Chart on Type - Market share 2024-2029 (%)
        • Data Table on Type - Market share 2024-2029 (%)
      • 9.2 Comparison by Type
        • Chart on Comparison by Type
        • Data Table on Comparison by Type
      • 9.3 Oil tankers - Market size and forecast 2024-2029
        • Chart on Oil tankers - Market size and forecast 2024-2029 ($ billion)
        • Data Table on Oil tankers - Market size and forecast 2024-2029 ($ billion)
        • Chart on Oil tankers - Year-over-year growth 2024-2029 (%)
        • Data Table on Oil tankers - Year-over-year growth 2024-2029 (%)
      • 9.4 Bulk carriers - Market size and forecast 2024-2029
        • Chart on Bulk carriers - Market size and forecast 2024-2029 ($ billion)
        • Data Table on Bulk carriers - Market size and forecast 2024-2029 ($ billion)
        • Chart on Bulk carriers - Year-over-year growth 2024-2029 (%)
        • Data Table on Bulk carriers - Year-over-year growth 2024-2029 (%)
      • 9.5 Cargo ships - Market size and forecast 2024-2029
        • Chart on Cargo ships - Market size and forecast 2024-2029 ($ billion)
        • Data Table on Cargo ships - Market size and forecast 2024-2029 ($ billion)
        • Chart on Cargo ships - Year-over-year growth 2024-2029 (%)
        • Data Table on Cargo ships - Year-over-year growth 2024-2029 (%)
      • 9.6 Others - Market size and forecast 2024-2029
        • Chart on Others - Market size and forecast 2024-2029 ($ billion)
        • Data Table on Others - Market size and forecast 2024-2029 ($ billion)
        • Chart on Others - Year-over-year growth 2024-2029 (%)
        • Data Table on Others - Year-over-year growth 2024-2029 (%)
      • 9.7 Market opportunity by Type
        • Market opportunity by Type ($ billion)
        • Data Table on Market opportunity by Type ($ billion)

      10 Customer Landscape

      • 10.1 Customer landscape overview
        • Analysis of price sensitivity, lifecycle, customer purchase basket, adoption rates, and purchase criteria

      11 Geographic Landscape

      • 11.1 Geographic segmentation
        • Chart on Market share by geography 2024-2029 (%)
        • Data Table on Market share by geography 2024-2029 (%)
      • 11.2 Geographic comparison
        • Chart on Geographic comparison
        • Data Table on Geographic comparison
      • 11.3 APAC - Market size and forecast 2024-2029
        • Chart on APAC - Market size and forecast 2024-2029 ($ billion)
        • Data Table on APAC - Market size and forecast 2024-2029 ($ billion)
        • Chart on APAC - Year-over-year growth 2024-2029 (%)
        • Data Table on APAC - Year-over-year growth 2024-2029 (%)
      • 11.4 Europe - Market size and forecast 2024-2029
        • Chart on Europe - Market size and forecast 2024-2029 ($ billion)
        • Data Table on Europe - Market size and forecast 2024-2029 ($ billion)
        • Chart on Europe - Year-over-year growth 2024-2029 (%)
        • Data Table on Europe - Year-over-year growth 2024-2029 (%)
      • 11.5 South America - Market size and forecast 2024-2029
        • Chart on South America - Market size and forecast 2024-2029 ($ billion)
        • Data Table on South America - Market size and forecast 2024-2029 ($ billion)
        • Chart on South America - Year-over-year growth 2024-2029 (%)
        • Data Table on South America - Year-over-year growth 2024-2029 (%)
      • 11.6 North America - Market size and forecast 2024-2029
        • Chart on North America - Market size and forecast 2024-2029 ($ billion)
        • Data Table on North America - Market size and forecast 2024-2029 ($ billion)
        • Chart on North America - Year-over-year growth 2024-2029 (%)
        • Data Table on North America - Year-over-year growth 2024-2029 (%)
      • 11.7 Middle East and Africa - Market size and forecast 2024-2029
        • Chart on Middle East and Africa - Market size and forecast 2024-2029 ($ billion)
        • Data Table on Middle East and Africa - Market size and forecast 2024-2029 ($ billion)
        • Chart on Middle East and Africa - Year-over-year growth 2024-2029 (%)
        • Data Table on Middle East and Africa - Year-over-year growth 2024-2029 (%)
      • 11.8 China - Market size and forecast 2024-2029
        • Chart on China - Market size and forecast 2024-2029 ($ billion)
        • Data Table on China - Market size and forecast 2024-2029 ($ billion)
        • Chart on China - Year-over-year growth 2024-2029 (%)
        • Data Table on China - Year-over-year growth 2024-2029 (%)
      • 11.9 South Korea - Market size and forecast 2024-2029
        • Chart on South Korea - Market size and forecast 2024-2029 ($ billion)
        • Data Table on South Korea - Market size and forecast 2024-2029 ($ billion)
        • Chart on South Korea - Year-over-year growth 2024-2029 (%)
        • Data Table on South Korea - Year-over-year growth 2024-2029 (%)
      • 11.10 Japan - Market size and forecast 2024-2029
        • Chart on Japan - Market size and forecast 2024-2029 ($ billion)
        • Data Table on Japan - Market size and forecast 2024-2029 ($ billion)
        • Chart on Japan - Year-over-year growth 2024-2029 (%)
        • Data Table on Japan - Year-over-year growth 2024-2029 (%)
      • 11.11 The Philippines - Market size and forecast 2024-2029
        • Chart on The Philippines - Market size and forecast 2024-2029 ($ billion)
        • Data Table on The Philippines - Market size and forecast 2024-2029 ($ billion)
        • Chart on The Philippines - Year-over-year growth 2024-2029 (%)
        • Data Table on The Philippines - Year-over-year growth 2024-2029 (%)
      • 11.12 Poland - Market size and forecast 2024-2029
        • Chart on Poland - Market size and forecast 2024-2029 ($ billion)
        • Data Table on Poland - Market size and forecast 2024-2029 ($ billion)
        • Chart on Poland - Year-over-year growth 2024-2029 (%)
        • Data Table on Poland - Year-over-year growth 2024-2029 (%)
      • 11.13 UK - Market size and forecast 2024-2029
        • Chart on UK - Market size and forecast 2024-2029 ($ billion)
        • Data Table on UK - Market size and forecast 2024-2029 ($ billion)
        • Chart on UK - Year-over-year growth 2024-2029 (%)
        • Data Table on UK - Year-over-year growth 2024-2029 (%)
      • 11.14 US - Market size and forecast 2024-2029
        • Chart on US - Market size and forecast 2024-2029 ($ billion)
        • Data Table on US - Market size and forecast 2024-2029 ($ billion)
        • Chart on US - Year-over-year growth 2024-2029 (%)
        • Data Table on US - Year-over-year growth 2024-2029 (%)
      • 11.15 France - Market size and forecast 2024-2029
        • Chart on France - Market size and forecast 2024-2029 ($ billion)
        • Data Table on France - Market size and forecast 2024-2029 ($ billion)
        • Chart on France - Year-over-year growth 2024-2029 (%)
        • Data Table on France - Year-over-year growth 2024-2029 (%)
      • 11.16 Brazil - Market size and forecast 2024-2029
        • Chart on Brazil - Market size and forecast 2024-2029 ($ billion)
        • Data Table on Brazil - Market size and forecast 2024-2029 ($ billion)
        • Chart on Brazil - Year-over-year growth 2024-2029 (%)
        • Data Table on Brazil - Year-over-year growth 2024-2029 (%)
      • 11.17 Saudi Arabia - Market size and forecast 2024-2029
        • Chart on Saudi Arabia - Market size and forecast 2024-2029 ($ billion)
        • Data Table on Saudi Arabia - Market size and forecast 2024-2029 ($ billion)
        • Chart on Saudi Arabia - Year-over-year growth 2024-2029 (%)
        • Data Table on Saudi Arabia - Year-over-year growth 2024-2029 (%)
      • 11.18 Market opportunity by geography
        • Market opportunity by geography ($ billion)
        • Data Tables on Market opportunity by geography ($ billion)

      12 Drivers, Challenges, and Opportunity/Restraints

      • 12.1 Market drivers
        • 12.2 Market challenges
          • 12.3 Impact of drivers and challenges
            • Impact of drivers and challenges in 2024 and 2029
          • 12.4 Market opportunities/restraints

            13 Competitive Landscape

            • 13.1 Overview
              • 13.2 Competitive Landscape
                • Overview on criticality of inputs and factors of differentiation
              • 13.3 Landscape disruption
                • Overview on factors of disruption
              • 13.4 Industry risks
                • Impact of key risks on business

              14 Competitive Analysis

              • 14.1 Companies profiled
                • Companies covered
              • 14.2 Company ranking index
                • Company ranking index
              • 14.3 Market positioning of companies
                • Matrix on companies position and classification
              • 14.4 BAE Systems Plc
                • BAE Systems Plc - Overview
                • BAE Systems Plc - Business segments
                • BAE Systems Plc - Key news
                • BAE Systems Plc - Key offerings
                • BAE Systems Plc - Segment focus
                • SWOT
              • 14.5 Cheoy Lee Shipyards Ltd.
                • Cheoy Lee Shipyards Ltd. - Overview
                • Cheoy Lee Shipyards Ltd. - Product / Service
                • Cheoy Lee Shipyards Ltd. - Key offerings
                • SWOT
              • 14.6 Conrad Industries Inc.
                • Conrad Industries Inc. - Overview
                • Conrad Industries Inc. - Business segments
                • Conrad Industries Inc. - Key offerings
                • Conrad Industries Inc. - Segment focus
                • SWOT
              • 14.7 Damen Shipyards Group
                • Damen Shipyards Group - Overview
                • Damen Shipyards Group - Product / Service
                • Damen Shipyards Group - Key offerings
                • SWOT
              • 14.8 Derecktor Shipyards
                • Derecktor Shipyards - Overview
                • Derecktor Shipyards - Product / Service
                • Derecktor Shipyards - Key offerings
                • SWOT
              • 14.9 Fincantieri Spa
                • Fincantieri Spa - Overview
                • Fincantieri Spa - Business segments
                • Fincantieri Spa - Key offerings
                • Fincantieri Spa - Segment focus
                • SWOT
              • 14.10 Fr. Fassmer GmbH and Co. KG
                • Fr. Fassmer GmbH and Co. KG - Overview
                • Fr. Fassmer GmbH and Co. KG - Product / Service
                • Fr. Fassmer GmbH and Co. KG - Key news
                • Fr. Fassmer GmbH and Co. KG - Key offerings
                • SWOT
              • 14.11 General Dynamics Corp.
                • General Dynamics Corp. - Overview
                • General Dynamics Corp. - Business segments
                • General Dynamics Corp. - Key news
                • General Dynamics Corp. - Key offerings
                • General Dynamics Corp. - Segment focus
                • SWOT
              • 14.12 Huntington Ingalls Industries Inc.
                • Huntington Ingalls Industries Inc. - Overview
                • Huntington Ingalls Industries Inc. - Business segments
                • Huntington Ingalls Industries Inc. - Key offerings
                • Huntington Ingalls Industries Inc. - Segment focus
                • SWOT
              • 14.13 Hyundai Heavy Industries Group
                • Hyundai Heavy Industries Group - Overview
                • Hyundai Heavy Industries Group - Product / Service
                • Hyundai Heavy Industries Group - Key offerings
                • SWOT
              • 14.14 Imabari Shipbuilding Co. Ltd.
                • Imabari Shipbuilding Co. Ltd. - Overview
                • Imabari Shipbuilding Co. Ltd. - Product / Service
                • Imabari Shipbuilding Co. Ltd. - Key offerings
                • SWOT
              • 14.15 Mitsubishi Heavy Industries Ltd.
                • Mitsubishi Heavy Industries Ltd. - Overview
                • Mitsubishi Heavy Industries Ltd. - Business segments
                • Mitsubishi Heavy Industries Ltd. - Key news
                • Mitsubishi Heavy Industries Ltd. - Key offerings
                • Mitsubishi Heavy Industries Ltd. - Segment focus
                • SWOT
              • 14.16 Oshima Shipbuilding Co. Ltd.
                • Oshima Shipbuilding Co. Ltd. - Overview
                • Oshima Shipbuilding Co. Ltd. - Product / Service
                • Oshima Shipbuilding Co. Ltd. - Key offerings
                • SWOT
              • 14.17 Samsung Heavy Industries Co. Ltd.
                • Samsung Heavy Industries Co. Ltd. - Overview
                • Samsung Heavy Industries Co. Ltd. - Product / Service
                • Samsung Heavy Industries Co. Ltd. - Key offerings
                • SWOT
              • 14.18 Sumitomo Heavy Industries Ltd.
                • Sumitomo Heavy Industries Ltd. - Overview
                • Sumitomo Heavy Industries Ltd. - Product / Service
                • Sumitomo Heavy Industries Ltd. - Key news
                • Sumitomo Heavy Industries Ltd. - Key offerings
                • SWOT

              15 Appendix

              • 15.1 Scope of the report
                • 15.2 Inclusions and exclusions checklist
                  • Inclusions checklist
                  • Exclusions checklist
                • 15.3 Currency conversion rates for US$
                  • Currency conversion rates for US$
                • 15.4 Research methodology
                  • Research methodology
                • 15.5 Data procurement
                  • Information sources
                • 15.6 Data validation
                  • Data validation
                • 15.7 Validation techniques employed for market sizing
                  • Validation techniques employed for market sizing
                • 15.8 Data synthesis
                  • Data synthesis
                • 15.9 360 degree market analysis
                  • 360 degree market analysis
                • 15.10 List of abbreviations
                  • List of abbreviations

                Research Methodology

                Technavio presents a detailed picture of the market by way of study, synthesis, and summation of data from multiple sources. The analysts have presented the various facets of the market with a particular focus on identifying the key industry influencers. The data thus presented is comprehensive, reliable, and the result of extensive research, both primary and secondary.

                INFORMATION SOURCES

                Primary sources

                • Manufacturers and suppliers
                • Channel partners
                • Industry experts
                • Strategic decision makers

                Secondary sources

                • Industry journals and periodicals
                • Government data
                • Financial reports of key industry players
                • Historical data
                • Press releases

                DATA ANALYSIS

                Data Synthesis

                • Collation of data
                • Estimation of key figures
                • Analysis of derived insights

                Data Validation

                • Triangulation with data models
                • Reference against proprietary databases
                • Corroboration with industry experts

                REPORT WRITING

                Qualitative

                • Market drivers
                • Market challenges
                • Market trends
                • Five forces analysis

                Quantitative

                • Market size and forecast
                • Market segmentation
                • Geographical insights
                • Competitive landscape

                Interested in this report?

                Get your sample now to see our research methodology and insights!

                Download Now

                Frequently Asked Questions

                Shipbuilding market growth will increase by $ 26.1 bn during 2025-2029.

                The Shipbuilding market is expected to grow at a CAGR of 4.4% during 2025-2029.

                Shipbuilding market is segmented by Application( Commercial, Defense) Type( Oil tankers, Bulk carriers, Cargo ships, Others)

                BAE Systems Plc, Cheoy Lee Shipyards Ltd., Conrad Industries Inc., Damen Shipyards Group, Derecktor Shipyards, Fincantieri Spa, Fr. Fassmer GmbH and Co. KG, General Dynamics Corp., Huntington Ingalls Industries Inc., Hyundai Heavy Industries Group, IHI Corp., Imabari Shipbuilding Co. Ltd., International Maritime Industries, Mitsubishi Heavy Industries Ltd., Oshima Shipbuilding Co. Ltd., Paramount Maritime Holdings, Samsung Heavy Industries Co. Ltd., Sumitomo Heavy Industries Ltd., Ulstein Group ASA, Uzmar Shipbuilding and Trade Inc. are a few of the key vendors in the Shipbuilding market.

                APAC will register the highest growth rate of 61% among the other regions. Therefore, the Shipbuilding market in APAC is expected to garner significant business opportunities for the vendors during the forecast period.

                China, South Korea, Japan, The Philippines, Poland, UK, US, France, Brazil, Saudi Arabia

                • Increasing seaborne tradingThroughout the last couple of decades is the driving factor this market.
                • the shipping industry has recorded an increase in the total trade volume. The prominent factors propelling trade volumes include rapid industrialization and the liberalization of economies that are increasing the trade volume between two countries. The increasing economic activities is the driving factor this market.
                • such as foreign direct investments is the driving factor this market.
                • have heightened consumer purchasing power. This has augmented the demand for consumer products. Another factor contributing to seaborne trading includes advances in technology. The improved fuel efficiency and multi-fuel engine have made shipping an efficient method of transportation. Therefore is the driving factor this market.
                • shipping is one of the fuel-efficient and carbon-friendly forms of commercial transport. The demand for goods and raw materials is increasing from emerging economies owing to the increasing population of these countries. This is further bolstering the rising seaborne trading. This would increase the need to build cargo ships or containers or bulkers. The below graph illustrates the year-over-year increase in the volume of goods loaded at world ports. It includes crude oil loaded is the driving factor this market.
                • petroleum product and gas loaded is the driving factor this market.
                • and dry cargo loaded at world ports. is the driving factor this market.

                The Shipbuilding market vendors should focus on grabbing business opportunities from the Commercial segment as it accounted for the largest market share in the base year.