Shark Meat Market Analysis, Size, and Forecast 2026-2030: APAC (Indonesia, Japan, and India), Europe (Spain, Italy, and France), North America (US, Mexico, and Canada), South America (Brazil), Middle East and Africa (South Africa, UAE, and Saudi Arabia), and Rest of World (ROW)

Shark Meat Market Analysis, Size, and Forecast 2026-2030:
APAC (Indonesia, Japan, and India), Europe (Spain, Italy, and France), North America (US, Mexico, and Canada), South America (Brazil), Middle East and Africa (South Africa, UAE, and Saudi Arabia), and Rest of World (ROW)

Published: Apr 2026 277 Pages SKU: IRTNTR70445

Market Overview at a Glance

$148.6 Mn
Market Opportunity
2.4%
CAGR 2025 - 2030
52.8%
APAC Growth
$658.5 Mn
Shark meat segment 2024

Shark Meat Market Size 2026-2030

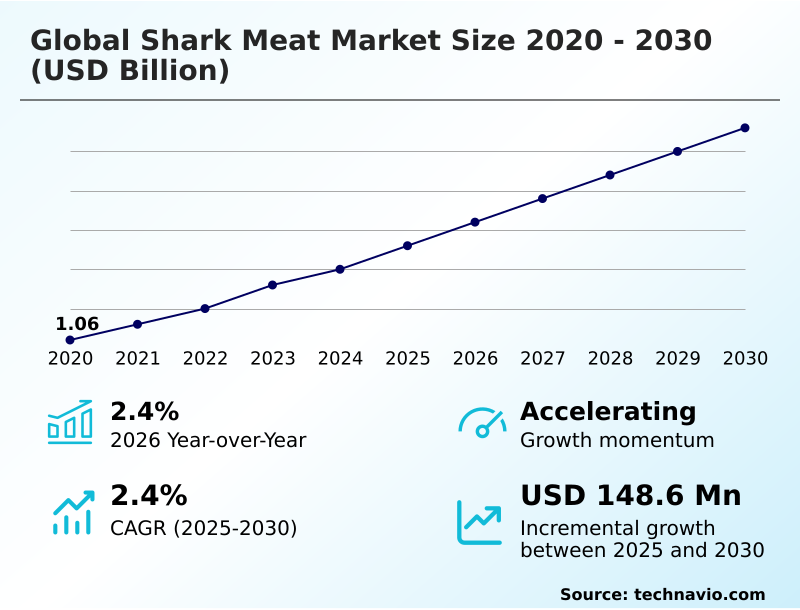
The shark meat market size is valued to increase by USD 148.6 million, at a CAGR of 2.4% from 2025 to 2030. Strategic mainstreaming of high-protein nutritional profiles and culinary diversification will drive the shark meat market.

Major Market Trends & Insights

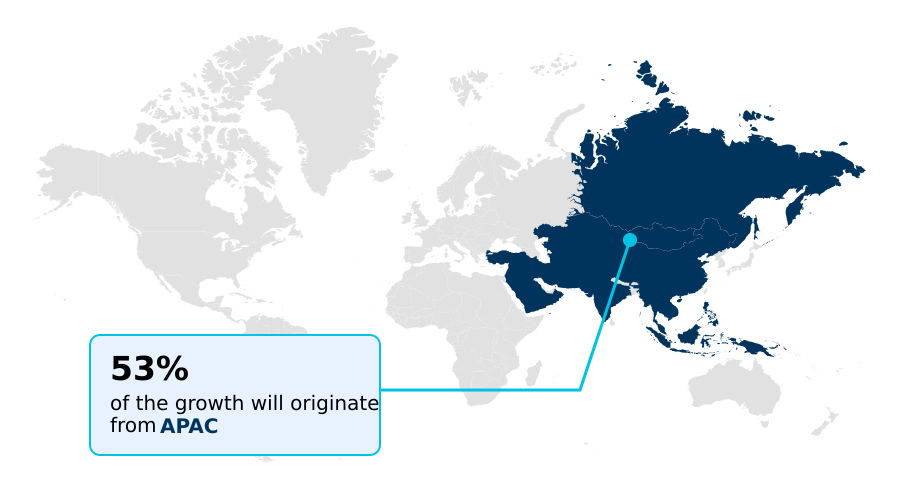
  • APAC dominated the market and accounted for a 52.8% growth during the forecast period.
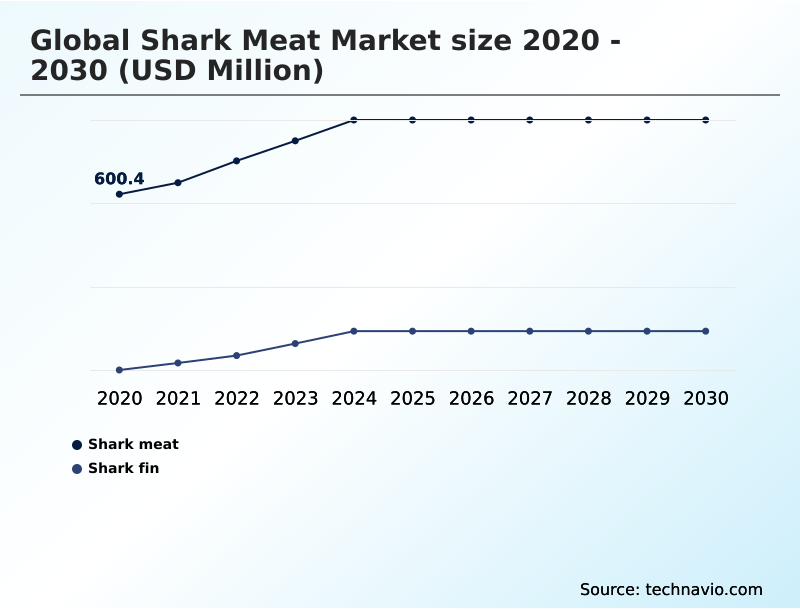
  • By Product - Shark meat segment was valued at USD 658.5 million in 2024
  • By End-user - Commercial segment accounted for the largest market revenue share in 2024

Market Size & Forecast

  • Market Opportunities: USD 264.2 million
  • Market Future Opportunities: USD 148.6 million
  • CAGR from 2025 to 2030 : 2.4%

Market Summary

  • The shark meat market is undergoing a significant transformation, evolving from a secondary byproduct of the fin trade to a primary commodity driven by demand for affordable protein. This shift is complicated by a landscape of increasing regulatory pressure and heightened consumer awareness.
  • The industry is grappling with the need for sustainable shark harvesting, as international bodies enforce stricter CITES Appendix II listings and fins-naturally-attached policies to protect marine ecosystems. For instance, a commercial fishing operation must now navigate a complex web of non-detriment findings and digital catch certificates to access lucrative international markets.
  • Concurrently, persistent issues such as methylmercury bioaccumulation and widespread seafood mislabeling are forcing a move toward greater transparency through technologies like DNA-based species identification. As a result, the market's future hinges on the ability of industrial seafood processors and artisanal fishing communities alike to balance economic imperatives with the stringent demands of conservation and food safety.

What will be the Size of the Shark Meat Market during the forecast period?

Get Key Insights on Market Forecast (PDF) Request Free Sample

How is the Shark Meat Market Segmented?

The shark meat industry research report provides comprehensive data (region-wise segment analysis), with forecasts and estimates in "USD million" for the period 2026-2030, as well as historical data from 2020-2024 for the following segments.

  • Product
    • Shark meat
    • Shark fin
  • End-user
    • Commercial
    • Residential
  • Type
    • Frozen meat
    • Fresh meat
    • Canned meat
    • Dried meat
    • Smoked meat
  • Geography
    • APAC
      • Indonesia
      • Japan
      • India
    • Europe
      • Spain
      • Italy
      • France
    • North America
      • US
      • Mexico
      • Canada
    • South America
      • Brazil
    • Middle East and Africa
      • South Africa
      • UAE
      • Saudi Arabia
    • Rest of World (ROW)

By Product Insights

The shark meat segment is estimated to witness significant growth during the forecast period.

The global shark meat market is segmented by product, where elasmobranch muscle tissue, or shark meat, accounts for over 57% of the volume compared to fins, and by end-user, covering both commercial and residential channels.

The commercial segment, comprising industrial seafood processors and the food service industry, drives volume through demand for processed seafood products and frozen shark cuts. The residential segment is influenced by artisanal fishing communities and regional culinary traditions.

Across the entire seafood value chain, a focus on sustainable fishery programs and species-specific labeling is reshaping procurement.

Adherence to new food safety labeling mandates and the use of bycatch reduction technology are becoming critical for accessing high-value markets and ensuring long-term viability in this evolving landscape.

Request Free Sample

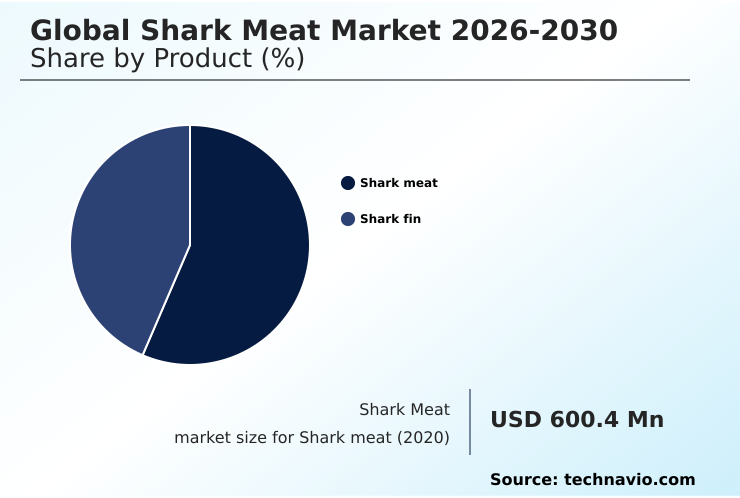
The Shark meat segment was valued at USD 658.5 million in 2024 and showed a gradual increase during the forecast period.

Request Free Sample

Regional Analysis

APAC is estimated to contribute 52.8% to the growth of the global market during the forecast period.Technavio’s analysts have elaborately explained the regional trends and drivers that shape the market during the forecast period.

See How Shark Meat Market Demand is Rising in APAC Request Free Sample

The geographic landscape of the global shark meat market is diverse, with distinct regional dynamics. APAC is the largest region, driven by traditional consumption and large-scale commercial fishing fleets; its market is projected to expand over 35% faster than Europe's.

This growth is supported by rising domestic demand in countries like Indonesia and India for shark meat as a protein source.

In contrast, Europe and North America function as major consumption and regulatory centers, emphasizing sustainable catch limits and strict import controls governed by global trade regulations.

These regions are at the forefront of implementing digital traceability systems and enforcing marine biodiversity protections.

South America is a key supplier, with countries like Brazil and Peru central to both regional consumption and the international trade of frozen cuts, navigating the balance between economic activity and elasmobranch conservation.

Market Dynamics

Our researchers analyzed the data with 2025 as the base year, along with the key drivers, trends, and challenges. A holistic analysis of drivers will help companies refine their marketing strategies to gain a competitive advantage.

  • Navigating the complexities of the market requires a strategic approach to both operations and compliance. The impact of CITES on shark meat trade necessitates robust systems for verifying non-detriment findings for exports, a significant hurdle for many suppliers.
  • For a company to succeed, it must address the challenges of shark meat cold-chain logistics while implementing strategies for marketing certified shark products. Adherence to the compliance with fins-naturally-attached policies is no longer optional but a baseline for market entry.
  • A critical focus is on mitigating consumer health risks of shark consumption by investing in technology for reducing mercury in processed shark meat and ensuring clear labeling. Implementing blockchain for seafood supply chain traceability has become a key differentiator, capable of reducing mislabeling incidents—which affect nearly half of products in some markets—by over 90%.
  • This technology facilitates traceability from catch to commercial sale. Furthermore, the role of DNA testing in preventing mislabeling is crucial for rebuilding consumer trust after the impact of mislabeling on consumer trust.
  • Businesses must also consider the growing demand for plant-based alternatives to shark meat and explore the economic viability of sustainable shark fishing, which includes managing bycatch in commercial shark fisheries.
  • Ultimately, balancing food security and shark conservation while monitoring heavy metals in shark populations will define the leaders in this sector, especially considering the economic drivers for artisanal shark fishing and the impact of institutional bans on the market.

What are the key market drivers leading to the rise in the adoption of Shark Meat Industry?

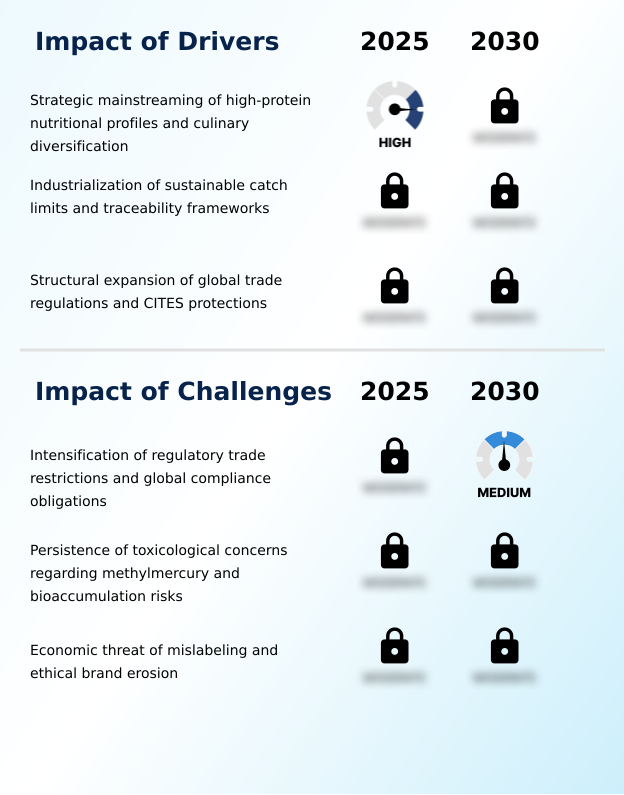
  • The strategic mainstreaming of high-protein nutritional profiles and an emphasis on culinary diversification are key drivers for market expansion.

  • Market growth is increasingly driven by a dual focus on sustainability mandates and the rising demand for high-protein food sources.
  • Regulatory frameworks are a primary driver, with new global trade regulations like the CITES protections for over 70 shark species compelling the industry to adopt sustainable sourcing certifications.
  • The implementation of total allowable catches (TACs) in well-managed fisheries has successfully rebuilt certain stocks by over 20%, demonstrating that regulatory oversight can foster market legitimacy.
  • This push for sustainability is complemented by the mainstreaming of shark meat as a valuable protein source, supporting food security initiatives and culinary diversification.
  • The shift away from shark meat as a mere byproduct to a targeted commodity requires industrial seafood processors to invest in advanced processing and traceability to meet consumer and regulatory demands.

What are the market trends shaping the Shark Meat Industry?

  • The increasing adoption of digital traceability and genetic market monitoring is a significant emerging trend. This move toward technological verification is reshaping supply chain transparency and product integrity.

  • Key market trends are centered on ethical sourcing and technological verification, driven by intense public and regulatory scrutiny. The proliferation of ethical procurement bans is a powerful market force, exemplified by a directive in one South American state that removed shark meat from 95% of public school cafeterias due to health and environmental risks.
  • This trend toward institutional divestment pressures commercial suppliers to prioritize sustainable shark harvesting. Simultaneously, the industry is adopting advanced technology to combat persistent seafood mislabeling. Studies using genetic market monitoring have revealed that in certain markets, nearly 48% of samples were mislabeled, often masking endangered species.
  • In response, companies are implementing supply chain transparency tools like portable genetic testing kits and blockchain-enabled supply chain logs to ensure product integrity and meet international conservation standards.

What challenges does the Shark Meat Industry face during its growth?

  • The intensification of regulatory trade restrictions and the complexities of maintaining global compliance obligations present a primary challenge to industry growth.

  • The market faces significant challenges from intensifying regulatory trade restrictions and persistent toxicological concerns. The implementation of new frameworks, such as the 13 specialized customs codes introduced by the European Union for tracking shark products, creates substantial compliance burdens for exporters and can disrupt the seafood value chain.
  • These administrative hurdles are compounded by the ongoing risk of the black market seafood trade, which undermines legal operators. Furthermore, health risks associated with heavy metal concentration remain a primary restraint. Seafood safety assessments consistently find that a portion of products, approximately 6.5% in some European studies, exceed the legal limits for mercury.
  • These toxicological concerns fuel negative consumer perceptions and can lead to unpredictable demand, challenging producers to ensure safety without incurring prohibitive testing costs.

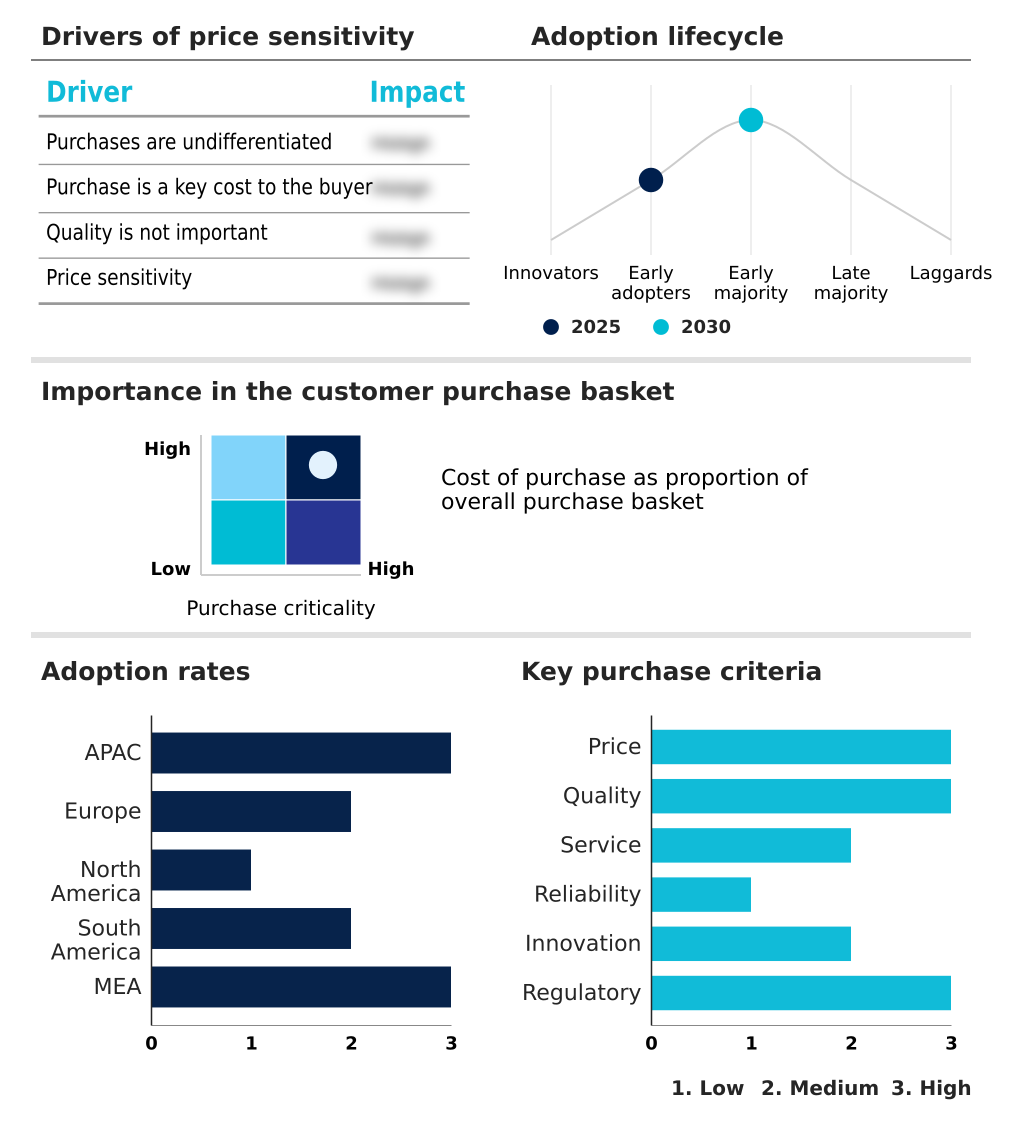
Exclusive Technavio Analysis on Customer Landscape

The shark meat market forecasting report includes the adoption lifecycle of the market, covering from the innovator’s stage to the laggard’s stage. It focuses on adoption rates in different regions based on penetration. Furthermore, the shark meat market report also includes key purchase criteria and drivers of price sensitivity to help companies evaluate and develop their market growth analysis strategies.

Customer Landscape of Shark Meat Industry

Competitive Landscape

Companies are implementing various strategies, such as strategic alliances, shark meat market forecast, partnerships, mergers and acquisitions, geographical expansion, and product/service launches, to enhance their presence in the industry.

Altamar Foods - Analysis indicates a focus on providing natural and precooked frozen seafood, including value-added shark portions and cuts for international distribution.

The industry research and growth report includes detailed analyses of the competitive landscape of the market and information about key companies, including:

  • Altamar Foods
  • Bjarnarhofn Shark Museum
  • Ishiwata Shoten Co. Ltd.
  • KITA
  • Marfrio S.A.
  • Talleys
  • Wenzhou Haideli Shark Products

Qualitative and quantitative analysis of companies has been conducted to help clients understand the wider business environment as well as the strengths and weaknesses of key industry players. Data is qualitatively analyzed to categorize companies as pure play, category-focused, industry-focused, and diversified; it is quantitatively analyzed to categorize companies as dominant, leading, strong, tentative, and weak.

Recent Development and News in Shark meat market

  • In March 2025, Global Seafood Inc. announced a strategic partnership with a tech firm to implement blockchain traceability across its shark meat supply chain, aiming for full compliance with upcoming CITES regulations.
  • In January 2025, leading retailer Ocean's Best Grocers announced it would require third-party methylmercury testing for all shark meat products, setting a new industry standard for consumer safety.
  • In November 2024, Sustainable Catch Fisheries secured a significant investment to expand its fleet of vessels equipped with bycatch reduction technology, targeting the premium sustainable shark meat market.
  • In September 2024, Plant-Based Seafood Co. launched a new shark meat alternative, 'Fin-Free Steaks,' directly targeting consumers concerned with marine conservation and heavy metal exposure.

Dive into Technavio’s robust research methodology, blending expert interviews, extensive data synthesis, and validated models for unparalleled Shark Meat Market insights. See full methodology.

Market Scope
Page number 277
Base year 2025
Historic period 2020-2024
Forecast period 2026-2030
Growth momentum & CAGR Accelerate at a CAGR of 2.4%
Market growth 2026-2030 USD 148.6 million
Market structure Concentrated
YoY growth 2025-2026(%) 2.4%
Key countries Indonesia, Japan, India, South Korea, China, Australia, Spain, Portugal, Italy, France, UK, Germany, US, Mexico, Canada, Brazil, Peru, Chile, South Africa, Nigeria, UAE, Saudi Arabia and Egypt
Competitive landscape Leading Companies, Market Positioning of Companies, Competitive Strategies, and Industry Risks

Request Free Sample

Research Analyst Overview

  • The global shark meat market is defined by the complex logistics of transforming elasmobranch muscle tissue into commercial goods, demanding advanced cold-chain processing and adherence to a difficult regulatory environment. Boardroom decisions are now heavily influenced by the need to navigate CITES Appendix II listings, which require verifiable non-detriment findings and digital catch certificates for elasmobranch landings.
  • The enforcement of fins-naturally-attached policies and total allowable catches has forced industrial seafood processors and commercial fishing operations to invest in bycatch reduction technology and marine resource management. A key operational challenge is mitigating methylmercury bioaccumulation, addressed through species-specific labeling and stringent food safety labeling mandates.
  • For instance, public health concerns led to the removal of shark meat from 95% of state-run schools in one major South American region, highlighting the commercial risk of toxicological issues.
  • Forward-thinking companies are leveraging genomic traceability, including portable genetic testing kits and DNA-based species identification, to combat seafood mislabeling and guarantee the origin of products like frozen shark cuts and blue shark steaks.
  • This shift toward a blockchain-enabled supply chain is critical for satisfying sustainable fishery programs, managing fisheries management plans, and avoiding the consequences of zero-export quotas, while also serving artisanal fishing communities and addressing the market for high-protein plant-based substitutes.

What are the Key Data Covered in this Shark Meat Market Research and Growth Report?

  • What is the expected growth of the Shark Meat Market between 2026 and 2030?

    • USD 148.6 million, at a CAGR of 2.4%

  • What segmentation does the market report cover?

    • The report is segmented by Product (Shark meat, and Shark fin), End-user (Commercial, and Residential), Type (Frozen meat, Fresh meat, Canned meat, Dried meat, and Smoked meat) and Geography (APAC, Europe, North America, South America, Middle East and Africa)

  • Which regions are analyzed in the report?

    • APAC, Europe, North America, South America and Middle East and Africa

  • What are the key growth drivers and market challenges?

    • Strategic mainstreaming of high-protein nutritional profiles and culinary diversification, Intensification of regulatory trade restrictions and global compliance obligations

  • Who are the major players in the Shark Meat Market?

    • Altamar Foods, Bjarnarhofn Shark Museum, Ishiwata Shoten Co. Ltd., KITA, Marfrio S.A., Talleys and Wenzhou Haideli Shark Products

Market Research Insights

  • Market dynamics are increasingly shaped by consumer awareness campaigns and a push for ethical seafood sourcing. The prevalence of mislabeling remains a critical issue, with studies showing that in some regions, nearly 48% of seafood samples sold under common names were identified as threatened shark species through DNA barcoding.
  • This lack of supply chain transparency undermines institutional procurement policies aimed at sustainability. Furthermore, toxicological concerns persist, as seafood safety assessments have found that approximately 6.5% of shark meat samples in certain markets exceed regulatory limits for mercury toxicity.
  • This has fueled the expansion of plant-based seafood alternatives and eco-labeled products, pressuring traditional suppliers to adopt more rigorous verification and sustainable sourcing certifications to maintain consumer trust and market access.

We can help! Our analysts can customize this shark meat market research report to meet your requirements.

Get in touch

1. Executive Summary

1.1 Market overview

Executive Summary - Chart on Market Overview
Executive Summary - Data Table on Market Overview
Executive Summary - Chart on Global Market Characteristics
Executive Summary - Chart on Market by Geography
Executive Summary - Chart on Market Segmentation by Product
Executive Summary - Chart on Market Segmentation by End-user
Executive Summary - Chart on Market Segmentation by Type
Executive Summary - Chart on Incremental Growth
Executive Summary - Data Table on Incremental Growth
Executive Summary - Chart on Company Market Positioning

2. Technavio Analysis

2.1 Analysis of price sensitivity, lifecycle, customer purchase basket, adoption rates, and purchase criteria

2.2 Criticality of inputs and Factors of differentiation

Chart on Overview on criticality of inputs and factors of differentiation

2.3 Factors of disruption

Chart on Overview on factors of disruption

2.4 Impact of drivers and challenges

Chart on Impact of drivers and challenges in 2025 and 2030

3. Market Landscape

3.1 Market ecosystem

Chart on Parent Market
Data Table on - Parent Market

3.2 Market characteristics

Chart on Market characteristics analysis

3.3 Value chain analysis

Chart on Value chain analysis

4. Market Sizing

4.1 Market definition

Data Table on Offerings of companies included in the market definition

4.2 Market segment analysis

Market segments

4.3 Market size 2025

4.4 Market outlook: Forecast for 2025-2030

Chart on Global - Market size and forecast 2025-2030 ($ million)
Data Table on Global - Market size and forecast 2025-2030 ($ million)
Chart on Global Market: Year-over-year growth 2025-2030 (%)
Data Table on Global Market: Year-over-year growth 2025-2030 (%)

5. Historic Market Size

5.1 Global Shark Meat Market 2020 - 2024

Historic Market Size - Data Table on Global Shark Meat Market 2020 - 2024 ($ million)

5.2 Product segment analysis 2020 - 2024

Historic Market Size - Product Segment 2020 - 2024 ($ million)

5.3 End-user segment analysis 2020 - 2024

Historic Market Size - End-user Segment 2020 - 2024 ($ million)

5.4 Type segment analysis 2020 - 2024

Historic Market Size - Type Segment 2020 - 2024 ($ million)

5.5 Geography segment analysis 2020 - 2024

Historic Market Size - Geography Segment 2020 - 2024 ($ million)

5.6 Country segment analysis 2020 - 2024

Historic Market Size - Country Segment 2020 - 2024 ($ million)

6. Qualitative Analysis

6.1 Impact of AI in global shark meat market

6.2 Impact of geopolitical conflict for global shark meat market

7. Five Forces Analysis

7.1 Five forces summary

Five forces analysis - Comparison between 2025 and 2030

7.2 Bargaining power of buyers

Bargaining power of buyers - Impact of key factors 2025 and 2030

7.3 Bargaining power of suppliers

Bargaining power of suppliers - Impact of key factors in 2025 and 2030

7.4 Threat of new entrants

Threat of new entrants - Impact of key factors in 2025 and 2030

7.5 Threat of substitutes

Threat of substitutes - Impact of key factors in 2025 and 2030

7.6 Threat of rivalry

Threat of rivalry - Impact of key factors in 2025 and 2030

7.7 Market condition

Chart on Market condition - Five forces 2025 and 2030

8. Market Segmentation by Product

8.1 Market segments

Chart on Product - Market share 2025-2030 (%)
Data Table on Product - Market share 2025-2030 (%)

8.2 Comparison by Product

Chart on Comparison by Product
Data Table on Comparison by Product

8.3 Shark meat - Market size and forecast 2025-2030

Chart on Shark meat - Market size and forecast 2025-2030 ($ million)
Data Table on Shark meat - Market size and forecast 2025-2030 ($ million)
Chart on Shark meat - Year-over-year growth 2025-2030 (%)
Data Table on Shark meat - Year-over-year growth 2025-2030 (%)

8.4 Shark fin - Market size and forecast 2025-2030

Chart on Shark fin - Market size and forecast 2025-2030 ($ million)
Data Table on Shark fin - Market size and forecast 2025-2030 ($ million)
Chart on Shark fin - Year-over-year growth 2025-2030 (%)
Data Table on Shark fin - Year-over-year growth 2025-2030 (%)

8.5 Market opportunity by Product

Market opportunity by Product ($ million)
Data Table on Market opportunity by Product ($ million)

9. Market Segmentation by End-user

9.1 Market segments

Chart on End-user - Market share 2025-2030 (%)
Data Table on End-user - Market share 2025-2030 (%)

9.2 Comparison by End-user

Chart on Comparison by End-user
Data Table on Comparison by End-user

9.3 Commercial - Market size and forecast 2025-2030

Chart on Commercial - Market size and forecast 2025-2030 ($ million)
Data Table on Commercial - Market size and forecast 2025-2030 ($ million)
Chart on Commercial - Year-over-year growth 2025-2030 (%)
Data Table on Commercial - Year-over-year growth 2025-2030 (%)

9.4 Residential - Market size and forecast 2025-2030

Chart on Residential - Market size and forecast 2025-2030 ($ million)
Data Table on Residential - Market size and forecast 2025-2030 ($ million)
Chart on Residential - Year-over-year growth 2025-2030 (%)
Data Table on Residential - Year-over-year growth 2025-2030 (%)

9.5 Market opportunity by End-user

Market opportunity by End-user ($ million)
Data Table on Market opportunity by End-user ($ million)

10. Market Segmentation by Type

10.1 Market segments

Chart on Type - Market share 2025-2030 (%)
Data Table on Type - Market share 2025-2030 (%)

10.2 Comparison by Type

Chart on Comparison by Type
Data Table on Comparison by Type

10.3 Frozen meat - Market size and forecast 2025-2030

Chart on Frozen meat - Market size and forecast 2025-2030 ($ million)
Data Table on Frozen meat - Market size and forecast 2025-2030 ($ million)
Chart on Frozen meat - Year-over-year growth 2025-2030 (%)
Data Table on Frozen meat - Year-over-year growth 2025-2030 (%)

10.4 Fresh meat - Market size and forecast 2025-2030

Chart on Fresh meat - Market size and forecast 2025-2030 ($ million)
Data Table on Fresh meat - Market size and forecast 2025-2030 ($ million)
Chart on Fresh meat - Year-over-year growth 2025-2030 (%)
Data Table on Fresh meat - Year-over-year growth 2025-2030 (%)

10.5 Canned meat - Market size and forecast 2025-2030

Chart on Canned meat - Market size and forecast 2025-2030 ($ million)
Data Table on Canned meat - Market size and forecast 2025-2030 ($ million)
Chart on Canned meat - Year-over-year growth 2025-2030 (%)
Data Table on Canned meat - Year-over-year growth 2025-2030 (%)

10.6 Dried meat - Market size and forecast 2025-2030

Chart on Dried meat - Market size and forecast 2025-2030 ($ million)
Data Table on Dried meat - Market size and forecast 2025-2030 ($ million)
Chart on Dried meat - Year-over-year growth 2025-2030 (%)
Data Table on Dried meat - Year-over-year growth 2025-2030 (%)

10.7 Smoked meat - Market size and forecast 2025-2030

Chart on Smoked meat - Market size and forecast 2025-2030 ($ million)
Data Table on Smoked meat - Market size and forecast 2025-2030 ($ million)
Chart on Smoked meat - Year-over-year growth 2025-2030 (%)
Data Table on Smoked meat - Year-over-year growth 2025-2030 (%)

10.8 Market opportunity by Type

Market opportunity by Type ($ million)
Data Table on Market opportunity by Type ($ million)

11. Customer Landscape

11.1 Customer landscape overview

Analysis of price sensitivity, lifecycle, customer purchase basket, adoption rates, and purchase criteria

12. Geographic Landscape

12.1 Geographic segmentation

Chart on Market share by geography 2025-2030 (%)
Data Table on Market share by geography 2025-2030 (%)

12.2 Geographic comparison

Chart on Geographic comparison
Data Table on Geographic comparison

12.3 APAC - Market size and forecast 2025-2030

Chart on APAC - Market size and forecast 2025-2030 ($ million)
Data Table on APAC - Market size and forecast 2025-2030 ($ million)
Chart on APAC - Year-over-year growth 2025-2030 (%)
Data Table on APAC - Year-over-year growth 2025-2030 (%)
Chart on Regional Comparison - APAC
Data Table on Regional Comparison - APAC

12.3.1 Indonesia - Market size and forecast 2025-2030

Chart on Indonesia - Market size and forecast 2025-2030 ($ million)
Data Table on Indonesia - Market size and forecast 2025-2030 ($ million)
Chart on Indonesia - Year-over-year growth 2025-2030 (%)
Data Table on Indonesia - Year-over-year growth 2025-2030 (%)

12.3.2 Japan - Market size and forecast 2025-2030

Chart on Japan - Market size and forecast 2025-2030 ($ million)
Data Table on Japan - Market size and forecast 2025-2030 ($ million)
Chart on Japan - Year-over-year growth 2025-2030 (%)
Data Table on Japan - Year-over-year growth 2025-2030 (%)

12.3.3 India - Market size and forecast 2025-2030

Chart on India - Market size and forecast 2025-2030 ($ million)
Data Table on India - Market size and forecast 2025-2030 ($ million)
Chart on India - Year-over-year growth 2025-2030 (%)
Data Table on India - Year-over-year growth 2025-2030 (%)

12.3.4 South Korea - Market size and forecast 2025-2030

Chart on South Korea - Market size and forecast 2025-2030 ($ million)
Data Table on South Korea - Market size and forecast 2025-2030 ($ million)
Chart on South Korea - Year-over-year growth 2025-2030 (%)
Data Table on South Korea - Year-over-year growth 2025-2030 (%)

12.3.5 China - Market size and forecast 2025-2030

Chart on China - Market size and forecast 2025-2030 ($ million)
Data Table on China - Market size and forecast 2025-2030 ($ million)
Chart on China - Year-over-year growth 2025-2030 (%)
Data Table on China - Year-over-year growth 2025-2030 (%)

12.3.6 Australia - Market size and forecast 2025-2030

Chart on Australia - Market size and forecast 2025-2030 ($ million)
Data Table on Australia - Market size and forecast 2025-2030 ($ million)
Chart on Australia - Year-over-year growth 2025-2030 (%)
Data Table on Australia - Year-over-year growth 2025-2030 (%)

12.4 Europe - Market size and forecast 2025-2030

Chart on Europe - Market size and forecast 2025-2030 ($ million)
Data Table on Europe - Market size and forecast 2025-2030 ($ million)
Chart on Europe - Year-over-year growth 2025-2030 (%)
Data Table on Europe - Year-over-year growth 2025-2030 (%)
Chart on Regional Comparison - Europe
Data Table on Regional Comparison - Europe

12.4.1 Spain - Market size and forecast 2025-2030

Chart on Spain - Market size and forecast 2025-2030 ($ million)
Data Table on Spain - Market size and forecast 2025-2030 ($ million)
Chart on Spain - Year-over-year growth 2025-2030 (%)
Data Table on Spain - Year-over-year growth 2025-2030 (%)

12.4.2 Portugal - Market size and forecast 2025-2030

Chart on Portugal - Market size and forecast 2025-2030 ($ million)
Data Table on Portugal - Market size and forecast 2025-2030 ($ million)
Chart on Portugal - Year-over-year growth 2025-2030 (%)
Data Table on Portugal - Year-over-year growth 2025-2030 (%)

12.4.3 Italy - Market size and forecast 2025-2030

Chart on Italy - Market size and forecast 2025-2030 ($ million)
Data Table on Italy - Market size and forecast 2025-2030 ($ million)
Chart on Italy - Year-over-year growth 2025-2030 (%)
Data Table on Italy - Year-over-year growth 2025-2030 (%)

12.4.4 France - Market size and forecast 2025-2030

Chart on France - Market size and forecast 2025-2030 ($ million)
Data Table on France - Market size and forecast 2025-2030 ($ million)
Chart on France - Year-over-year growth 2025-2030 (%)
Data Table on France - Year-over-year growth 2025-2030 (%)

12.4.5 UK - Market size and forecast 2025-2030

Chart on UK - Market size and forecast 2025-2030 ($ million)
Data Table on UK - Market size and forecast 2025-2030 ($ million)
Chart on UK - Year-over-year growth 2025-2030 (%)
Data Table on UK - Year-over-year growth 2025-2030 (%)

12.4.6 Germany - Market size and forecast 2025-2030

Chart on Germany - Market size and forecast 2025-2030 ($ million)
Data Table on Germany - Market size and forecast 2025-2030 ($ million)
Chart on Germany - Year-over-year growth 2025-2030 (%)
Data Table on Germany - Year-over-year growth 2025-2030 (%)

12.5 North America - Market size and forecast 2025-2030

Chart on North America - Market size and forecast 2025-2030 ($ million)
Data Table on North America - Market size and forecast 2025-2030 ($ million)
Chart on North America - Year-over-year growth 2025-2030 (%)
Data Table on North America - Year-over-year growth 2025-2030 (%)
Chart on Regional Comparison - North America
Data Table on Regional Comparison - North America

12.5.1 US - Market size and forecast 2025-2030

Chart on US - Market size and forecast 2025-2030 ($ million)
Data Table on US - Market size and forecast 2025-2030 ($ million)
Chart on US - Year-over-year growth 2025-2030 (%)
Data Table on US - Year-over-year growth 2025-2030 (%)

12.5.2 Mexico - Market size and forecast 2025-2030

Chart on Mexico - Market size and forecast 2025-2030 ($ million)
Data Table on Mexico - Market size and forecast 2025-2030 ($ million)
Chart on Mexico - Year-over-year growth 2025-2030 (%)
Data Table on Mexico - Year-over-year growth 2025-2030 (%)

12.5.3 Canada - Market size and forecast 2025-2030

Chart on Canada - Market size and forecast 2025-2030 ($ million)
Data Table on Canada - Market size and forecast 2025-2030 ($ million)
Chart on Canada - Year-over-year growth 2025-2030 (%)
Data Table on Canada - Year-over-year growth 2025-2030 (%)

12.6 South America - Market size and forecast 2025-2030

Chart on South America - Market size and forecast 2025-2030 ($ million)
Data Table on South America - Market size and forecast 2025-2030 ($ million)
Chart on South America - Year-over-year growth 2025-2030 (%)
Data Table on South America - Year-over-year growth 2025-2030 (%)
Chart on Regional Comparison - South America
Data Table on Regional Comparison - South America

12.6.1 Brazil - Market size and forecast 2025-2030

Chart on Brazil - Market size and forecast 2025-2030 ($ million)
Data Table on Brazil - Market size and forecast 2025-2030 ($ million)
Chart on Brazil - Year-over-year growth 2025-2030 (%)
Data Table on Brazil - Year-over-year growth 2025-2030 (%)

12.6.2 Peru - Market size and forecast 2025-2030

Chart on Peru - Market size and forecast 2025-2030 ($ million)
Data Table on Peru - Market size and forecast 2025-2030 ($ million)
Chart on Peru - Year-over-year growth 2025-2030 (%)
Data Table on Peru - Year-over-year growth 2025-2030 (%)

12.6.3 Chile - Market size and forecast 2025-2030

Chart on Chile - Market size and forecast 2025-2030 ($ million)
Data Table on Chile - Market size and forecast 2025-2030 ($ million)
Chart on Chile - Year-over-year growth 2025-2030 (%)
Data Table on Chile - Year-over-year growth 2025-2030 (%)

12.7 Middle East and Africa - Market size and forecast 2025-2030

Chart on Middle East and Africa - Market size and forecast 2025-2030 ($ million)
Data Table on Middle East and Africa - Market size and forecast 2025-2030 ($ million)
Chart on Middle East and Africa - Year-over-year growth 2025-2030 (%)
Data Table on Middle East and Africa - Year-over-year growth 2025-2030 (%)
Chart on Regional Comparison - Middle East and Africa
Data Table on Regional Comparison - Middle East and Africa

12.7.1 South Africa - Market size and forecast 2025-2030

Chart on South Africa - Market size and forecast 2025-2030 ($ million)
Data Table on South Africa - Market size and forecast 2025-2030 ($ million)
Chart on South Africa - Year-over-year growth 2025-2030 (%)
Data Table on South Africa - Year-over-year growth 2025-2030 (%)

12.7.2 Nigeria - Market size and forecast 2025-2030

Chart on Nigeria - Market size and forecast 2025-2030 ($ million)
Data Table on Nigeria - Market size and forecast 2025-2030 ($ million)
Chart on Nigeria - Year-over-year growth 2025-2030 (%)
Data Table on Nigeria - Year-over-year growth 2025-2030 (%)

12.7.3 UAE - Market size and forecast 2025-2030

Chart on UAE - Market size and forecast 2025-2030 ($ million)
Data Table on UAE - Market size and forecast 2025-2030 ($ million)
Chart on UAE - Year-over-year growth 2025-2030 (%)
Data Table on UAE - Year-over-year growth 2025-2030 (%)

12.7.4 Saudi Arabia - Market size and forecast 2025-2030

Chart on Saudi Arabia - Market size and forecast 2025-2030 ($ million)
Data Table on Saudi Arabia - Market size and forecast 2025-2030 ($ million)
Chart on Saudi Arabia - Year-over-year growth 2025-2030 (%)
Data Table on Saudi Arabia - Year-over-year growth 2025-2030 (%)

12.7.5 Egypt - Market size and forecast 2025-2030

Chart on Egypt - Market size and forecast 2025-2030 ($ million)
Data Table on Egypt - Market size and forecast 2025-2030 ($ million)
Chart on Egypt - Year-over-year growth 2025-2030 (%)
Data Table on Egypt - Year-over-year growth 2025-2030 (%)

12.8 Market opportunity by geography

Market opportunity by geography ($ million)
Data Tables on Market opportunity by geography ($ million)

13. Drivers, Challenges, and Opportunity

13.1 Market drivers

Strategic mainstreaming of high-protein nutritional profiles and culinary diversification
Industrialization of sustainable catch limits and traceability frameworks
Structural expansion of global trade regulations and CITES protections

13.2 Market challenges

Intensification of regulatory trade restrictions and global compliance obligations
Persistence of toxicological concerns regarding methylmercury and bioaccumulation risks
Economic threat of mislabeling and ethical brand erosion

13.3 Impact of drivers and challenges

Impact of drivers and challenges in 2025 and 2030

13.4 Market opportunities

Growth of digital traceability and genetic market monitoring
Expansion of sustainable sourcing and alternative protein alternatives
Proliferation of ethical procurement bans and public institutional divestment

14. Competitive Landscape

14.1 Overview

14.2

Overview on criticality of inputs and factors of differentiation

14.3 Landscape disruption

Overview on factors of disruption

14.4 Industry risks

Impact of key risks on business

15. Competitive Analysis

15.1 Companies profiled

Companies covered

15.2 Company ranking index

15.3 Market positioning of companies

Matrix on companies position and classification

15.4 Altamar Foods

Altamar Foods - Overview
Altamar Foods - Product / Service
Altamar Foods - Key offerings
SWOT

15.5 Bjarnarhofn Shark Museum

Bjarnarhofn Shark Museum - Overview
Bjarnarhofn Shark Museum - Product / Service
Bjarnarhofn Shark Museum - Key offerings
SWOT

15.6 Ishiwata Shoten Co. Ltd.

Ishiwata Shoten Co. Ltd. - Overview
Ishiwata Shoten Co. Ltd. - Product / Service
Ishiwata Shoten Co. Ltd. - Key offerings
SWOT

15.7 KITA

KITA - Overview
KITA - Product / Service
KITA - Key offerings
SWOT

15.8 Marfrio S.A.

Marfrio S.A. - Overview
Marfrio S.A. - Product / Service
Marfrio S.A. - Key offerings
SWOT

15.9 Talleys

Talleys - Overview
Talleys - Product / Service
Talleys - Key offerings
SWOT

15.10 Wenzhou Haideli Shark Products

Wenzhou Haideli Shark Products - Overview
Wenzhou Haideli Shark Products - Product / Service
Wenzhou Haideli Shark Products - Key offerings
SWOT

16. Appendix

16.1 Scope of the report

Market definition
Objectives
Notes and caveats

16.2 Inclusions and exclusions checklist

Inclusions checklist
Exclusions checklist

16.3 Currency conversion rates for US$

16.4 Research methodology

16.5 Data procurement

Information sources

16.6 Data validation

16.7 Validation techniques employed for market sizing

16.8 Data synthesis

16.9 360 degree market analysis

16.10 List of abbreviations

Research Methodology

Technavio presents a detailed picture of the market by way of study, synthesis, and summation of data from multiple sources. The analysts have presented the various facets of the market with a particular focus on identifying the key industry influencers. The data thus presented is comprehensive, reliable, and the result of extensive research, both primary and secondary.

INFORMATION SOURCES

Primary sources

  • Manufacturers and suppliers
  • Channel partners
  • Industry experts
  • Strategic decision makers

Secondary sources

  • Industry journals and periodicals
  • Government data
  • Financial reports of key industry players
  • Historical data
  • Press releases

DATA ANALYSIS

Data Synthesis

  • Collation of data
  • Estimation of key figures
  • Analysis of derived insights

Data Validation

  • Triangulation with data models
  • Reference against proprietary databases
  • Corroboration with industry experts

REPORT WRITING

Qualitative

  • Market drivers
  • Market challenges
  • Market trends
  • Five forces analysis

Quantitative

  • Market size and forecast
  • Market segmentation
  • Geographical insights
  • Competitive landscape

Interested in this report?

Get your sample now to see our research methodology and insights!

Download Now

Frequently Asked Questions

Shark Meat market growth will increase by USD 148.6 million during 2026-2030.

The Shark Meat market is expected to grow at a CAGR of 2.4% during 2026-2030.

Shark Meat market is segmented by Product (Shark meat, Shark fin) End-user (Commercial, Residential) Type (Frozen meat, Fresh meat, Canned meat, Dried meat, Smoked meat)

Altamar Foods, Bjarnarhofn Shark Museum, Ishiwata Shoten Co. Ltd., KITA, Marfrio S.A., Talleys, Wenzhou Haideli Shark Products are a few of the key vendors in the Shark Meat market.

APAC will register the highest growth rate of 52.8% among the other regions. Therefore, the Shark Meat market in APAC is expected to garner significant business opportunities for the vendors during the forecast period.

Indonesia, Japan, India, South Korea, China, Australia, Spain, Portugal, Italy, France, UK, Germany, US, Mexico, Canada, Brazil, Peru, Chile, South Africa, Nigeria, UAE, Saudi Arabia, Egypt

  • Strategic mainstreaming of high-protein nutritional profiles and culinary diversification is the driving factor this market.

The Shark Meat market vendors should focus on grabbing business opportunities from the Product segment as it accounted for the largest market share in the base year.
RIA - Research AI Assistant
Ask RIA