Service Integration And Management Market Analysis, Size, and Forecast 2026-2030: North America (US, Canada, and Mexico), Europe (Germany, UK, and France), APAC (China, Japan, and India), South America (Brazil and Argentina), Middle East and Africa (Saudi Arabia, UAE, and South Africa), and Rest of World (ROW)

Service Integration And Management Market Analysis, Size, and Forecast 2026-2030:
North America (US, Canada, and Mexico), Europe (Germany, UK, and France), APAC (China, Japan, and India), South America (Brazil and Argentina), Middle East and Africa (Saudi Arabia, UAE, and South Africa), and Rest of World (ROW)

Published: Jan 2026 300 Pages SKU: IRTNTR74038

Market Overview at a Glance

$1.35 B
Market Opportunity
5.2%
CAGR 2025 - 2030
38.4%
North America Growth
$1.41 B
IT and telecom segment 2024

Service Integration And Management Market Size 2026-2030

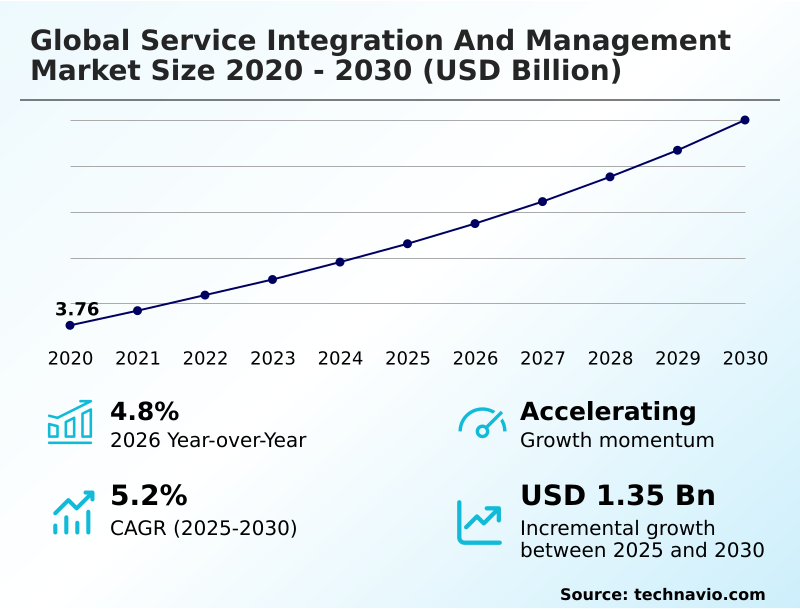
The service integration and management market size is valued to increase by USD 1.35 billion, at a CAGR of 5.2% from 2025 to 2030. Growth in implementation of software as a service (SaaS) will drive the service integration and management market.

Major Market Trends & Insights

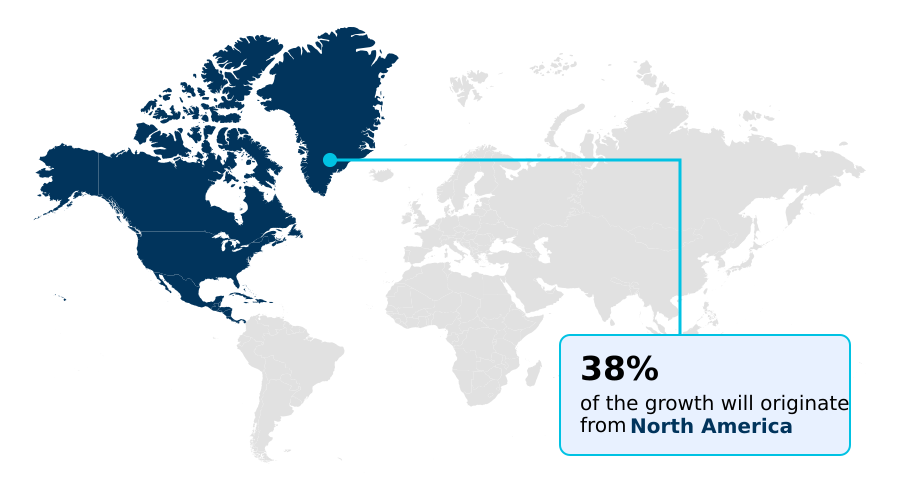
  • North America dominated the market and accounted for a 38.4% growth during the forecast period.
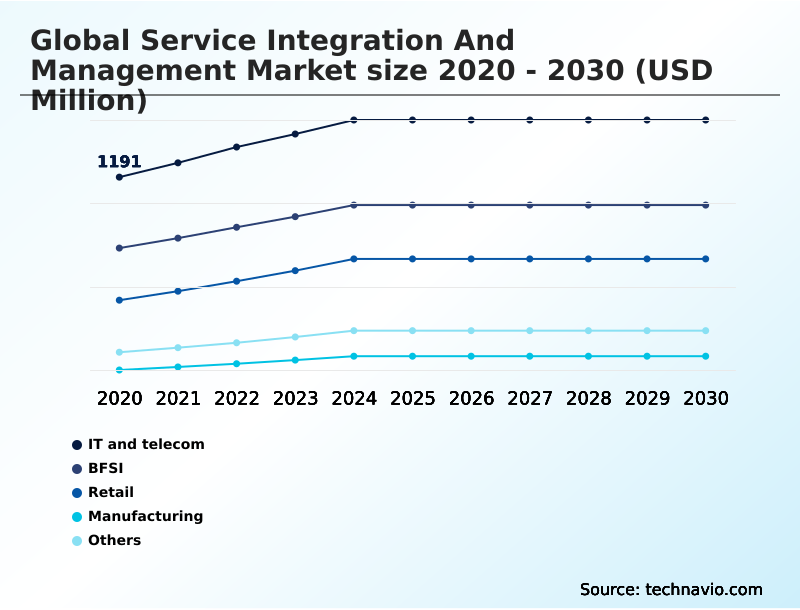
  • By Application - IT and telecom segment was valued at USD 1.41 billion in 2024
  • By Component - Services segment accounted for the largest market revenue share in 2024

Market Size & Forecast

  • Market Opportunities: USD 2.24 billion
  • Market Future Opportunities: USD 1.35 billion
  • CAGR from 2025 to 2030 : 5.2%

Market Summary

  • The service integration and management market is defined by the enterprise need to impose order on complex, multi-vendor IT environments. As organizations increasingly source specialized capabilities from different providers, a structured framework becomes essential for maintaining operational coherence and achieving business objectives.
  • Key drivers include the proliferation of hybrid cloud architectures and the adoption of best-of-breed SaaS applications, which fragment the IT landscape. A primary trend involves leveraging AI-driven platforms for predictive service management, enabling proactive issue resolution.
  • For instance, a financial services firm managing multiple fintech partners utilizes a service integration model to enforce uniform security protocols and ensure seamless data flow, which is critical for meeting stringent regulatory compliance standards. This approach provides a unified view of performance, ensuring all suppliers, from cloud hosting to payment processing, contribute to a consistent end-user experience.
  • However, the inherent complexity of aligning diverse service level agreements and managing data security across numerous third parties remains a significant challenge, requiring robust governance and cross-functional collaboration.

What will be the Size of the Service Integration And Management Market during the forecast period?

Get Key Insights on Market Forecast (PDF) Request Free Sample

How is the Service Integration And Management Market Segmented?

The service integration and management industry research report provides comprehensive data (region-wise segment analysis), with forecasts and estimates in "USD million" for the period 2026-2030, as well as historical data from 2020-2024 for the following segments.

  • Application
    • IT and telecom
    • BFSI
    • Retail
    • Manufacturing
    • Others
  • Component
    • Services
    • Solutions
  • Service type
    • Single‑provider model
    • Hybrid‑provider model
    • Internal service integrator model
  • Geography
    • North America
      • US
      • Canada
      • Mexico
    • Europe
      • Germany
      • UK
      • France
    • APAC
      • China
      • Japan
      • India
    • South America
      • Brazil
      • Argentina
    • Middle East and Africa
      • Saudi Arabia
      • UAE
      • South Africa
    • Rest of World (ROW)

By Application Insights

The it and telecom segment is estimated to witness significant growth during the forecast period.

The information technology and telecommunications sector represents a substantial part of the market, driven by the complexity of modern network infrastructures and the shift to multi-cloud environments.

Telecom operators transitioning to 5G and open radio access networks must manage a disaggregated IT supply chain, making a cohesive service delivery model essential.

This requires a robust service integrator layer for multi-sourcing service integration to maintain service level agreement management and ensure interoperability. The demand management process for new services and asset management across vendors must be centralized.

An effective IT operating model with strong multi-sourcing governance is critical, as it enhances IT supply chain efficiency and supports service transition management.

This structured approach, rooted in ITIL process alignment, improves service continuity planning and has been shown to boost service delivery consistency by over 20%.

Request Free Sample

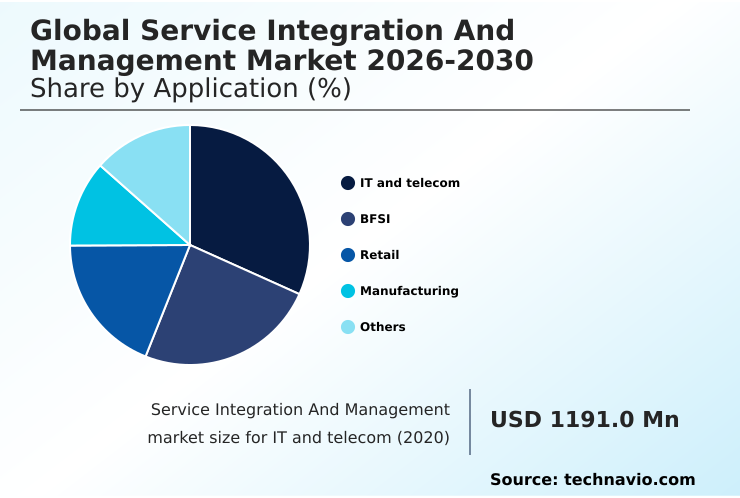
The IT and telecom segment was valued at USD 1.41 billion in 2024 and showed a gradual increase during the forecast period.

Request Free Sample

Regional Analysis

North America is estimated to contribute 38.4% to the growth of the global market during the forecast period.Technavio’s analysts have elaborately explained the regional trends and drivers that shape the market during the forecast period.

See How Service Integration And Management Market Demand is Rising in North America Request Free Sample

Geographically, the market is led by North America, which accounts for over 38% of demand due to the early adoption of advanced IT operating models and a high concentration of managed service providers.

The region's mature approach to a business outcome-based model is evident, with enterprises actively consolidating fragmented IT environments.

The primary driver is the aggressive shift to hybrid architectures, which demands a robust service delivery framework for managing distinct service level agreements.

The integration of generative AI into a centralized service desk has also accelerated demand for next-gen models that prioritize automation, with some organizations reporting a 20% reduction in mean time to resolution.

Meanwhile, APAC is the fastest-growing region, fueled by rapid digitalization and the increasing complexity of the IT value chain integration, reflecting a global trend toward more structured digital transformation journeys.

Market Dynamics

Our researchers analyzed the data with 2025 as the base year, along with the key drivers, trends, and challenges. A holistic analysis of drivers will help companies refine their marketing strategies to gain a competitive advantage.

  • Successfully navigating the complexities of modern IT requires a strategic approach to managing multiple vendors in IT. The journey often begins with the realization that an ad-hoc approach is unsustainable, pushing organizations toward establishing centralized governance for IT services. The primary goal is improving IT service delivery quality while reducing operational costs with SIAM.
  • The role of the service integrator function is pivotal, acting as the central point of control and coordination. Adhering to SIAM implementation best practices is crucial for realizing the full benefits of multi-sourcing integration. A key distinction arises when comparing the SIAM framework vs traditional ITSM; the former is specifically designed to handle the challenges in a multi-vendor environment.
  • The process of selecting the right SIAM provider demands careful evaluation of capabilities and cultural fit. Organizations are focused on measuring the success of SIAM implementation through clear metrics tied to business goals. Service orchestration in multi-cloud settings has become a critical capability, necessitating a flexible governance model for IT outsourcing.
  • This includes automating service level agreement tracking to ensure compliance. For businesses wondering how to build a SIAM model, the focus should be on achieving end-to-end visibility in IT services. This helps in aligning suppliers with business goals and efficiently managing contracts in a multi-vendor setup, ultimately creating a single source of truth.
  • Enterprises that formalize this process report vendor alignment rates that are nearly twice as effective as those that do not.

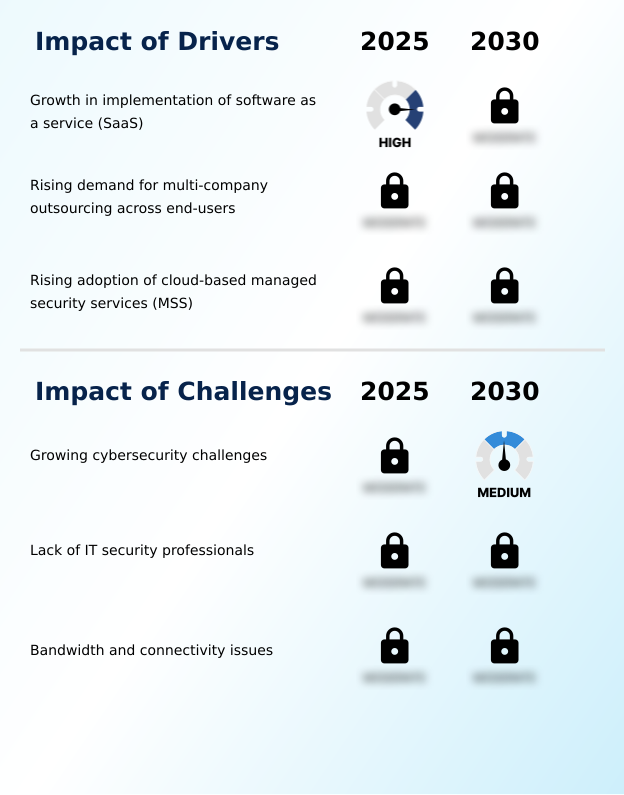
What are the key market drivers leading to the rise in the adoption of Service Integration And Management Industry?

  • The accelerated implementation of Software-as-a-Service (SaaS) models across enterprises stands as a key driver fueling the market's expansion.

  • The proliferation of SaaS applications is a primary market driver, creating a complex multi-provider management challenge that necessitates a formal service orchestration framework.
  • As enterprises adopt best-of-breed tools, an effective tooling integration strategy becomes critical for maintaining operational cohesion and ensuring data sovereignty compliance.
  • This has led to an uptick in the use of api-driven integration and robotic process automation to connect disparate systems, with leading firms automating up to 40% of routine service requests.
  • A cohesive IT sourcing strategy is now essential for managing this ecosystem. Advanced provider collaboration tools and a unified approach to enterprise service management enable organizations to harness the full potential of their software investments.
  • This focus on process orchestration improves service delivery automation, helping achieve over 99.5% uptime for critical business applications.

What are the market trends shaping the Service Integration And Management Industry?

  • A primary market trend is the increasing demand for low-cost IT infrastructure. This shift is compelling organizations to adopt more efficient and cost-effective service delivery models.

  • A significant trend shaping the market is the enterprise-wide drive for IT cost optimization, compelling a shift toward more agile and lean operational frameworks. Organizations are leveraging hybrid cloud governance to balance performance with expenditure, using a sophisticated service portfolio management approach to rationalize applications and infrastructure. This enables better end-to-end service delivery across a multi-vendor landscape.
  • By implementing a unified service catalog, businesses can achieve greater transparency, with some reporting a 15% reduction in redundant IT spending. Furthermore, a robust IT governance model supported by a chargeback and showback model enhances accountability.
  • This strategic focus not only helps in vendor lock-in mitigation but also strengthens operational resilience, ensuring that cost-saving measures do not compromise service quality or availability in the long term.

What challenges does the Service Integration And Management Industry face during its growth?

  • The continuous escalation of sophisticated cybersecurity threats presents a significant challenge to the industry's growth and stability.

  • A primary challenge is ensuring robust information security management across a distributed supplier ecosystem management. With multiple vendors comes a fragmented security posture, increasing the attack surface and complicating contractual obligation tracking for compliance. Establishing a comprehensive performance management framework that includes security metrics is essential for mitigating risks.
  • This requires intense cross-functional collaboration and a strong relationship management framework between the client and each provider. An effective IT service management framework must extend beyond technical performance to include security governance, yet organizations report that aligning security policies across vendors can increase onboarding time by up to 25%.
  • Without ecosystem orchestration for security and a clear operational level agreement for incident response, the risk of breaches rises, impacting end-user experience monitoring and overall business continuity.

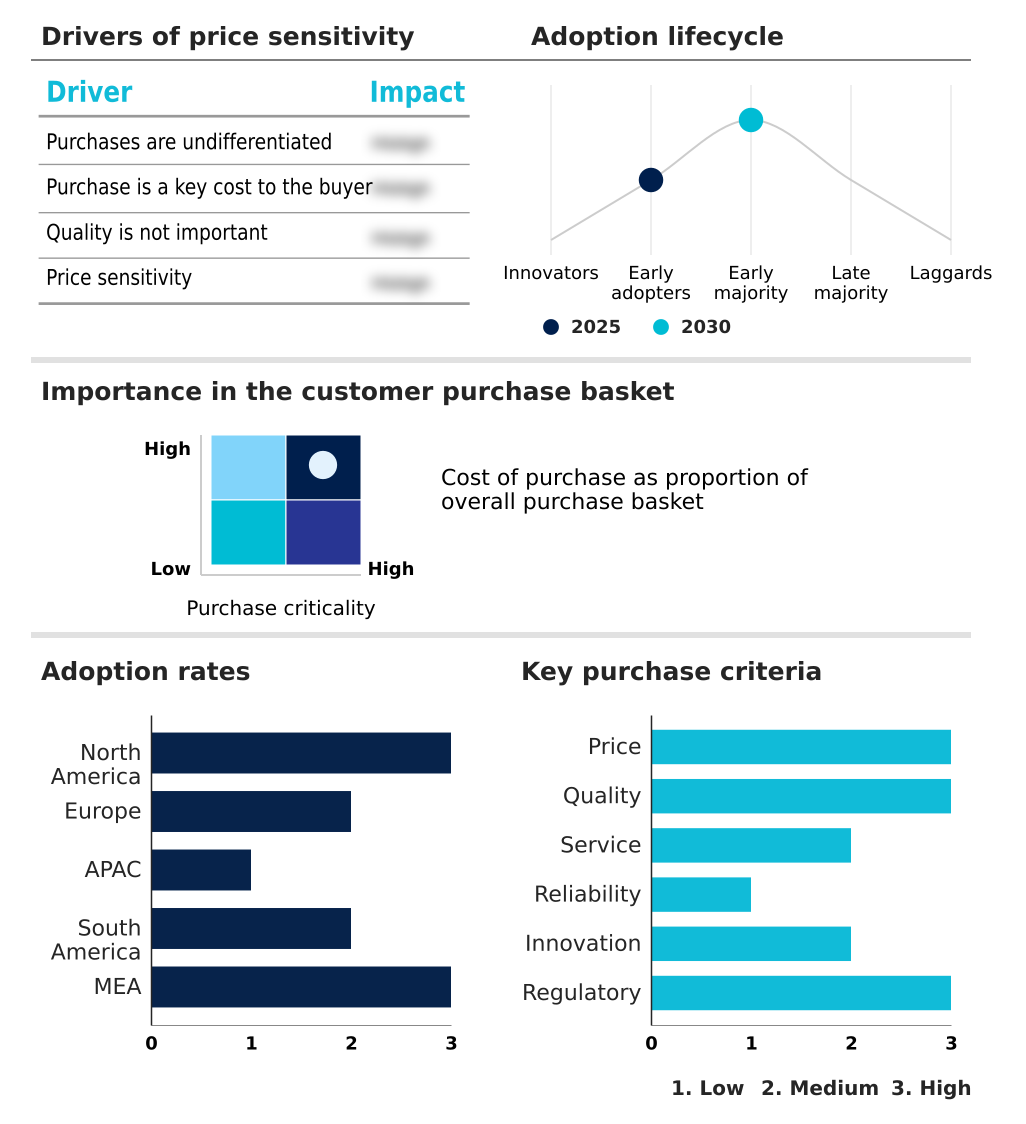
Exclusive Technavio Analysis on Customer Landscape

The service integration and management market forecasting report includes the adoption lifecycle of the market, covering from the innovator’s stage to the laggard’s stage. It focuses on adoption rates in different regions based on penetration. Furthermore, the service integration and management market report also includes key purchase criteria and drivers of price sensitivity to help companies evaluate and develop their market growth analysis strategies.

Customer Landscape of Service Integration And Management Industry

Competitive Landscape

Companies are implementing various strategies, such as strategic alliances, service integration and management market forecast, partnerships, mergers and acquisitions, geographical expansion, and product/service launches, to enhance their presence in the industry.

Atos SE - Provides multi-sourcing service integration solutions engineered to streamline and optimize the management of complex, multi-provider service ecosystems for enhanced operational efficiency.

The industry research and growth report includes detailed analyses of the competitive landscape of the market and information about key companies, including:

  • Atos SE
  • BAE Systems Plc
  • Capgemini Service SAS
  • CGI Inc.
  • Cisco Systems Inc.
  • DXC Technology Co.
  • Fujitsu Ltd.
  • HCL Technologies Ltd.
  • IBM Corp.
  • Infosys Ltd.
  • NTT DATA Corp.
  • ServiceNow Inc.
  • Tata Consultancy Services
  • Tietoevry
  • Wipro Ltd.

Qualitative and quantitative analysis of companies has been conducted to help clients understand the wider business environment as well as the strengths and weaknesses of key industry players. Data is qualitatively analyzed to categorize companies as pure play, category-focused, industry-focused, and diversified; it is quantitatively analyzed to categorize companies as dominant, leading, strong, tentative, and weak.

Recent Development and News in Service integration and management market

  • In September 2024, IBM announced its definitive agreement to acquire HashiCorp, a strategic move designed to enhance its portfolio with advanced multi-cloud infrastructure automation capabilities, which are fundamental to modern service integration.
  • In November 2024, Kyndryl and Google Cloud announced an expanded partnership to develop generative AI solutions, aiming to help customers accelerate data-driven business transformations through enhanced service visibility and integration.
  • In February 2025, ServiceNow launched its new platform release, which includes advanced AI-powered features for intelligent automation, designed to streamline complex workflows and improve coordination across multi-vendor IT environments.
  • In April 2025, Oracle and Palantir Technologies formed a partnership to offer secure cloud and AI solutions aimed at government and defense clients, creating complex ecosystems that require advanced service integration frameworks for governance.

Dive into Technavio’s robust research methodology, blending expert interviews, extensive data synthesis, and validated models for unparalleled Service Integration And Management Market insights. See full methodology.

Market Scope
Page number 300
Base year 2025
Historic period 2020-2024
Forecast period 2026-2030
Growth momentum & CAGR Accelerate at a CAGR of 5.2%
Market growth 2026-2030 USD 1345.5 million
Market structure Fragmented
YoY growth 2025-2026(%) 4.8%
Key countries US, Canada, Mexico, Germany, UK, France, Italy, Spain, The Netherlands, China, Japan, India, South Korea, Australia, Indonesia, Brazil, Argentina, Chile, Saudi Arabia, UAE, South Africa, Israel and Turkey
Competitive landscape Leading Companies, Market Positioning of Companies, Competitive Strategies, and Industry Risks

Request Free Sample

Research Analyst Overview

  • The service integration and management market provides a structured it service management framework essential for organizations navigating complex, multi-vendor environments. This operational process governance enables end-to-end service delivery by creating a cohesive service integrator layer that manages a diverse supplier ecosystem management.
  • It facilitates the it value chain integration and ensures that the overall service delivery model aligns with strategic business objectives through robust business service management. A key trend is the shift from manual oversight to an intelligent it governance model powered by AI, a boardroom-level topic influencing investment in it process automation.
  • This move toward a sophisticated tooling integration strategy and service orchestration allows for predictive issue resolution and it cost optimization. Leading adopters have achieved a 30% reduction in incident escalation by leveraging a multi-vendor integration platform for proactive monitoring.
  • The framework incorporates key processes like incident management, change management, and service catalog management, enabling effective hybrid cloud governance and ensuring data sovereignty compliance while driving cross-functional collaboration and a strong performance management framework.

What are the Key Data Covered in this Service Integration And Management Market Research and Growth Report?

  • What is the expected growth of the Service Integration And Management Market between 2026 and 2030?

    • USD 1.35 billion, at a CAGR of 5.2%

  • What segmentation does the market report cover?

    • The report is segmented by Application (IT and telecom, BFSI, Retail, Manufacturing, and Others), Component (Services, and Solutions), Service Type (Single‑provider model, Hybrid‑provider model, and Internal service integrator model) and Geography (North America, Europe, APAC, South America, Middle East and Africa)

  • Which regions are analyzed in the report?

    • North America, Europe, APAC, South America and Middle East and Africa

  • What are the key growth drivers and market challenges?

    • Growth in implementation of software as a service (SaaS), Growing cybersecurity challenges

  • Who are the major players in the Service Integration And Management Market?

    • Atos SE, BAE Systems Plc, Capgemini Service SAS, CGI Inc., Cisco Systems Inc., DXC Technology Co., Fujitsu Ltd., HCL Technologies Ltd., IBM Corp., Infosys Ltd., NTT DATA Corp., ServiceNow Inc., Tata Consultancy Services, Tietoevry and Wipro Ltd.

Market Research Insights

  • Market dynamics are shifting as organizations increasingly adopt a business outcome-based model, moving beyond simple cost metrics to focus on value delivery. A unified service catalog is becoming standard for improving service discovery, with adoption rates increasing by 30% in mature enterprises.
  • Effective supplier performance management, supported by robust provider collaboration tools, is critical for operational excellence, helping firms achieve a 15% improvement in vendor compliance alignment. The use of a centralized service desk within a broader enterprise service management strategy ensures consistent support.
  • This approach, which emphasizes ecosystem orchestration and a clear service delivery framework, allows businesses to realize greater returns on their IT investments while enhancing overall operational resilience and agility in a competitive landscape.

We can help! Our analysts can customize this service integration and management market research report to meet your requirements.

Get in touch

1. Executive Summary

1.1 Market overview

Executive Summary - Chart on Market Overview
Executive Summary - Data Table on Market Overview
Executive Summary - Chart on Global Market Characteristics
Executive Summary - Chart on Market by Geography
Executive Summary - Chart on Market Segmentation by Application
Executive Summary - Chart on Market Segmentation by Component
Executive Summary - Chart on Market Segmentation by Service Type
Executive Summary - Chart on Incremental Growth
Executive Summary - Data Table on Incremental Growth
Executive Summary - Chart on Company Market Positioning

2. Technavio Analysis

2.1 Analysis of price sensitivity, lifecycle, customer purchase basket, adoption rates, and purchase criteria

2.2 Criticality of inputs and Factors of differentiation

Chart on Overview on criticality of inputs and factors of differentiation

2.3 Factors of disruption

Chart on Overview on factors of disruption

2.4 Impact of drivers and challenges

Chart on Impact of drivers and challenges in 2025 and 2030

3. Market Landscape

3.1 Market ecosystem

Chart on Parent Market
Data Table on - Parent Market

3.2 Market characteristics

Chart on Market characteristics analysis

3.3 Value chain analysis

Chart on Value chain analysis

4. Market Sizing

4.1 Market definition

Data Table on Offerings of companies included in the market definition

4.2 Market segment analysis

Market segments

4.3 Market size 2025

4.4 Market outlook: Forecast for 2025-2030

Chart on Global - Market size and forecast 2025-2030 ($ million)
Data Table on Global - Market size and forecast 2025-2030 ($ million)
Chart on Global Market: Year-over-year growth 2025-2030 (%)
Data Table on Global Market: Year-over-year growth 2025-2030 (%)

5. Historic Market Size

5.1 Global Service Integration And Management Market 2020 - 2024

Historic Market Size - Data Table on Global Service Integration And Management Market 2020 - 2024 ($ million)

5.2 Application segment analysis 2020 - 2024

Historic Market Size - Application Segment 2020 - 2024 ($ million)

5.3 Component segment analysis 2020 - 2024

Historic Market Size - Component Segment 2020 - 2024 ($ million)

5.4 Service Type segment analysis 2020 - 2024

Historic Market Size - Service Type Segment 2020 - 2024 ($ million)

5.5 Geography segment analysis 2020 - 2024

Historic Market Size - Geography Segment 2020 - 2024 ($ million)

5.6 Country segment analysis 2020 - 2024

Historic Market Size - Country Segment 2020 - 2024 ($ million)

6. Qualitative Analysis

6.1 The AI impact on Global Service Integration and Management Market

7. Five Forces Analysis

7.1 Five forces summary

Five forces analysis - Comparison between 2025 and 2030

7.2 Bargaining power of buyers

Bargaining power of buyers - Impact of key factors 2025 and 2030

7.3 Bargaining power of suppliers

Bargaining power of suppliers - Impact of key factors in 2025 and 2030

7.4 Threat of new entrants

Threat of new entrants - Impact of key factors in 2025 and 2030

7.5 Threat of substitutes

Threat of substitutes - Impact of key factors in 2025 and 2030

7.6 Threat of rivalry

Threat of rivalry - Impact of key factors in 2025 and 2030

7.7 Market condition

Chart on Market condition - Five forces 2025 and 2030

8. Market Segmentation by Application

8.1 Market segments

Chart on Application - Market share 2025-2030 (%)
Data Table on Application - Market share 2025-2030 (%)

8.2 Comparison by Application

Chart on Comparison by Application
Data Table on Comparison by Application

8.3 IT and telecom - Market size and forecast 2025-2030

Chart on IT and telecom - Market size and forecast 2025-2030 ($ million)
Data Table on IT and telecom - Market size and forecast 2025-2030 ($ million)
Chart on IT and telecom - Year-over-year growth 2025-2030 (%)
Data Table on IT and telecom - Year-over-year growth 2025-2030 (%)

8.4 BFSI - Market size and forecast 2025-2030

Chart on BFSI - Market size and forecast 2025-2030 ($ million)
Data Table on BFSI - Market size and forecast 2025-2030 ($ million)
Chart on BFSI - Year-over-year growth 2025-2030 (%)
Data Table on BFSI - Year-over-year growth 2025-2030 (%)

8.5 Retail - Market size and forecast 2025-2030

Chart on Retail - Market size and forecast 2025-2030 ($ million)
Data Table on Retail - Market size and forecast 2025-2030 ($ million)
Chart on Retail - Year-over-year growth 2025-2030 (%)
Data Table on Retail - Year-over-year growth 2025-2030 (%)

8.6 Manufacturing - Market size and forecast 2025-2030

Chart on Manufacturing - Market size and forecast 2025-2030 ($ million)
Data Table on Manufacturing - Market size and forecast 2025-2030 ($ million)
Chart on Manufacturing - Year-over-year growth 2025-2030 (%)
Data Table on Manufacturing - Year-over-year growth 2025-2030 (%)

8.7 Others - Market size and forecast 2025-2030

Chart on Others - Market size and forecast 2025-2030 ($ million)
Data Table on Others - Market size and forecast 2025-2030 ($ million)
Chart on Others - Year-over-year growth 2025-2030 (%)
Data Table on Others - Year-over-year growth 2025-2030 (%)

8.8 Market opportunity by Application

Market opportunity by Application ($ million)
Data Table on Market opportunity by Application ($ million)

9. Market Segmentation by Component

9.1 Market segments

Chart on Component - Market share 2025-2030 (%)
Data Table on Component - Market share 2025-2030 (%)

9.2 Comparison by Component

Chart on Comparison by Component
Data Table on Comparison by Component

9.3 Services - Market size and forecast 2025-2030

Chart on Services - Market size and forecast 2025-2030 ($ million)
Data Table on Services - Market size and forecast 2025-2030 ($ million)
Chart on Services - Year-over-year growth 2025-2030 (%)
Data Table on Services - Year-over-year growth 2025-2030 (%)

9.4 Solutions - Market size and forecast 2025-2030

Chart on Solutions - Market size and forecast 2025-2030 ($ million)
Data Table on Solutions - Market size and forecast 2025-2030 ($ million)
Chart on Solutions - Year-over-year growth 2025-2030 (%)
Data Table on Solutions - Year-over-year growth 2025-2030 (%)

9.5 Market opportunity by Component

Market opportunity by Component ($ million)
Data Table on Market opportunity by Component ($ million)

10. Market Segmentation by Service Type

10.1 Market segments

Chart on Service Type - Market share 2025-2030 (%)
Data Table on Service Type - Market share 2025-2030 (%)

10.2 Comparison by Service Type

Chart on Comparison by Service Type
Data Table on Comparison by Service Type

10.3 Single‑provider model - Market size and forecast 2025-2030

Chart on Single‑provider model - Market size and forecast 2025-2030 ($ million)
Data Table on Single‑provider model - Market size and forecast 2025-2030 ($ million)
Chart on Single‑provider model - Year-over-year growth 2025-2030 (%)
Data Table on Single‑provider model - Year-over-year growth 2025-2030 (%)

10.4 Hybrid‑provider model - Market size and forecast 2025-2030

Chart on Hybrid‑provider model - Market size and forecast 2025-2030 ($ million)
Data Table on Hybrid‑provider model - Market size and forecast 2025-2030 ($ million)
Chart on Hybrid‑provider model - Year-over-year growth 2025-2030 (%)
Data Table on Hybrid‑provider model - Year-over-year growth 2025-2030 (%)

10.5 Internal service integrator model - Market size and forecast 2025-2030

Chart on Internal service integrator model - Market size and forecast 2025-2030 ($ million)
Data Table on Internal service integrator model - Market size and forecast 2025-2030 ($ million)
Chart on Internal service integrator model - Year-over-year growth 2025-2030 (%)
Data Table on Internal service integrator model - Year-over-year growth 2025-2030 (%)

10.6 Market opportunity by Service Type

Market opportunity by Service Type ($ million)
Data Table on Market opportunity by Service Type ($ million)

11. Customer Landscape

11.1 Customer landscape overview

Analysis of price sensitivity, lifecycle, customer purchase basket, adoption rates, and purchase criteria

12. Geographic Landscape

12.1 Geographic segmentation

Chart on Market share by geography 2025-2030 (%)
Data Table on Market share by geography 2025-2030 (%)

12.2 Geographic comparison

Chart on Geographic comparison
Data Table on Geographic comparison

12.3 North America - Market size and forecast 2025-2030

Chart on North America - Market size and forecast 2025-2030 ($ million)
Data Table on North America - Market size and forecast 2025-2030 ($ million)
Chart on North America - Year-over-year growth 2025-2030 (%)
Data Table on North America - Year-over-year growth 2025-2030 (%)
Chart on Regional Comparison - North America
Data Table on Regional Comparison - North America

12.3.1 US - Market size and forecast 2025-2030

Chart on US - Market size and forecast 2025-2030 ($ million)
Data Table on US - Market size and forecast 2025-2030 ($ million)
Chart on US - Year-over-year growth 2025-2030 (%)
Data Table on US - Year-over-year growth 2025-2030 (%)

12.3.2 Canada - Market size and forecast 2025-2030

Chart on Canada - Market size and forecast 2025-2030 ($ million)
Data Table on Canada - Market size and forecast 2025-2030 ($ million)
Chart on Canada - Year-over-year growth 2025-2030 (%)
Data Table on Canada - Year-over-year growth 2025-2030 (%)

12.3.3 Mexico - Market size and forecast 2025-2030

Chart on Mexico - Market size and forecast 2025-2030 ($ million)
Data Table on Mexico - Market size and forecast 2025-2030 ($ million)
Chart on Mexico - Year-over-year growth 2025-2030 (%)
Data Table on Mexico - Year-over-year growth 2025-2030 (%)

12.4 Europe - Market size and forecast 2025-2030

Chart on Europe - Market size and forecast 2025-2030 ($ million)
Data Table on Europe - Market size and forecast 2025-2030 ($ million)
Chart on Europe - Year-over-year growth 2025-2030 (%)
Data Table on Europe - Year-over-year growth 2025-2030 (%)
Chart on Regional Comparison - Europe
Data Table on Regional Comparison - Europe

12.4.1 Germany - Market size and forecast 2025-2030

Chart on Germany - Market size and forecast 2025-2030 ($ million)
Data Table on Germany - Market size and forecast 2025-2030 ($ million)
Chart on Germany - Year-over-year growth 2025-2030 (%)
Data Table on Germany - Year-over-year growth 2025-2030 (%)

12.4.2 UK - Market size and forecast 2025-2030

Chart on UK - Market size and forecast 2025-2030 ($ million)
Data Table on UK - Market size and forecast 2025-2030 ($ million)
Chart on UK - Year-over-year growth 2025-2030 (%)
Data Table on UK - Year-over-year growth 2025-2030 (%)

12.4.3 France - Market size and forecast 2025-2030

Chart on France - Market size and forecast 2025-2030 ($ million)
Data Table on France - Market size and forecast 2025-2030 ($ million)
Chart on France - Year-over-year growth 2025-2030 (%)
Data Table on France - Year-over-year growth 2025-2030 (%)

12.4.4 Italy - Market size and forecast 2025-2030

Chart on Italy - Market size and forecast 2025-2030 ($ million)
Data Table on Italy - Market size and forecast 2025-2030 ($ million)
Chart on Italy - Year-over-year growth 2025-2030 (%)
Data Table on Italy - Year-over-year growth 2025-2030 (%)

12.4.5 Spain - Market size and forecast 2025-2030

Chart on Spain - Market size and forecast 2025-2030 ($ million)
Data Table on Spain - Market size and forecast 2025-2030 ($ million)
Chart on Spain - Year-over-year growth 2025-2030 (%)
Data Table on Spain - Year-over-year growth 2025-2030 (%)

12.4.6 The Netherlands - Market size and forecast 2025-2030

Chart on The Netherlands - Market size and forecast 2025-2030 ($ million)
Data Table on The Netherlands - Market size and forecast 2025-2030 ($ million)
Chart on The Netherlands - Year-over-year growth 2025-2030 (%)
Data Table on The Netherlands - Year-over-year growth 2025-2030 (%)

12.5 APAC - Market size and forecast 2025-2030

Chart on APAC - Market size and forecast 2025-2030 ($ million)
Data Table on APAC - Market size and forecast 2025-2030 ($ million)
Chart on APAC - Year-over-year growth 2025-2030 (%)
Data Table on APAC - Year-over-year growth 2025-2030 (%)
Chart on Regional Comparison - APAC
Data Table on Regional Comparison - APAC

12.5.1 China - Market size and forecast 2025-2030

Chart on China - Market size and forecast 2025-2030 ($ million)
Data Table on China - Market size and forecast 2025-2030 ($ million)
Chart on China - Year-over-year growth 2025-2030 (%)
Data Table on China - Year-over-year growth 2025-2030 (%)

12.5.2 Japan - Market size and forecast 2025-2030

Chart on Japan - Market size and forecast 2025-2030 ($ million)
Data Table on Japan - Market size and forecast 2025-2030 ($ million)
Chart on Japan - Year-over-year growth 2025-2030 (%)
Data Table on Japan - Year-over-year growth 2025-2030 (%)

12.5.3 India - Market size and forecast 2025-2030

Chart on India - Market size and forecast 2025-2030 ($ million)
Data Table on India - Market size and forecast 2025-2030 ($ million)
Chart on India - Year-over-year growth 2025-2030 (%)
Data Table on India - Year-over-year growth 2025-2030 (%)

12.5.4 South Korea - Market size and forecast 2025-2030

Chart on South Korea - Market size and forecast 2025-2030 ($ million)
Data Table on South Korea - Market size and forecast 2025-2030 ($ million)
Chart on South Korea - Year-over-year growth 2025-2030 (%)
Data Table on South Korea - Year-over-year growth 2025-2030 (%)

12.5.5 Australia - Market size and forecast 2025-2030

Chart on Australia - Market size and forecast 2025-2030 ($ million)
Data Table on Australia - Market size and forecast 2025-2030 ($ million)
Chart on Australia - Year-over-year growth 2025-2030 (%)
Data Table on Australia - Year-over-year growth 2025-2030 (%)

12.5.6 Indonesia - Market size and forecast 2025-2030

Chart on Indonesia - Market size and forecast 2025-2030 ($ million)
Data Table on Indonesia - Market size and forecast 2025-2030 ($ million)
Chart on Indonesia - Year-over-year growth 2025-2030 (%)
Data Table on Indonesia - Year-over-year growth 2025-2030 (%)

12.6 South America - Market size and forecast 2025-2030

Chart on South America - Market size and forecast 2025-2030 ($ million)
Data Table on South America - Market size and forecast 2025-2030 ($ million)
Chart on South America - Year-over-year growth 2025-2030 (%)
Data Table on South America - Year-over-year growth 2025-2030 (%)
Chart on Regional Comparison - South America
Data Table on Regional Comparison - South America

12.6.1 Brazil - Market size and forecast 2025-2030

Chart on Brazil - Market size and forecast 2025-2030 ($ million)
Data Table on Brazil - Market size and forecast 2025-2030 ($ million)
Chart on Brazil - Year-over-year growth 2025-2030 (%)
Data Table on Brazil - Year-over-year growth 2025-2030 (%)

12.6.2 Argentina - Market size and forecast 2025-2030

Chart on Argentina - Market size and forecast 2025-2030 ($ million)
Data Table on Argentina - Market size and forecast 2025-2030 ($ million)
Chart on Argentina - Year-over-year growth 2025-2030 (%)
Data Table on Argentina - Year-over-year growth 2025-2030 (%)

12.6.3 Chile - Market size and forecast 2025-2030

Chart on Chile - Market size and forecast 2025-2030 ($ million)
Data Table on Chile - Market size and forecast 2025-2030 ($ million)
Chart on Chile - Year-over-year growth 2025-2030 (%)
Data Table on Chile - Year-over-year growth 2025-2030 (%)

12.7 Middle East and Africa - Market size and forecast 2025-2030

Chart on Middle East and Africa - Market size and forecast 2025-2030 ($ million)
Data Table on Middle East and Africa - Market size and forecast 2025-2030 ($ million)
Chart on Middle East and Africa - Year-over-year growth 2025-2030 (%)
Data Table on Middle East and Africa - Year-over-year growth 2025-2030 (%)
Chart on Regional Comparison - Middle East and Africa
Data Table on Regional Comparison - Middle East and Africa

12.7.1 Saudi Arabia - Market size and forecast 2025-2030

Chart on Saudi Arabia - Market size and forecast 2025-2030 ($ million)
Data Table on Saudi Arabia - Market size and forecast 2025-2030 ($ million)
Chart on Saudi Arabia - Year-over-year growth 2025-2030 (%)
Data Table on Saudi Arabia - Year-over-year growth 2025-2030 (%)

12.7.2 UAE - Market size and forecast 2025-2030

Chart on UAE - Market size and forecast 2025-2030 ($ million)
Data Table on UAE - Market size and forecast 2025-2030 ($ million)
Chart on UAE - Year-over-year growth 2025-2030 (%)
Data Table on UAE - Year-over-year growth 2025-2030 (%)

12.7.3 South Africa - Market size and forecast 2025-2030

Chart on South Africa - Market size and forecast 2025-2030 ($ million)
Data Table on South Africa - Market size and forecast 2025-2030 ($ million)
Chart on South Africa - Year-over-year growth 2025-2030 (%)
Data Table on South Africa - Year-over-year growth 2025-2030 (%)

12.7.4 Israel - Market size and forecast 2025-2030

Chart on Israel - Market size and forecast 2025-2030 ($ million)
Data Table on Israel - Market size and forecast 2025-2030 ($ million)
Chart on Israel - Year-over-year growth 2025-2030 (%)
Data Table on Israel - Year-over-year growth 2025-2030 (%)

12.7.5 Turkey - Market size and forecast 2025-2030

Chart on Turkey - Market size and forecast 2025-2030 ($ million)
Data Table on Turkey - Market size and forecast 2025-2030 ($ million)
Chart on Turkey - Year-over-year growth 2025-2030 (%)
Data Table on Turkey - Year-over-year growth 2025-2030 (%)

12.8 Market opportunity by geography

Market opportunity by geography ($ million)
Data Tables on Market opportunity by geography ($ million)

13. Drivers, Challenges, and Opportunity

13.1 Market drivers

Growth in implementation of software as a service (SaaS)
Rising demand for multi-company outsourcing across end-users
Rising adoption of cloud-based managed security services (MSS)

13.2 Market challenges

Growing cybersecurity challenges
Lack of IT security professionals
Bandwidth and connectivity issues

13.3 Impact of drivers and challenges

Impact of drivers and challenges in 2025 and 2030

13.4 Market opportunities

Increasing demand for low-cost IT infrastructure
Emergence of software-defined data centers
Increasing strategic partnerships and collaborations between market participants

14. Competitive Landscape

14.1 Overview

14.2

Overview on criticality of inputs and factors of differentiation

14.3 Landscape disruption

Overview on factors of disruption

14.4 Industry risks

Impact of key risks on business

15. Competitive Analysis

15.1 Companies profiled

Companies covered

15.2 Company ranking index

15.3 Market positioning of companies

Matrix on companies position and classification

15.4 Atos SE

Atos SE - Overview
Atos SE - Business segments
Atos SE - Key news
Atos SE - Key offerings
Atos SE - Segment focus
SWOT

15.5 BAE Systems Plc

BAE Systems Plc - Overview
BAE Systems Plc - Business segments
BAE Systems Plc - Key news
BAE Systems Plc - Key offerings
BAE Systems Plc - Segment focus
SWOT

15.6 Capgemini Service SAS

Capgemini Service SAS - Overview
Capgemini Service SAS - Business segments
Capgemini Service SAS - Key news
Capgemini Service SAS - Key offerings
Capgemini Service SAS - Segment focus
SWOT

15.7 CGI Inc.

CGI Inc. - Overview
CGI Inc. - Business segments
CGI Inc. - Key news
CGI Inc. - Key offerings
CGI Inc. - Segment focus
SWOT

15.8 Cisco Systems Inc.

Cisco Systems Inc. - Overview
Cisco Systems Inc. - Business segments
Cisco Systems Inc. - Key news
Cisco Systems Inc. - Key offerings
Cisco Systems Inc. - Segment focus
SWOT

15.9 DXC Technology Co.

DXC Technology Co. - Overview
DXC Technology Co. - Business segments
DXC Technology Co. - Key news
DXC Technology Co. - Key offerings
DXC Technology Co. - Segment focus
SWOT

15.10 Fujitsu Ltd.

Fujitsu Ltd. - Overview
Fujitsu Ltd. - Business segments
Fujitsu Ltd. - Key news
Fujitsu Ltd. - Key offerings
Fujitsu Ltd. - Segment focus
SWOT

15.11 HCL Technologies Ltd.

HCL Technologies Ltd. - Overview
HCL Technologies Ltd. - Business segments
HCL Technologies Ltd. - Key news
HCL Technologies Ltd. - Key offerings
HCL Technologies Ltd. - Segment focus
SWOT

15.12 IBM Corp.

IBM Corp. - Overview
IBM Corp. - Business segments
IBM Corp. - Key news
IBM Corp. - Key offerings
IBM Corp. - Segment focus
SWOT

15.13 Infosys Ltd.

Infosys Ltd. - Overview
Infosys Ltd. - Business segments
Infosys Ltd. - Key news
Infosys Ltd. - Key offerings
Infosys Ltd. - Segment focus
SWOT

15.14 NTT DATA Corp.

NTT DATA Corp. - Overview
NTT DATA Corp. - Product / Service
NTT DATA Corp. - Key news
NTT DATA Corp. - Key offerings
SWOT

15.15 ServiceNow Inc.

ServiceNow Inc. - Overview
ServiceNow Inc. - Product / Service
ServiceNow Inc. - Key news
ServiceNow Inc. - Key offerings
SWOT

15.16 Tata Consultancy Services

Tata Consultancy Services - Overview
Tata Consultancy Services - Business segments
Tata Consultancy Services - Key news
Tata Consultancy Services - Key offerings
Tata Consultancy Services - Segment focus
SWOT

15.17 Tietoevry

Tietoevry - Overview
Tietoevry - Business segments
Tietoevry - Key offerings
Tietoevry - Segment focus
SWOT

15.18 Wipro Ltd.

Wipro Ltd. - Overview
Wipro Ltd. - Business segments
Wipro Ltd. - Key news
Wipro Ltd. - Key offerings
Wipro Ltd. - Segment focus
SWOT

16. Appendix

16.1 Scope of the report

Market definition
Objectives
Notes and caveats

16.2 Inclusions and exclusions checklist

Inclusions checklist
Exclusions checklist

16.3 Currency conversion rates for US$

16.4 Research methodology

16.5 Data procurement

Information sources

16.6 Data validation

16.7 Validation techniques employed for market sizing

16.8 Data synthesis

16.9 360 degree market analysis

16.10 List of abbreviations

Research Methodology

Technavio presents a detailed picture of the market by way of study, synthesis, and summation of data from multiple sources. The analysts have presented the various facets of the market with a particular focus on identifying the key industry influencers. The data thus presented is comprehensive, reliable, and the result of extensive research, both primary and secondary.

INFORMATION SOURCES

Primary sources

  • Manufacturers and suppliers
  • Channel partners
  • Industry experts
  • Strategic decision makers

Secondary sources

  • Industry journals and periodicals
  • Government data
  • Financial reports of key industry players
  • Historical data
  • Press releases

DATA ANALYSIS

Data Synthesis

  • Collation of data
  • Estimation of key figures
  • Analysis of derived insights

Data Validation

  • Triangulation with data models
  • Reference against proprietary databases
  • Corroboration with industry experts

REPORT WRITING

Qualitative

  • Market drivers
  • Market challenges
  • Market trends
  • Five forces analysis

Quantitative

  • Market size and forecast
  • Market segmentation
  • Geographical insights
  • Competitive landscape

Interested in this report?

Get your sample now to see our research methodology and insights!

Download Now

Frequently Asked Questions

Service Integration And Management market growth will increase by USD 1345.5 million during 2026-2030.

The Service Integration And Management market is expected to grow at a CAGR of 5.2% during 2026-2030.

Service Integration And Management market is segmented by Application (IT and telecom, BFSI, Retail, Manufacturing, Others) Component (Services, Solutions) Service type (Single‑provider model, Hybrid‑provider model, Internal service integrator model)

Atos SE, BAE Systems Plc, Capgemini Service SAS, CGI Inc., Cisco Systems Inc., DXC Technology Co., Fujitsu Ltd., HCL Technologies Ltd., IBM Corp., Infosys Ltd., NTT DATA Corp., ServiceNow Inc., Tata Consultancy Services, Tietoevry, Wipro Ltd. are a few of the key vendors in the Service Integration And Management market.

North America will register the highest growth rate of 38.4% among the other regions. Therefore, the Service Integration And Management market in North America is expected to garner significant business opportunities for the vendors during the forecast period.

US, Canada, Mexico, Germany, UK, France, Italy, Spain, The Netherlands, China, Japan, India, South Korea, Australia, Indonesia, Brazil, Argentina, Chile, Saudi Arabia, UAE, South Africa, Israel, Turkey

  • Growth in implementation of software as a service (SaaS) is the driving factor this market.

The Service Integration And Management market vendors should focus on grabbing business opportunities from the Application segment as it accounted for the largest market share in the base year.