Secure Web Gateway Market Analysis, Size, and Forecast 2026-2030: North America (US, Canada, and Mexico), Europe (Germany, UK, and France), APAC (China, Japan, and India), Middle East and Africa (UAE, Saudi Arabia, and South Africa), South America (Brazil and Argentina), and Rest of World (ROW)

Secure Web Gateway Market Analysis, Size, and Forecast 2026-2030:
North America (US, Canada, and Mexico), Europe (Germany, UK, and France), APAC (China, Japan, and India), Middle East and Africa (UAE, Saudi Arabia, and South Africa), South America (Brazil and Argentina), and Rest of World (ROW)

Published: Dec 2025 294 Pages SKU: IRTNTR71142

Market Overview at a Glance

$35.95 B
Market Opportunity
30.5%
CAGR 2025 - 2030
32.3%
North America Growth
$6.03 B
Cloud segment 2024

Secure Web Gateway Market Size 2026-2030

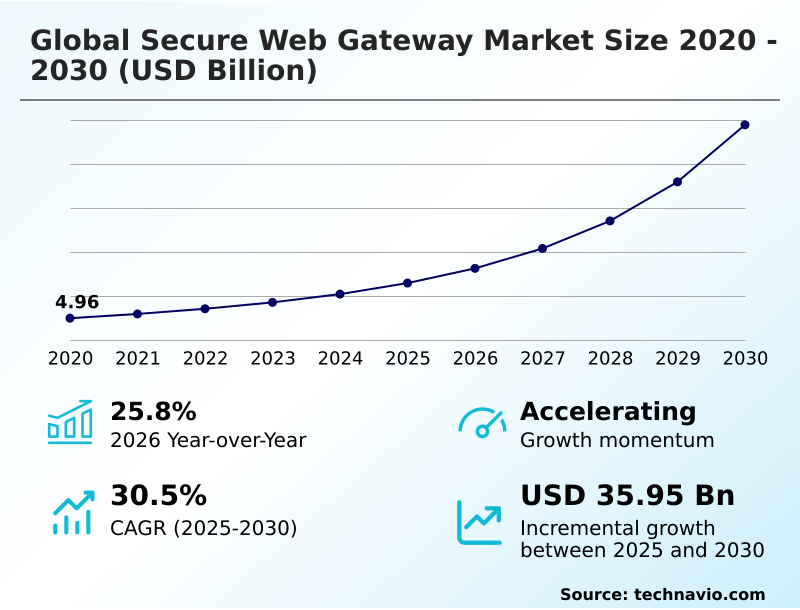
The secure web gateway market size is valued to increase by USD 35.95 billion, at a CAGR of 30.5% from 2025 to 2030. Rising number of cyber attacks will drive the secure web gateway market.

Major Market Trends & Insights

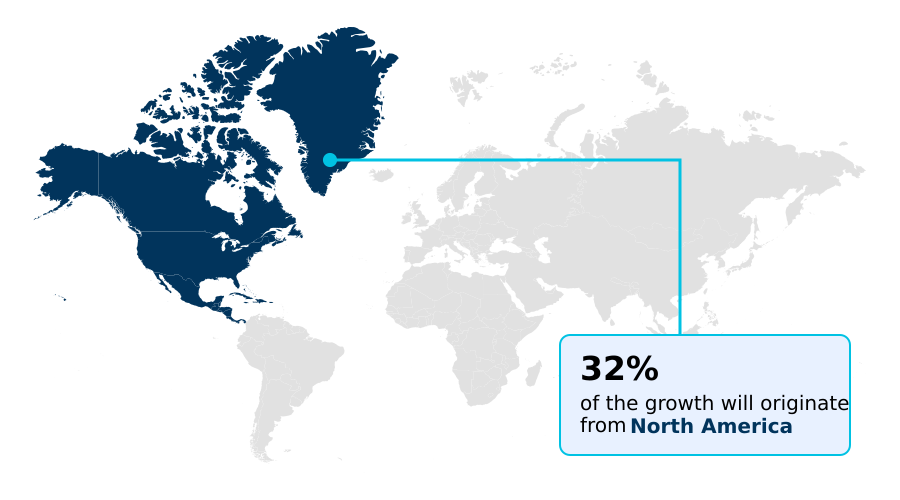
  • North America dominated the market and accounted for a 32.3% growth during the forecast period.
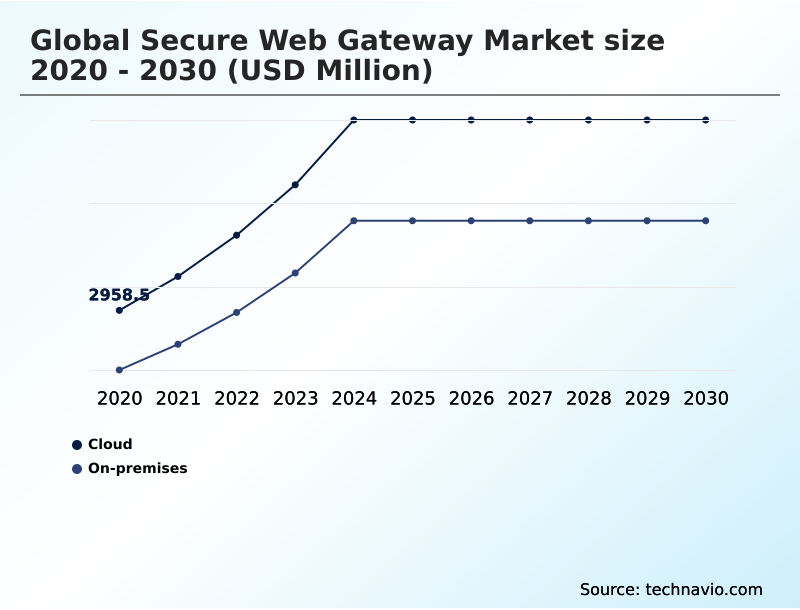
  • By Deployment - Cloud segment was valued at USD 6.03 billion in 2024
  • By End-user - BFSI segment accounted for the largest market revenue share in 2024

Market Size & Forecast

  • Market Opportunities: USD 43.94 billion
  • Market Future Opportunities: USD 35.95 billion
  • CAGR from 2025 to 2030 : 30.5%

Market Summary

  • The secure web gateway market is undergoing a significant transformation, driven by the dissolution of traditional network perimeters and the rapid adoption of cloud services. Organizations are moving away from appliance-based models toward cloud-native security architectures that provide consistent protection for all users, regardless of location.
  • This shift is critical for enabling secure remote access and enforcing corporate policy across a distributed workforce. Key technologies such as SSL/TLS inspection, remote browser isolation, and advanced threat protection are fundamental components. A major driver is the escalating threat landscape, where sophisticated phishing and malware campaigns necessitate real-time threat detection and behavioral analysis.
  • For instance, a multinational financial firm leverages a secure web gateway to protect its global traders, applying granular application control and data loss prevention policies to prevent data exfiltration while ensuring low-latency access to critical market data.
  • The convergence with CASB and ZTNA into a unified security service edge is the defining trend, simplifying management and strengthening the overall security posture. However, complexity and the need for skilled personnel to manage these integrated systems remain notable challenges for enterprises.

What will be the Size of the Secure Web Gateway Market during the forecast period?

Get Key Insights on Market Forecast (PDF) Request Free Sample

How is the Secure Web Gateway Market Segmented?

The secure web gateway industry research report provides comprehensive data (region-wise segment analysis), with forecasts and estimates in "USD million" for the period 2026-2030, as well as historical data from 2020-2024 for the following segments.

  • Deployment
    • Cloud
    • On-premises
  • End-user
    • BFSI
    • IT and telecom
    • Government and defense
    • Others
  • Component
    • Solutions
    • Services
  • Geography
    • North America
      • US
      • Canada
      • Mexico
    • Europe
      • Germany
      • UK
      • France
    • APAC
      • China
      • Japan
      • India
    • Middle East and Africa
      • UAE
      • Saudi Arabia
      • South Africa
    • South America
      • Brazil
      • Argentina
    • Rest of World (ROW)

By Deployment Insights

The cloud segment is estimated to witness significant growth during the forecast period.

The market is segmented by deployment, including cloud and on-premises solutions. Cloud-based secure web gateway solutions, offered by various cloud SWG providers, are increasingly pivotal for securing a distributed workforce.

This model, a core part of modern SASE architecture components, delivers cloud application security and comprehensive cloud-delivered security.

Enterprises are adopting this secure web gateway as a service to manage policies and protect remote users, with cloud deployments constituting over 57% of the market.

This approach ensures consistent protection and policy adherence for organizations navigating digital transformation, reflecting a definitive shift in enterprise security strategy.

Request Free Sample

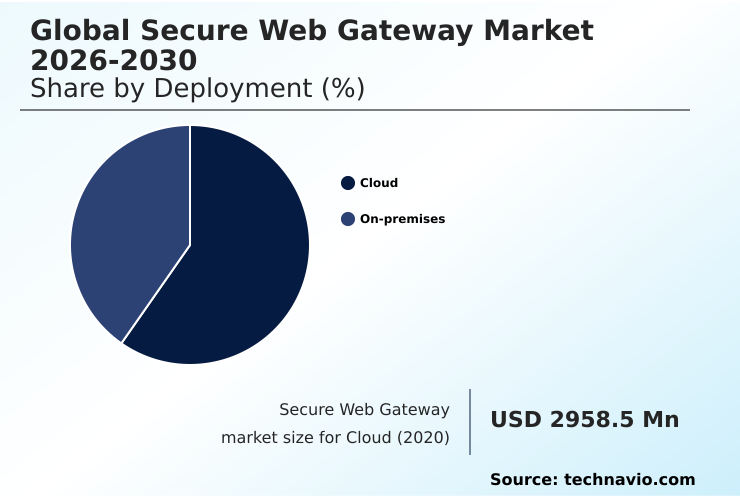
The Cloud segment was valued at USD 6.03 billion in 2024 and showed a gradual increase during the forecast period.

Request Free Sample

Regional Analysis

North America is estimated to contribute 32.3% to the growth of the global market during the forecast period.Technavio’s analysts have elaborately explained the regional trends and drivers that shape the market during the forecast period.

See How Secure Web Gateway Market Demand is Rising in North America Request Free Sample

The global secure web gateway market shows distinct regional dynamics. North America, commanding over 32% of the market, represents the most mature region, driven by stringent regulatory requirements and high adoption of advanced cybersecurity gateways.

This region emphasizes comprehensive data loss prevention and robust application-level security. In contrast, APAC is the fastest-growing market, with organizations experiencing a 23% year-over-year increase in weekly cyberattacks, compelling rapid investment in network traffic security and enterprise network protection.

European markets are heavily influenced by data sovereignty laws, promoting solutions with strong web content inspection and managed security services.

The adoption of a zero trust security model is a common theme across all regions, with a focus on preventing data exfiltration and implementing a strong cloud access security broker for protecting digital assets.
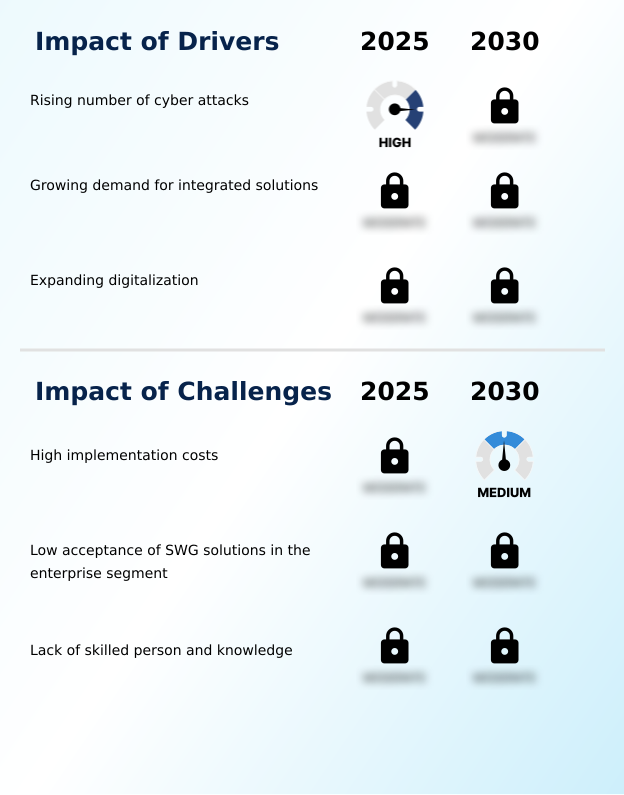
Market Dynamics

Our researchers analyzed the data with 2025 as the base year, along with the key drivers, trends, and challenges. A holistic analysis of drivers will help companies refine their marketing strategies to gain a competitive advantage.

  • The strategic implementation of web security is becoming highly specialized to address specific industry and architectural needs. For organizations evaluating a secure web gateway vs next-generation firewall, the decision often hinges on the need for dedicated, granular web traffic inspection.
  • The use of a secure web gateway for financial services is critical, where secure web gateway data loss prevention policies are essential for compliance. Similarly, a secure web gateway for the healthcare industry must ensure patient data confidentiality.
  • Cloud-native SWG for remote work has become standard, with many businesses seeking the best secure web gateway for SMBs to gain enterprise-grade protection. Implementing zero trust with a secure web gateway, often through zero trust network access SWG integration, is a primary goal.
  • This involves integrating CASB and a secure web gateway and leveraging secure web gateway with SSL inspection benefits for full visibility. As threats evolve, advanced threat protection in secure web gateways is paramount.
  • Key considerations include the on-premises vs cloud secure web gateway cost, the need for reducing latency with a cloud secure web gateway, and the use of a secure web gateway for IoT devices. Proper secure web gateway configuration best practices and robust secure web gateway compliance reporting are non-negotiable.
  • The landscape is also expanding to include SWG for protecting operational technology and a growing reliance on managed secure web gateway service providers.
  • Companies utilizing integrated solutions for API security through a secure web gateway have reported a nearly 50% reduction in API-related security incidents compared to those with siloed approaches, underscoring the benefits of a unified strategy in the SASE vs standalone secure web gateway debate.

What are the key market drivers leading to the rise in the adoption of Secure Web Gateway Industry?

  • The escalating frequency and sophistication of cyberattacks are a primary driver for the adoption of secure web gateway solutions.

  • Market growth is primarily driven by the escalating volume and sophistication of web-based threats, necessitating advanced security measures. Organizations are increasingly deploying a dedicated malware protection gateway to combat ransomware and other malicious code detection.
  • The rise of targeted phishing campaigns is fueling demand for effective phishing prevention tools and robust behavioral analysis. Consequently, enterprise web filtering and content filtering have become fundamental components of corporate network security.
  • The push for secure internet access from any location is another major driver, making an internet security gateway with features like DNS filtering and identity-based security essential.
  • Platforms now offer advanced user activity monitoring, with some analyzing over 500 billion transactions daily to refine threat models.
  • The need to protect expanding digital footprints, with some regions adding more than 30 new data centers in a single year, further underscores the demand for scalable advanced threat protection.

What are the market trends shaping the Secure Web Gateway Industry?

  • The increasing adoption of cloud-based security technologies is a prominent market trend. This shift is driven by the demand for scalable and flexible solutions to protect distributed workforces.

  • Key trends in the market are centered on the convergence of security and networking into unified platforms. The adoption of a next-generation secure web gateway is accelerating, driven by the need for integrated web security and sophisticated ZTNA implementation. This shift supports a holistic threat prevention platform rather than siloed tools.
  • We see a strong move towards comprehensive SWG policy management, enabling granular control over user access and data flows. The demand for scalable solutions has led to innovations like gateways delivering over 100 Gbps of throughput. As part of this trend, there is also rising interest in effective web gateways for SMBs, providing enterprise-level security.
  • The integration of web application firewall and endpoint security capabilities is becoming standard, alongside advanced SSL/TLS inspection and zero-day threat protection for a complete unified threat management strategy that provides robust API security and zero trust network access.

What challenges does the Secure Web Gateway Industry face during its growth?

  • The significant implementation costs associated with secure web gateway solutions present a key challenge to market growth, particularly for small and medium-sized enterprises.

  • A primary challenge in the market is the complexity and cost associated with deploying and managing comprehensive web security solutions, especially a traditional on-premises web gateway. Integrating disparate systems, such as achieving seamless CASB integration and defining effective DLP policies for web access, requires specialized expertise, which is in short supply.
  • A persistent talent gap leaves nearly two-thirds of security teams understaffed, complicating tasks like web traffic monitoring and network traffic analysis. High exit barriers, where specialized assets can account for over 60% of sunk costs, intensify rivalry and pressure companies to maintain complex legacy systems.
  • This can inhibit the adoption of a more agile hybrid SWG deployment or a full data leak prevention gateway. Ensuring corporate web security for secure remote access without compromising performance requires careful configuration of the web security appliance and robust application control, posing a significant operational hurdle for many organizations.

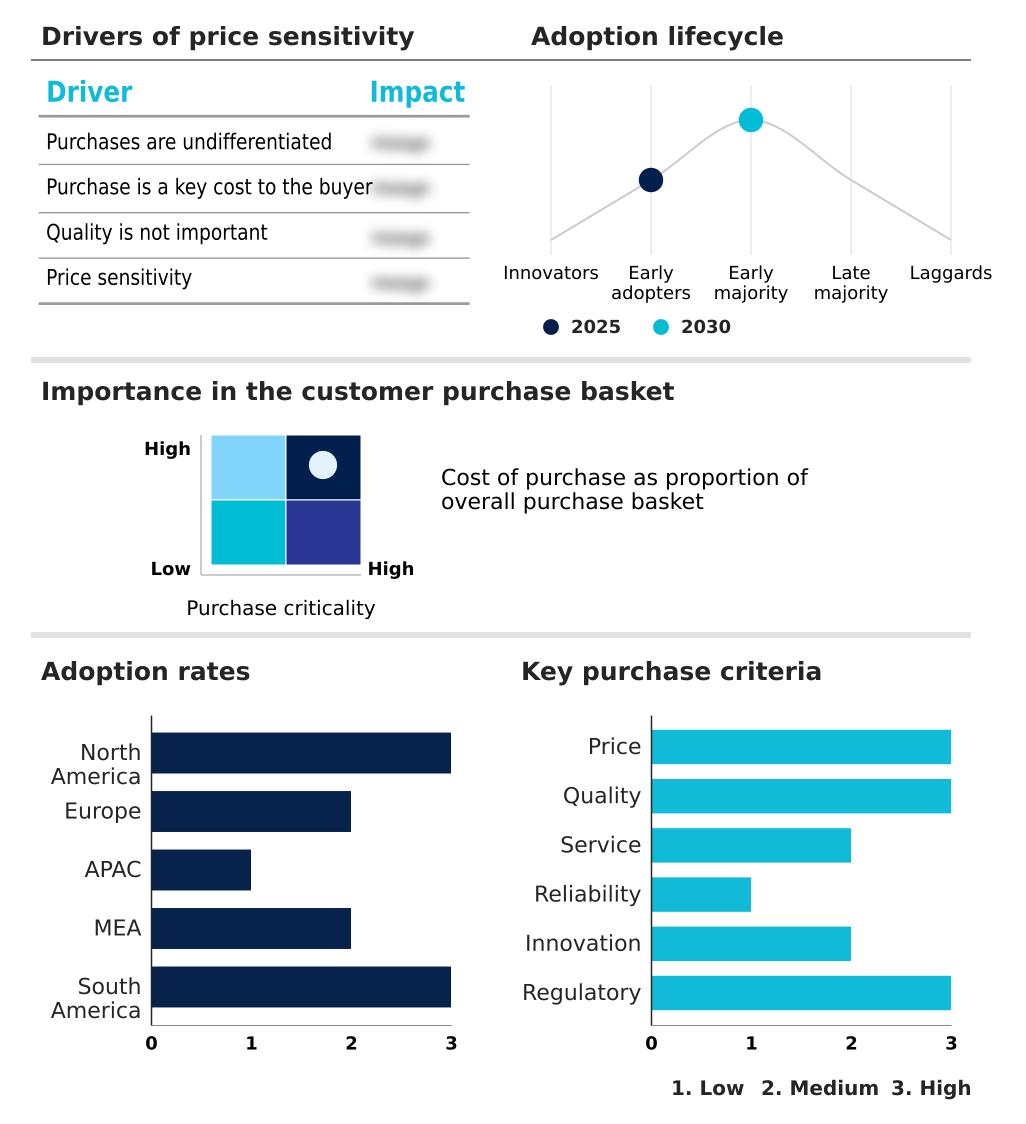
Exclusive Technavio Analysis on Customer Landscape

The secure web gateway market forecasting report includes the adoption lifecycle of the market, covering from the innovator’s stage to the laggard’s stage. It focuses on adoption rates in different regions based on penetration. Furthermore, the secure web gateway market report also includes key purchase criteria and drivers of price sensitivity to help companies evaluate and develop their market growth analysis strategies.

Customer Landscape of Secure Web Gateway Industry

Competitive Landscape

Companies are implementing various strategies, such as strategic alliances, secure web gateway market forecast, partnerships, mergers and acquisitions, geographical expansion, and product/service launches, to enhance their presence in the industry.

Barracuda Networks Inc. - Core offerings provide integrated secure web gateway solutions, delivering advanced threat protection and policy enforcement for diverse enterprise architectures.

The industry research and growth report includes detailed analyses of the competitive landscape of the market and information about key companies, including:

  • Barracuda Networks Inc.
  • Broadcom Inc.
  • Cato Networks Ltd.
  • Check Point Software Tech Ltd.
  • Cisco Systems Inc.
  • Citrix Systems Inc.
  • Comodo Security Solutions Inc
  • Contentkeeper Technologies
  • F5 Inc.
  • Forcepoint LLC
  • McAfee LLC
  • Menlo Security Inc.
  • Netskope Inc.
  • Norton Enterprises Inc
  • Open Text Corp.
  • Sangfor Technologies Inc.
  • Sophos Ltd.
  • Trend Micro Inc.
  • Zscaler Inc.

Qualitative and quantitative analysis of companies has been conducted to help clients understand the wider business environment as well as the strengths and weaknesses of key industry players. Data is qualitatively analyzed to categorize companies as pure play, category-focused, industry-focused, and diversified; it is quantitatively analyzed to categorize companies as dominant, leading, strong, tentative, and weak.

Recent Development and News in Secure web gateway market

  • In August, 2024, Skyhigh Security announced the integration of its Secure Web Gateway for Cloud with Trellix Intelligent Virtual Execution Cloud to provide enhanced malware scanning and threat detection capabilities.
  • In November, 2024, F5 Inc. announced early access to its F5 AI Gateway, a new solution designed to secure and optimize enterprise access to artificial intelligence and large language model applications.
  • In January, 2025, the Digital Operational Resilience Act (DORA) came into full effect across the European Union, mandating that financial entities implement stringent cybersecurity measures, including comprehensive web filtering and threat protection.
  • In April, 2025, the European Commission adopted the ProtectEU Internal Security Strategy, which identifies strengthening cybersecurity and protecting critical infrastructure as key pillars, influencing security investments and policy across member states.

Dive into Technavio’s robust research methodology, blending expert interviews, extensive data synthesis, and validated models for unparalleled Secure Web Gateway Market insights. See full methodology.

Market Scope
Page number 294
Base year 2025
Historic period 2020-2024
Forecast period 2026-2030
Growth momentum & CAGR Accelerate at a CAGR of 30.5%
Market growth 2026-2030 USD 35953.5 million
Market structure Fragmented
YoY growth 2025-2026(%) 25.8%
Key countries US, Canada, Mexico, Germany, UK, France, Italy, Spain, The Netherlands, China, Japan, India, South Korea, Australia, Indonesia, UAE, Saudi Arabia, South Africa, Israel, Turkey, Brazil, Argentina and Chile
Competitive landscape Leading Companies, Market Positioning of Companies, Competitive Strategies, and Industry Risks

Request Free Sample

Research Analyst Overview

  • The secure web gateway market is defined by its evolution from a simple web filter to a critical component of modern network security. At its core, the technology provides essential URL filtering, content filtering, and malicious code detection.
  • However, its strategic value is now tied to its role within a broader cybersecurity gateway framework that incorporates advanced threat protection through sandboxing, behavioral analysis, and real-time threat intelligence feeds. The industry is pivoting toward a security service edge model, integrating zero trust network access and cloud access security broker functionalities.
  • This requires robust identity-based security and policy enforcement for SaaS security and API security. Boardroom discussions now focus on whether to invest in a standalone web security appliance or a fully integrated, cloud-native security platform that offers hybrid cloud security and managed security services.
  • These platforms perform deep SSL/TLS inspection and DNS filtering, with capabilities like remote browser isolation for zero-day threat protection. Effective endpoint security integration, application control, and web traffic monitoring with network traffic analysis are standard. Furthermore, data loss prevention and data exfiltration prevention are crucial for compliance.
  • Platforms delivering unified threat management demonstrate a 40% improvement in threat response times, influencing budgeting decisions toward consolidated solutions that enable secure remote access and comprehensive application-level security.

What are the Key Data Covered in this Secure Web Gateway Market Research and Growth Report?

  • What is the expected growth of the Secure Web Gateway Market between 2026 and 2030?

    • USD 35.95 billion, at a CAGR of 30.5%

  • What segmentation does the market report cover?

    • The report is segmented by Deployment (Cloud, and On-premises), End-user (BFSI, IT and telecom, Government and defense, and Others), Component (Solutions, and Services) and Geography (North America, Europe, APAC, Middle East and Africa, South America)

  • Which regions are analyzed in the report?

    • North America, Europe, APAC, Middle East and Africa and South America

  • What are the key growth drivers and market challenges?

    • Rising number of cyber attacks, High implementation costs

  • Who are the major players in the Secure Web Gateway Market?

    • Barracuda Networks Inc., Broadcom Inc., Cato Networks Ltd., Check Point Software Tech Ltd., Cisco Systems Inc., Citrix Systems Inc., Comodo Security Solutions Inc, Contentkeeper Technologies, F5 Inc., Forcepoint LLC, McAfee LLC, Menlo Security Inc., Netskope Inc., Norton Enterprises Inc, Open Text Corp., Sangfor Technologies Inc., Sophos Ltd., Trend Micro Inc. and Zscaler Inc.

Market Research Insights

  • Market dynamics are shaped by a pronounced shift toward integrated security frameworks. The adoption of a zero trust security model has increased by over 40% as organizations aim to fortify their enterprise network protection against evolving threats. This is driving demand for comprehensive secure web gateway solutions that provide robust network traffic security and advanced malware protection.
  • The move to a cloud-delivered security model is accelerating, with platforms capable of processing over 500 billion transactions daily demonstrating the required scalability. Organizations are increasingly looking for a unified threat prevention platform to simplify operations.
  • This consolidation delivers tangible benefits, with some integrated platforms demonstrating the ability to reduce security policy management overhead by up to 35%, enabling more effective web content inspection and corporate web security across the enterprise.

We can help! Our analysts can customize this secure web gateway market research report to meet your requirements.

Get in touch

1. Executive Summary

1.1 Market overview

Executive Summary - Chart on Market Overview
Executive Summary - Data Table on Market Overview
Executive Summary - Chart on Global Market Characteristics
Executive Summary - Chart on Market by Geography
Executive Summary - Chart on Market Segmentation by Deployment
Executive Summary - Chart on Market Segmentation by End-user
Executive Summary - Chart on Market Segmentation by Component
Executive Summary - Chart on Incremental Growth
Executive Summary - Data Table on Incremental Growth
Executive Summary - Chart on Company Market Positioning

2. Technavio Analysis

2.1 Analysis of price sensitivity, lifecycle, customer purchase basket, adoption rates, and purchase criteria

2.2 Criticality of inputs and Factors of differentiation

Chart on Overview on criticality of inputs and factors of differentiation

2.3 Factors of disruption

Chart on Overview on factors of disruption

2.4 Impact of drivers and challenges

Chart on Impact of drivers and challenges in 2025 and 2030

3. Market Landscape

3.1 Market ecosystem

Chart on Parent Market
Data Table on - Parent Market

3.2 Market characteristics

Chart on Market characteristics analysis

3.3 Value chain analysis

Chart on Value chain analysis

4. Market Sizing

4.1 Market definition

Data Table on Offerings of companies included in the market definition

4.2 Market segment analysis

Market segments

4.3 Market size 2025

4.4 Market outlook: Forecast for 2025-2030

Chart on Global - Market size and forecast 2025-2030 ($ million)
Data Table on Global - Market size and forecast 2025-2030 ($ million)
Chart on Global Market: Year-over-year growth 2025-2030 (%)
Data Table on Global Market: Year-over-year growth 2025-2030 (%)

5. Historic Market Size

5.1 Global Secure Web Gateway Market 2020 - 2024

Historic Market Size - Data Table on Global Secure Web Gateway Market 2020 - 2024 ($ million)

5.2 Deployment segment analysis 2020 - 2024

Historic Market Size - Deployment Segment 2020 - 2024 ($ million)

5.3 End-user segment analysis 2020 - 2024

Historic Market Size - End-user Segment 2020 - 2024 ($ million)

5.4 Component segment analysis 2020 - 2024

Historic Market Size - Component Segment 2020 - 2024 ($ million)

5.5 Geography segment analysis 2020 - 2024

Historic Market Size - Geography Segment 2020 - 2024 ($ million)

5.6 Country segment analysis 2020 - 2024

Historic Market Size - Country Segment 2020 - 2024 ($ million)

6. Qualitative Analysis

6.1 AI impact on Global Secure Web Gateway Market

7. Five Forces Analysis

7.1 Five forces summary

Five forces analysis - Comparison between 2025 and 2030

7.2 Bargaining power of buyers

Bargaining power of buyers - Impact of key factors 2025 and 2030

7.3 Bargaining power of suppliers

Bargaining power of suppliers - Impact of key factors in 2025 and 2030

7.4 Threat of new entrants

Threat of new entrants - Impact of key factors in 2025 and 2030

7.5 Threat of substitutes

Threat of substitutes - Impact of key factors in 2025 and 2030

7.6 Threat of rivalry

Threat of rivalry - Impact of key factors in 2025 and 2030

7.7 Market condition

Chart on Market condition - Five forces 2025 and 2030

8. Market Segmentation by Deployment

8.1 Market segments

Chart on Deployment - Market share 2025-2030 (%)
Data Table on Deployment - Market share 2025-2030 (%)

8.2 Comparison by Deployment

Chart on Comparison by Deployment
Data Table on Comparison by Deployment

8.3 Cloud - Market size and forecast 2025-2030

Chart on Cloud - Market size and forecast 2025-2030 ($ million)
Data Table on Cloud - Market size and forecast 2025-2030 ($ million)
Chart on Cloud - Year-over-year growth 2025-2030 (%)
Data Table on Cloud - Year-over-year growth 2025-2030 (%)

8.4 On-premises - Market size and forecast 2025-2030

Chart on On-premises - Market size and forecast 2025-2030 ($ million)
Data Table on On-premises - Market size and forecast 2025-2030 ($ million)
Chart on On-premises - Year-over-year growth 2025-2030 (%)
Data Table on On-premises - Year-over-year growth 2025-2030 (%)

8.5 Market opportunity by Deployment

Market opportunity by Deployment ($ million)
Data Table on Market opportunity by Deployment ($ million)

9. Market Segmentation by End-user

9.1 Market segments

Chart on End-user - Market share 2025-2030 (%)
Data Table on End-user - Market share 2025-2030 (%)

9.2 Comparison by End-user

Chart on Comparison by End-user
Data Table on Comparison by End-user

9.3 BFSI - Market size and forecast 2025-2030

Chart on BFSI - Market size and forecast 2025-2030 ($ million)
Data Table on BFSI - Market size and forecast 2025-2030 ($ million)
Chart on BFSI - Year-over-year growth 2025-2030 (%)
Data Table on BFSI - Year-over-year growth 2025-2030 (%)

9.4 IT and telecom - Market size and forecast 2025-2030

Chart on IT and telecom - Market size and forecast 2025-2030 ($ million)
Data Table on IT and telecom - Market size and forecast 2025-2030 ($ million)
Chart on IT and telecom - Year-over-year growth 2025-2030 (%)
Data Table on IT and telecom - Year-over-year growth 2025-2030 (%)

9.5 Government and defense - Market size and forecast 2025-2030

Chart on Government and defense - Market size and forecast 2025-2030 ($ million)
Data Table on Government and defense - Market size and forecast 2025-2030 ($ million)
Chart on Government and defense - Year-over-year growth 2025-2030 (%)
Data Table on Government and defense - Year-over-year growth 2025-2030 (%)

9.6 Others - Market size and forecast 2025-2030

Chart on Others - Market size and forecast 2025-2030 ($ million)
Data Table on Others - Market size and forecast 2025-2030 ($ million)
Chart on Others - Year-over-year growth 2025-2030 (%)
Data Table on Others - Year-over-year growth 2025-2030 (%)

9.7 Market opportunity by End-user

Market opportunity by End-user ($ million)
Data Table on Market opportunity by End-user ($ million)

10. Market Segmentation by Component

10.1 Market segments

Chart on Component - Market share 2025-2030 (%)
Data Table on Component - Market share 2025-2030 (%)

10.2 Comparison by Component

Chart on Comparison by Component
Data Table on Comparison by Component

10.3 Solutions - Market size and forecast 2025-2030

Chart on Solutions - Market size and forecast 2025-2030 ($ million)
Data Table on Solutions - Market size and forecast 2025-2030 ($ million)
Chart on Solutions - Year-over-year growth 2025-2030 (%)
Data Table on Solutions - Year-over-year growth 2025-2030 (%)

10.4 Services - Market size and forecast 2025-2030

Chart on Services - Market size and forecast 2025-2030 ($ million)
Data Table on Services - Market size and forecast 2025-2030 ($ million)
Chart on Services - Year-over-year growth 2025-2030 (%)
Data Table on Services - Year-over-year growth 2025-2030 (%)

10.5 Market opportunity by Component

Market opportunity by Component ($ million)
Data Table on Market opportunity by Component ($ million)

11. Customer Landscape

11.1 Customer landscape overview

Analysis of price sensitivity, lifecycle, customer purchase basket, adoption rates, and purchase criteria

12. Geographic Landscape

12.1 Geographic segmentation

Chart on Market share by geography 2025-2030 (%)
Data Table on Market share by geography 2025-2030 (%)

12.2 Geographic comparison

Chart on Geographic comparison
Data Table on Geographic comparison

12.3 North America - Market size and forecast 2025-2030

Chart on North America - Market size and forecast 2025-2030 ($ million)
Data Table on North America - Market size and forecast 2025-2030 ($ million)
Chart on North America - Year-over-year growth 2025-2030 (%)
Data Table on North America - Year-over-year growth 2025-2030 (%)
Chart on Regional Comparison - North America
Data Table on Regional Comparison - North America

12.3.1 US - Market size and forecast 2025-2030

Chart on US - Market size and forecast 2025-2030 ($ million)
Data Table on US - Market size and forecast 2025-2030 ($ million)
Chart on US - Year-over-year growth 2025-2030 (%)
Data Table on US - Year-over-year growth 2025-2030 (%)

12.3.2 Canada - Market size and forecast 2025-2030

Chart on Canada - Market size and forecast 2025-2030 ($ million)
Data Table on Canada - Market size and forecast 2025-2030 ($ million)
Chart on Canada - Year-over-year growth 2025-2030 (%)
Data Table on Canada - Year-over-year growth 2025-2030 (%)

12.3.3 Mexico - Market size and forecast 2025-2030

Chart on Mexico - Market size and forecast 2025-2030 ($ million)
Data Table on Mexico - Market size and forecast 2025-2030 ($ million)
Chart on Mexico - Year-over-year growth 2025-2030 (%)
Data Table on Mexico - Year-over-year growth 2025-2030 (%)

12.4 Europe - Market size and forecast 2025-2030

Chart on Europe - Market size and forecast 2025-2030 ($ million)
Data Table on Europe - Market size and forecast 2025-2030 ($ million)
Chart on Europe - Year-over-year growth 2025-2030 (%)
Data Table on Europe - Year-over-year growth 2025-2030 (%)
Chart on Regional Comparison - Europe
Data Table on Regional Comparison - Europe

12.4.1 Germany - Market size and forecast 2025-2030

Chart on Germany - Market size and forecast 2025-2030 ($ million)
Data Table on Germany - Market size and forecast 2025-2030 ($ million)
Chart on Germany - Year-over-year growth 2025-2030 (%)
Data Table on Germany - Year-over-year growth 2025-2030 (%)

12.4.2 UK - Market size and forecast 2025-2030

Chart on UK - Market size and forecast 2025-2030 ($ million)
Data Table on UK - Market size and forecast 2025-2030 ($ million)
Chart on UK - Year-over-year growth 2025-2030 (%)
Data Table on UK - Year-over-year growth 2025-2030 (%)

12.4.3 France - Market size and forecast 2025-2030

Chart on France - Market size and forecast 2025-2030 ($ million)
Data Table on France - Market size and forecast 2025-2030 ($ million)
Chart on France - Year-over-year growth 2025-2030 (%)
Data Table on France - Year-over-year growth 2025-2030 (%)

12.4.4 Italy - Market size and forecast 2025-2030

Chart on Italy - Market size and forecast 2025-2030 ($ million)
Data Table on Italy - Market size and forecast 2025-2030 ($ million)
Chart on Italy - Year-over-year growth 2025-2030 (%)
Data Table on Italy - Year-over-year growth 2025-2030 (%)

12.4.5 Spain - Market size and forecast 2025-2030

Chart on Spain - Market size and forecast 2025-2030 ($ million)
Data Table on Spain - Market size and forecast 2025-2030 ($ million)
Chart on Spain - Year-over-year growth 2025-2030 (%)
Data Table on Spain - Year-over-year growth 2025-2030 (%)

12.4.6 The Netherlands - Market size and forecast 2025-2030

Chart on The Netherlands - Market size and forecast 2025-2030 ($ million)
Data Table on The Netherlands - Market size and forecast 2025-2030 ($ million)
Chart on The Netherlands - Year-over-year growth 2025-2030 (%)
Data Table on The Netherlands - Year-over-year growth 2025-2030 (%)

12.5 APAC - Market size and forecast 2025-2030

Chart on APAC - Market size and forecast 2025-2030 ($ million)
Data Table on APAC - Market size and forecast 2025-2030 ($ million)
Chart on APAC - Year-over-year growth 2025-2030 (%)
Data Table on APAC - Year-over-year growth 2025-2030 (%)
Chart on Regional Comparison - APAC
Data Table on Regional Comparison - APAC

12.5.1 China - Market size and forecast 2025-2030

Chart on China - Market size and forecast 2025-2030 ($ million)
Data Table on China - Market size and forecast 2025-2030 ($ million)
Chart on China - Year-over-year growth 2025-2030 (%)
Data Table on China - Year-over-year growth 2025-2030 (%)

12.5.2 Japan - Market size and forecast 2025-2030

Chart on Japan - Market size and forecast 2025-2030 ($ million)
Data Table on Japan - Market size and forecast 2025-2030 ($ million)
Chart on Japan - Year-over-year growth 2025-2030 (%)
Data Table on Japan - Year-over-year growth 2025-2030 (%)

12.5.3 India - Market size and forecast 2025-2030

Chart on India - Market size and forecast 2025-2030 ($ million)
Data Table on India - Market size and forecast 2025-2030 ($ million)
Chart on India - Year-over-year growth 2025-2030 (%)
Data Table on India - Year-over-year growth 2025-2030 (%)

12.5.4 South Korea - Market size and forecast 2025-2030

Chart on South Korea - Market size and forecast 2025-2030 ($ million)
Data Table on South Korea - Market size and forecast 2025-2030 ($ million)
Chart on South Korea - Year-over-year growth 2025-2030 (%)
Data Table on South Korea - Year-over-year growth 2025-2030 (%)

12.5.5 Australia - Market size and forecast 2025-2030

Chart on Australia - Market size and forecast 2025-2030 ($ million)
Data Table on Australia - Market size and forecast 2025-2030 ($ million)
Chart on Australia - Year-over-year growth 2025-2030 (%)
Data Table on Australia - Year-over-year growth 2025-2030 (%)

12.5.6 Indonesia - Market size and forecast 2025-2030

Chart on Indonesia - Market size and forecast 2025-2030 ($ million)
Data Table on Indonesia - Market size and forecast 2025-2030 ($ million)
Chart on Indonesia - Year-over-year growth 2025-2030 (%)
Data Table on Indonesia - Year-over-year growth 2025-2030 (%)

12.6 Middle East and Africa - Market size and forecast 2025-2030

Chart on Middle East and Africa - Market size and forecast 2025-2030 ($ million)
Data Table on Middle East and Africa - Market size and forecast 2025-2030 ($ million)
Chart on Middle East and Africa - Year-over-year growth 2025-2030 (%)
Data Table on Middle East and Africa - Year-over-year growth 2025-2030 (%)
Chart on Regional Comparison - Middle East and Africa
Data Table on Regional Comparison - Middle East and Africa

12.6.1 UAE - Market size and forecast 2025-2030

Chart on UAE - Market size and forecast 2025-2030 ($ million)
Data Table on UAE - Market size and forecast 2025-2030 ($ million)
Chart on UAE - Year-over-year growth 2025-2030 (%)
Data Table on UAE - Year-over-year growth 2025-2030 (%)

12.6.2 Saudi Arabia - Market size and forecast 2025-2030

Chart on Saudi Arabia - Market size and forecast 2025-2030 ($ million)
Data Table on Saudi Arabia - Market size and forecast 2025-2030 ($ million)
Chart on Saudi Arabia - Year-over-year growth 2025-2030 (%)
Data Table on Saudi Arabia - Year-over-year growth 2025-2030 (%)

12.6.3 South Africa - Market size and forecast 2025-2030

Chart on South Africa - Market size and forecast 2025-2030 ($ million)
Data Table on South Africa - Market size and forecast 2025-2030 ($ million)
Chart on South Africa - Year-over-year growth 2025-2030 (%)
Data Table on South Africa - Year-over-year growth 2025-2030 (%)

12.6.4 Israel - Market size and forecast 2025-2030

Chart on Israel - Market size and forecast 2025-2030 ($ million)
Data Table on Israel - Market size and forecast 2025-2030 ($ million)
Chart on Israel - Year-over-year growth 2025-2030 (%)
Data Table on Israel - Year-over-year growth 2025-2030 (%)

12.6.5 Turkey - Market size and forecast 2025-2030

Chart on Turkey - Market size and forecast 2025-2030 ($ million)
Data Table on Turkey - Market size and forecast 2025-2030 ($ million)
Chart on Turkey - Year-over-year growth 2025-2030 (%)
Data Table on Turkey - Year-over-year growth 2025-2030 (%)

12.7 South America - Market size and forecast 2025-2030

Chart on South America - Market size and forecast 2025-2030 ($ million)
Data Table on South America - Market size and forecast 2025-2030 ($ million)
Chart on South America - Year-over-year growth 2025-2030 (%)
Data Table on South America - Year-over-year growth 2025-2030 (%)
Chart on Regional Comparison - South America
Data Table on Regional Comparison - South America

12.7.1 Brazil - Market size and forecast 2025-2030

Chart on Brazil - Market size and forecast 2025-2030 ($ million)
Data Table on Brazil - Market size and forecast 2025-2030 ($ million)
Chart on Brazil - Year-over-year growth 2025-2030 (%)
Data Table on Brazil - Year-over-year growth 2025-2030 (%)

12.7.2 Argentina - Market size and forecast 2025-2030

Chart on Argentina - Market size and forecast 2025-2030 ($ million)
Data Table on Argentina - Market size and forecast 2025-2030 ($ million)
Chart on Argentina - Year-over-year growth 2025-2030 (%)
Data Table on Argentina - Year-over-year growth 2025-2030 (%)

12.7.3 Chile - Market size and forecast 2025-2030

Chart on Chile - Market size and forecast 2025-2030 ($ million)
Data Table on Chile - Market size and forecast 2025-2030 ($ million)
Chart on Chile - Year-over-year growth 2025-2030 (%)
Data Table on Chile - Year-over-year growth 2025-2030 (%)

12.8 Market opportunity by geography

Market opportunity by geography ($ million)
Data Tables on Market opportunity by geography ($ million)

13. Drivers, Challenges, and Opportunity

13.1 Market drivers

Rising number of cyber attacks
Growing demand for integrated solutions
Expanding digitalization

13.2 Market challenges

High implementation costs
Low acceptance of SWG solutions in the enterprise segment
Lack of skilled person and knowledge

13.3 Impact of drivers and challenges

Impact of drivers and challenges in 2025 and 2030

13.4 Market opportunities

Rising adoption of cloud-based security technologies
Adoption of hybrid model
Growth in IoT devices

14. Competitive Landscape

14.1 Overview

14.2

Overview on criticality of inputs and factors of differentiation

14.3 Landscape disruption

Overview on factors of disruption

14.4 Industry risks

Impact of key risks on business

15. Competitive Analysis

15.1 Companies profiled

Companies covered

15.2 Company ranking index

15.3 Market positioning of companies

Matrix on companies position and classification

15.4 Barracuda Networks Inc.

Barracuda Networks Inc. - Overview
Barracuda Networks Inc. - Product / Service
Barracuda Networks Inc. - Key news
Barracuda Networks Inc. - Key offerings
SWOT

15.5 Broadcom Inc.

Broadcom Inc. - Overview
Broadcom Inc. - Business segments
Broadcom Inc. - Key news
Broadcom Inc. - Key offerings
Broadcom Inc. - Segment focus
SWOT

15.6 Cato Networks Ltd.

Cato Networks Ltd. - Overview
Cato Networks Ltd. - Product / Service
Cato Networks Ltd. - Key offerings
SWOT

15.7 Check Point Software Tech Ltd.

Check Point Software Tech Ltd. - Overview
Check Point Software Tech Ltd. - Product / Service
Check Point Software Tech Ltd. - Key news
Check Point Software Tech Ltd. - Key offerings
SWOT

15.8 Cisco Systems Inc.

Cisco Systems Inc. - Overview
Cisco Systems Inc. - Business segments
Cisco Systems Inc. - Key news
Cisco Systems Inc. - Key offerings
Cisco Systems Inc. - Segment focus
SWOT

15.9 F5 Inc.

F5 Inc. - Overview
F5 Inc. - Product / Service
F5 Inc. - Key news
F5 Inc. - Key offerings
SWOT

15.10 Forcepoint LLC

Forcepoint LLC - Overview
Forcepoint LLC - Product / Service
Forcepoint LLC - Key offerings
SWOT

15.11 McAfee LLC

McAfee LLC - Overview
McAfee LLC - Product / Service
McAfee LLC - Key offerings
SWOT

15.12 Netskope Inc.

Netskope Inc. - Overview
Netskope Inc. - Product / Service
Netskope Inc. - Key offerings
SWOT

15.13 Norton Enterprises Inc

Norton Enterprises Inc - Overview
Norton Enterprises Inc - Product / Service
Norton Enterprises Inc - Key offerings
SWOT

15.14 Open Text Corp.

Open Text Corp. - Overview
Open Text Corp. - Business segments
Open Text Corp. - Key news
Open Text Corp. - Key offerings
Open Text Corp. - Segment focus
SWOT

15.15 Sangfor Technologies Inc.

Sangfor Technologies Inc. - Overview
Sangfor Technologies Inc. - Product / Service
Sangfor Technologies Inc. - Key offerings
SWOT

15.16 Sophos Ltd.

Sophos Ltd. - Overview
Sophos Ltd. - Product / Service
Sophos Ltd. - Key news
Sophos Ltd. - Key offerings
SWOT

15.17 Trend Micro Inc.

Trend Micro Inc. - Overview
Trend Micro Inc. - Product / Service
Trend Micro Inc. - Key offerings
SWOT

15.18 Zscaler Inc.

Zscaler Inc. - Overview
Zscaler Inc. - Product / Service
Zscaler Inc. - Key offerings
SWOT

16. Appendix

16.1 Scope of the report

Market definition
Objectives
Notes and caveats

16.2 Inclusions and exclusions checklist

Inclusions checklist
Exclusions checklist

16.3 Currency conversion rates for US$

16.4 Research methodology

16.5 Data procurement

Information sources

16.6 Data validation

16.7 Validation techniques employed for market sizing

16.8 Data synthesis

16.9 360 degree market analysis

16.10 List of abbreviations

Research Methodology

Technavio presents a detailed picture of the market by way of study, synthesis, and summation of data from multiple sources. The analysts have presented the various facets of the market with a particular focus on identifying the key industry influencers. The data thus presented is comprehensive, reliable, and the result of extensive research, both primary and secondary.

INFORMATION SOURCES

Primary sources

  • Manufacturers and suppliers
  • Channel partners
  • Industry experts
  • Strategic decision makers

Secondary sources

  • Industry journals and periodicals
  • Government data
  • Financial reports of key industry players
  • Historical data
  • Press releases

DATA ANALYSIS

Data Synthesis

  • Collation of data
  • Estimation of key figures
  • Analysis of derived insights

Data Validation

  • Triangulation with data models
  • Reference against proprietary databases
  • Corroboration with industry experts

REPORT WRITING

Qualitative

  • Market drivers
  • Market challenges
  • Market trends
  • Five forces analysis

Quantitative

  • Market size and forecast
  • Market segmentation
  • Geographical insights
  • Competitive landscape

Interested in this report?

Get your sample now to see our research methodology and insights!

Download Now

Frequently Asked Questions

Secure Web Gateway market growth will increase by USD 35953.5 million during 2026-2030.

The Secure Web Gateway market is expected to grow at a CAGR of 30.5% during 2026-2030.

Secure Web Gateway market is segmented by Deployment (Cloud, On-premises) End-user (BFSI, IT and telecom, Government and defense, Others) Component (Solutions, Services)

Barracuda Networks Inc., Broadcom Inc., Cato Networks Ltd., Check Point Software Tech Ltd., Cisco Systems Inc., Citrix Systems Inc., Comodo Security Solutions Inc, Contentkeeper Technologies, F5 Inc., Forcepoint LLC, McAfee LLC, Menlo Security Inc., Netskope Inc., Norton Enterprises Inc, Open Text Corp., Sangfor Technologies Inc., Sophos Ltd., Trend Micro Inc., Zscaler Inc. are a few of the key vendors in the Secure Web Gateway market.

North America will register the highest growth rate of 32.3% among the other regions. Therefore, the Secure Web Gateway market in North America is expected to garner significant business opportunities for the vendors during the forecast period.

US, Canada, Mexico, Germany, UK, France, Italy, Spain, The Netherlands, China, Japan, India, South Korea, Australia, Indonesia, UAE, Saudi Arabia, South Africa, Israel, Turkey, Brazil, Argentina, Chile

  • Rising number of cyber attacks is the driving factor this market.

The Secure Web Gateway market vendors should focus on grabbing business opportunities from the Deployment segment as it accounted for the largest market share in the base year.