Sea Freight Forwarding Market Analysis North America, APAC, Europe, Middle East and Africa, South America - US, China, Japan, Germany, France - Size and Forecast 2024-2028

Sea Freight Forwarding Market Analysis North America, APAC, Europe, Middle East and Africa, South America - US, China, Japan, Germany, France - Size and Forecast 2024-2028

Published: Jan 2024 184 Pages SKU: IRTNTR44732

Market Overview at a Glance

$21.6 B
Market Opportunity
5.29%
CAGR
4.82
YoY growth 2023-2024(%)

Seafreight Forwarding Market Size 2024-2028 

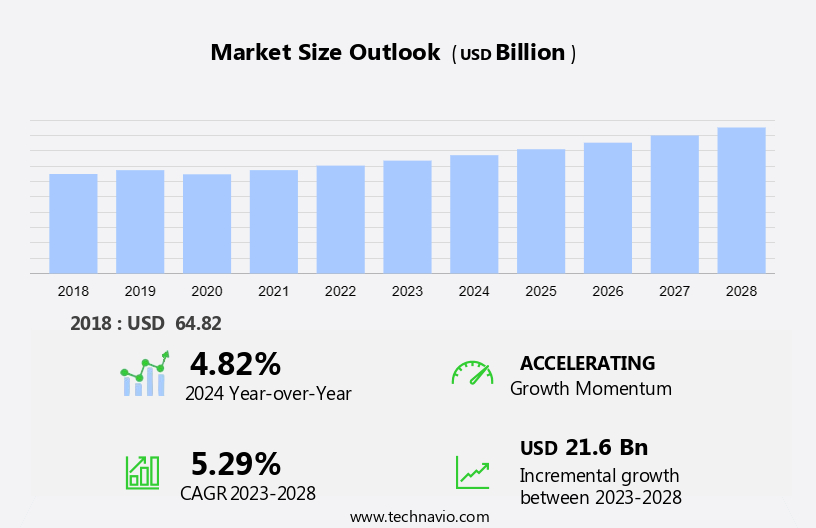
The seafreight forwarding market size is forecast to increase by USD 21.6 billion at a CAGR of 5.29% between 2023 and 2028.

The market is experiencing significant changes due to several key drivers and trends. The increasing size of retail e-commerce sales and revenues is leading to a growth in seaborne trade, resulting in higher demand for shipping services. New vessels with larger capacities are being introduced to meet this demand, but consolidation in the shipping industry is driving up freight costs and operational challenges. The integration of blockchain technology in the shipping industry aims to address these issues by enhancing transparency and efficiency. As customers continue to rely on international trade for raw materials and finished goods, shipping costs remain a critical factor in supply chain management. Staying informed of these market trends and challenges is essential for businesses looking to optimize their logistics operations and remain competitive.

What will be the Seafreight Forwarding Market Size During the Forecast Period?

Seafreight Forwarding Market Size

 Request Free Sample

  • The market is a critical component of the global logistics and transportation industry, facilitating the movement of goods from their point of origin to their destination via carrier ships and containers on cargo ships. This market plays a significant role in the worldwide operations of businesses, particularly those dealing with heavy loads and long distances. Internet penetration has revolutionized the seafreight forwarding industry, enabling real-time tracking and monitoring of shipments. This transparency and efficiency have led to increased reliance on ocean freight forwarders for their services. Purchasing power parity and infrastructure development in various regions have further fueled the growth of this market. The seafreight forwarding industry is characterized by the transportation of various types of cargo, including hazardous materials, using different modes of transportation, such as waterways and marines. Carbon emissions and fuel consumption are essential considerations in seafreight forwarding, with the industry continually seeking ways to minimize these impacts. The infrastructure development in the shipping industry has been a key driver for the growth of the market. New ports, advanced container terminals, and improved shipping routes have increased the capacity and efficiency of the industry.
  • Additionally, the ability to handle heavy loads and the flexibility to cater to various cargo types have made seafreight forwarding an attractive option for businesses. The market caters to a diverse range of industries, including manufacturing, retail, and agriculture, among others. The market's global reach allows businesses to source raw materials and sell finished products to customers across the world, contributing to economic growth and trade. In conclusion, the market is an essential part of the global logistics and transportation landscape. Its ability to handle heavy loads and long distances, combined with the increasing efficiency and transparency brought about by technology, makes it a valuable asset for businesses seeking to expand their reach and grow their operations. The market's continued growth is expected to be driven by infrastructure development, purchasing power parity, and the increasing reliance on real-time tracking and monitoring.

How is this market segmented and which is the largest segment?

The market research report provides comprehensive data (region-wise segment analysis), with forecasts and estimates in "USD billion" for the period 2024-2028, as well as historical data from 2018-2022 for the following segments.
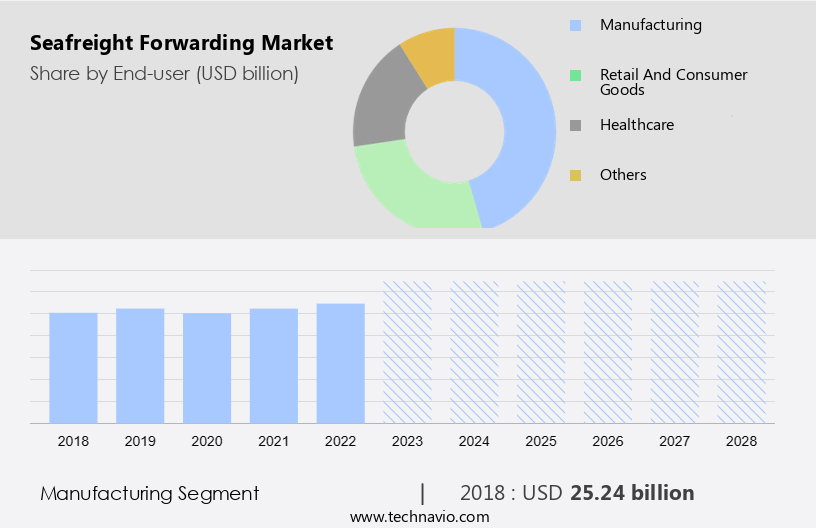
  • End-user
    • Manufacturing
    • Retail and consumer goods
    • Healthcare
    • Others
  • Type
    • Full container load
    • Less-than container load
  • Geography
    • North America
      • US
    • APAC
      • China
      • Japan
    • Europe
      • Germany
      • France
    • Middle East and Africa
    • South America

By End-user Insights

  • The manufacturing segment is estimated to witness significant growth during the forecast period.

Seafreight forwarding plays a crucial role in transporting equipment, machinery, and precision instruments for various manufacturing industries such as automotive, chemical, oil and gas, electronics, and wood and paper. The increasing consumer demand for automobiles and goods in developing economies will fuel the growth of these industries and subsequently increase the demand for seafreight forwarding services. Commercial ships, including merchant vessels, are the primary mode of transportation for bulk cargo, making seafreight forwarding a cost-effective option for long-distance shipping. Moreover, the adoption of advanced technology and the rise in international trade are expected to boost the manufacturing segment of The market. Manufacturing industries, including automotive, chemical, oil and gas, electronics, and wood and paper, are significant contributors to the global economy.

Similarly, seafreight forwarding enables the efficient and reliable transportation of goods produced by these industries, enabling businesses to meet the increasing demand for their products. The merchant fleet plays a vital role in seaborne trade volumes, transporting a wide range of goods from raw materials to finished products. Ocean freight forwarders facilitate the smooth transportation of these goods, ensuring timely delivery and reducing logistical complexities.  In conclusion, the manufacturing sector's growth, driven by the increasing consumer demand for goods and the adoption of technology, will continue to fuel the demand for seafreight forwarding services. Seafreight forwarding offers a cost-effective and reliable solution for transporting large volumes of cargo over long distances, making it an essential component of the global supply chain.

Seafreight Forwarding Market Size

Get a glance at the market report of share of various segments Request Free Sample

The manufacturing segment was valued at USD 25.24 billion in 2018 and showed a gradual increase during the forecast period.

Regional Analysis

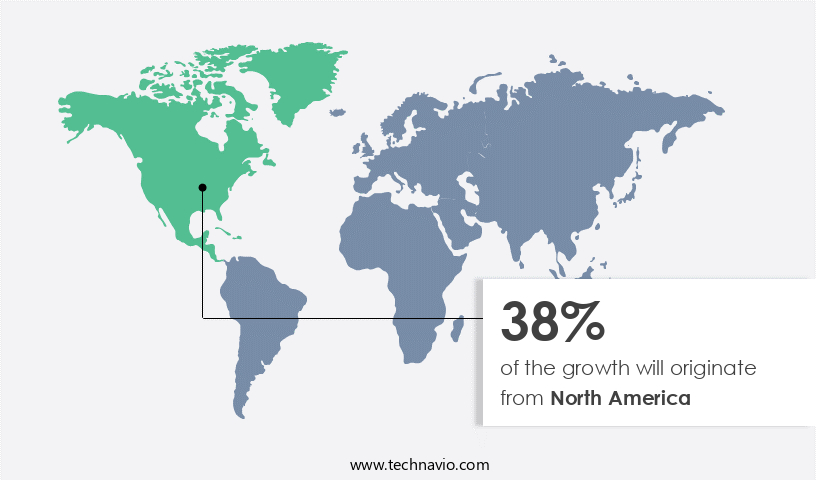
  • North America is estimated to contribute 38% to the growth of the global market during the forecast period.

Technavio's analysts have elaborately explained the regional trends and drivers that shape the market during the forecast period.

Seafreight Forwarding Market Share by Geography

For more insights on the market share of various regions, Request Free Sample

The Panama Canal expansion has significantly impacted the market in North America. With the canal now accommodating larger, wider, and heavier vessels, the transit time and cost of transportation have been reduced. This development allows seafreight forwarders to achieve economies of scale, as the higher the volume of shipments in containers, the lower the operating costs. Consequently, the growth of the market in North America is expected to be driven by the increase in freight volumes at US ports of entry during the forecast period. As freight forwarders leverage this opportunity, they can efficiently transport cargo using carrier ships and containers aboard cargo ships, ensuring timely and cost-effective logistics solutions.

Market Dynamics

Our researchers analyzed the data with 2023 as the base year, along with the key drivers, trends, and challenges. A holistic analysis of drivers will help companies refine their marketing strategies to gain a competitive advantage.

What are the key market drivers leading to the rise in adoption of Seafreight Forwarding Market?

The growing global cross-border e-commerce market driving LCL volume is the key driver of the market.

  • The expansion of the global cross-border e-commerce sector, driven by increased Internet access and rising purchasing power parity, is leading to a significant increase in the volume of seafreight cargo worldwide. The United States and China are major players in this industry, with the US being the largest importer of cross-border e-commerce goods. The growth in e-commerce sales, particularly in online shopping, is leading to a rise in the number of small package shipments, which are primarily transported via Less than Container Load (LCL) seafreight.
  • To cater to this growing demand, logistics providers are expanding their LCL networks and services in seafreight. For instance, in April 2022, DACHSER announced the extension of its LCL network in seafreight, connecting Scandinavia and China. This trend is expected to continue, as more companies enter the cross-border e-commerce market and seek to offer comprehensive logistics solutions.

What are the market trends shaping the Seafreight Forwarding Market?

The introduction of blockchain in the shipping industry is the upcoming trend in the market.

  • Blockchain technology, a distributed and secure digital ledger system, is revolutionizing various industries, including maritime transportation. This technology uses a chain of cryptographically secured data to record and verify transactions, eliminating the need for a central authority to maintain records. In seafreight forwarding, blockchain can streamline processes and reduce costs. However, its implementation on a large scale in the industry faces challenges, such as interoperability, device management, and cost burden. New vessels and fleet sizes continue to expand in the seaborne trade sector, driven by retail e-commerce sales and increasing e-retail revenues. Customers demand faster and more efficient shipping services to meet their needs.
  • Similarly, shipping costs remain a significant factor in international trade. Blockchain technology can address these challenges by providing a secure and transparent system for tracking and verifying transactions. Despite these benefits, the adoption of blockchain technology in seafreight forwarding is uncertain. Shipping lines must invest in the necessary infrastructure and address interoperability issues to ensure effective implementation. Additionally, the cost burden of implementing blockchain technology may deter some companies from adopting it.
  • However, the potential for increased efficiency and cost savings make it an attractive option for those willing to invest in the technology. In conclusion, blockchain technology offers significant benefits to the seafreight forwarding industry, including increased efficiency, transparency, and cost savings. However, challenges such as interoperability, device management, and cost burden must be addressed for widespread adoption. As the industry continues to evolve, blockchain technology may become a game-changer for seafreight forwarding operations.

What challenges does Seafreight Forwarding Market face during the growth?

Consolidation in the shipping industry leading to high freight costs and operational difficulties is a key challenge affecting the market growth.

  • The market is experiencing a trend towards consolidation, leading to an oligopolistic industry structure. This consolidation is in response to the financial challenges faced by the shipping industry following the 2008 recession and the COVID-19 pandemic. The pandemic caused a significant decrease in demand, resulting in underutilized vessels and low shipping rates. In response, major shipping companies have formed alliances to reduce excess vessel capacity and lower the cost of disposing of idle ships. For example, on January 19, 2024, Mullen Group announced its intent to acquire Richmond, a container world forwarding company. Internet penetration has played a crucial role in the growth of the market, enabling businesses to connect and transact globally.
  • Moreover, the purchasing power parity in various regions has influenced the demand for seafreight forwarding services, particularly in emerging markets. The infrastructure development in these regions, coupled with the availability of workforces, has further boosted the market's growth. The shipping industry's primary commodities include coal, oil, and gas. The shipping rates for these commodities have been volatile due to various economic factors, including supply and demand imbalances and geopolitical tensions. However, the market has remained resilient, providing essential logistics services to various industries.

Exclusive Customer Landscape

The market forecasting report includes the adoption lifecycle of the market, covering from the innovator's stage to the laggard's stage. It focuses on adoption rates in different regions based on penetration. Furthermore, the market report also includes key purchase criteria and drivers of price sensitivity to help companies evaluate and develop their market growth analysis strategies.
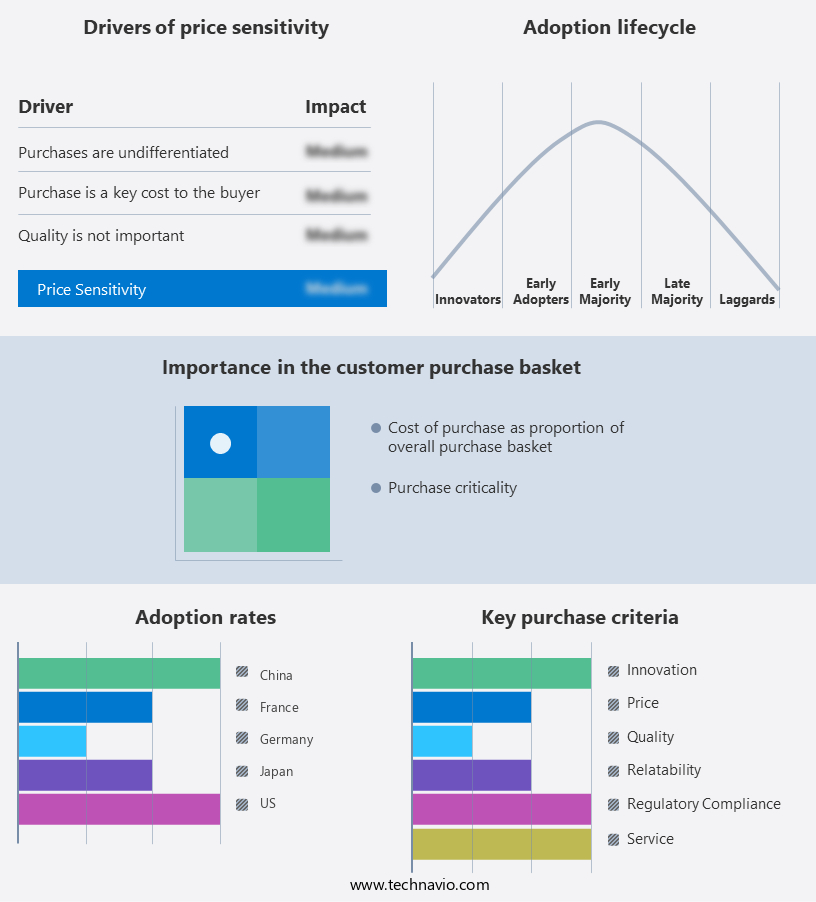
Seafreight Forwarding Market Share by Geography

 Customer Landscape

Key Companies & Market Insights

Companies are implementing various strategies, such as strategic alliances, market forecast, partnerships, mergers and acquisitions, geographical expansion, and product/service launches, to enhance their presence in the market. The market research and growth report includes detailed analyses of the competitive landscape of the market and information about key companies, including:

  • Agility Public Warehousing Co. K.S.C.P
  • AP Moller Maersk AS
  • Bollore SE
  • C H Robinson Worldwide Inc.
  • CEVA Logistics S A
  • DACHSER SE
  • DB Schenker
  • Deutsche Post AG
  • DSV AS
  • Expeditors International of Washington Inc.
  • GEODIS
  • Glaube Logistics
  • Hellmann Worldwide Logistics SE and Co KG
  • Hitachi Ltd.
  • Inchcape Shipping Services
  • Kuehne Nagel Management AG
  • LX Pantos India Pvt Ltd.
  • Mullen Group
  • Nippon Express Holdings Inc.
  • Nippon Yusen Kabushiki Kaisha
  • SF Express Co. Ltd.
  • Total Group
  • United Parcel Service Inc.
  • Sinotrans Ltd.

Qualitative and quantitative analysis of companies has been conducted to help clients understand the wider business environment as well as the strengths and weaknesses of key market players. Data is qualitatively analyzed to categorize companies as pure play, category-focused, industry-focused, and diversified; it is quantitatively analyzed to categorize companies as dominant, leading, strong, tentative, and weak.

Research Analyst Overview

The market is a crucial component of the global logistics and transportation industry, facilitating the movement of goods from their point of origin to their destination via cargo ships and containers. Freight forwarders play a vital role in managing the complexities of international trade activities, including the coordination of shipping, security, and documentation. The shipping industry's growth is driven by several factors, including the increasing volumes of seaborne trade, the rise of cross-border e-commerce and online shopping, and the infrastructure development of waterways and marines. Retail e-commerce sales and e-retail revenues continue to grow, leading to an increase in demand for ocean freight forwarding services.

Similarly, the shipping industry's workforces are continually adapting to technology advancements, with new vessels and fleet sizes expanding to meet the demands of various industries, such as coal, oil and gas, raw materials, and consumer goods. The shipping rates remain competitive, with the merchant fleet and commercial ships catering to a diverse range of cargo, from hazardous materials to consumer appliances, healthcare products, textiles, and industrial goods. The shipping industry's carbon footprint is a significant concern, with efforts underway to reduce carbon emissions through the use of fuel-efficient ships and alternative energy sources. Industry investors are also exploring the potential of artificial intelligence (AI) to optimize shipping routes, improve operational efficiency, and enhance customer experience. In conclusion, the market is a dynamic and evolving industry, with a vast network of worldwide operations and a diverse customer base. The market's growth is underpinned by the increasing volumes of international trade activities, the rise of e-commerce, and the continuous advancements in technology.

Market Scope

Report Coverage

Details

Page number

184

Base year

2023

Historic period

2018-2022

Forecast period

2024-2028

Growth momentum & CAGR

Accelerate at a CAGR of 5.29%

Market growth 2024-2028

USD 21.6 billion

Market structure

Fragmented

YoY growth 2023-2024(%)

4.82

Key countries

US, China, Japan, Germany, and France

Competitive landscape

Leading Companies, Market Positioning of Companies, Competitive Strategies, and Industry Risks

Request Free Sample

What are the Key Data Covered in this Market Research and Growth Report?

  • CAGR of the market during the forecast period
  • Detailed information on factors that will drive the market growth and forecasting between 2024 and 2028
  • Precise estimation of the size of the market  and its contribution of the market in focus to the parent market
  • Accurate predictions about upcoming market growth and trends and changes in consumer behaviour
  • Growth of the market across North America, APAC, Europe, Middle East and Africa, and South America
  • Thorough analysis of the market's competitive landscape and detailed information about companies
  • Comprehensive analysis of factors that will challenge the growth of market companies

We can help! Our analysts can customize this market research report to meet your requirements. Get in touch

1 Executive Summary

  • 1.1 Market overview
    • Exhibit 01: Executive Summary – Chart on Market Overview
    • Exhibit 02: Executive Summary – Data Table on Market Overview
    • Exhibit 03: Executive Summary – Chart on Global Market Characteristics
    • Exhibit 04: Executive Summary – Chart on Market by Geography
    • Exhibit 05: Executive Summary – Chart on Market Segmentation by End-user
    • Exhibit 06: Executive Summary – Chart on Market Segmentation by Type
    • Exhibit 07: Executive Summary – Chart on Incremental Growth
    • Exhibit 08: Executive Summary – Data Table on Incremental Growth
    • Exhibit 09: Executive Summary – Chart on Vendor Market Positioning

2 Market Landscape

  • 2.1 Market ecosystem
    • Exhibit 10: Parent market
    • Exhibit 11: Market Characteristics

3 Market Sizing

  • 3.1 Market definition
    • Exhibit 12: Offerings of vendors included in the market definition
  • 3.2 Market segment analysis
    • Exhibit 13: Market segments
  • 3.3 Market size 2023
    • 3.4 Market outlook: Forecast for 2023-2028
      • Exhibit 14: Chart on Global - Market size and forecast 2023-2028 ($ billion)
      • Exhibit 15: Data Table on Global - Market size and forecast 2023-2028 ($ billion)
      • Exhibit 16: Chart on Global Market: Year-over-year growth 2023-2028 (%)
      • Exhibit 17: Data Table on Global Market: Year-over-year growth 2023-2028 (%)

    4 Historic Market Size

    • 4.1 Global seafreight forwarding market 2018 - 2022
      • Exhibit 18: Historic Market Size – Data Table on global seafreight forwarding market 2018 - 2022 ($ billion)
    • 4.2 End User Segment Analysis 2018 - 2022
      • Exhibit 19: Historic Market Size – End User Segment 2018 - 2022 ($ billion)
    • 4.3 Type Segment Analysis 2018 - 2022
      • Exhibit 20: Historic Market Size – Type Segment 2018 - 2022 ($ billion)
    • 4.4 Geography Segment Analysis 2018 - 2022
      • Exhibit 21: Historic Market Size – Geography Segment 2018 - 2022 ($ billion)
    • 4.5 Country Segment Analysis 2018 - 2022
      • Exhibit 22: Historic Market Size – Country Segment 2018 - 2022 ($ billion)

    5 Five Forces Analysis

    • 5.1 Five forces summary
      • Exhibit 23: Five forces analysis - Comparison between 2023 and 2028
    • 5.2 Bargaining power of buyers
      • Exhibit 24: Chart on Bargaining power of buyers – Impact of key factors 2023 and 2028
    • 5.3 Bargaining power of suppliers
      • Exhibit 25: Bargaining power of suppliers – Impact of key factors in 2023 and 2028
    • 5.4 Threat of new entrants
      • Exhibit 26: Threat of new entrants – Impact of key factors in 2023 and 2028
    • 5.5 Threat of substitutes
      • Exhibit 27: Threat of substitutes – Impact of key factors in 2023 and 2028
    • 5.6 Threat of rivalry
      • Exhibit 28: Threat of rivalry – Impact of key factors in 2023 and 2028
    • 5.7 Market condition
      • Exhibit 29: Chart on Market condition - Five forces 2023 and 2028

    6 Market Segmentation by End-user

    • 6.1 Market segments
      • Exhibit 30: Chart on End-user - Market share 2023-2028 (%)
      • Exhibit 31: Data Table on End-user - Market share 2023-2028 (%)
    • 6.2 Comparison by End-user
      • Exhibit 32: Chart on Comparison by End-user
      • Exhibit 33: Data Table on Comparison by End-user
    • 6.3 Manufacturing - Market size and forecast 2023-2028
      • Exhibit 34: Chart on Manufacturing - Market size and forecast 2023-2028 ($ billion)
      • Exhibit 35: Data Table on Manufacturing - Market size and forecast 2023-2028 ($ billion)
      • Exhibit 36: Chart on Manufacturing - Year-over-year growth 2023-2028 (%)
      • Exhibit 37: Data Table on Manufacturing - Year-over-year growth 2023-2028 (%)
    • 6.4 Retail and consumer goods - Market size and forecast 2023-2028
      • Exhibit 38: Chart on Retail and consumer goods - Market size and forecast 2023-2028 ($ billion)
      • Exhibit 39: Data Table on Retail and consumer goods - Market size and forecast 2023-2028 ($ billion)
      • Exhibit 40: Chart on Retail and consumer goods - Year-over-year growth 2023-2028 (%)
      • Exhibit 41: Data Table on Retail and consumer goods - Year-over-year growth 2023-2028 (%)
    • 6.5 Healthcare - Market size and forecast 2023-2028
      • Exhibit 42: Chart on Healthcare - Market size and forecast 2023-2028 ($ billion)
      • Exhibit 43: Data Table on Healthcare - Market size and forecast 2023-2028 ($ billion)
      • Exhibit 44: Chart on Healthcare - Year-over-year growth 2023-2028 (%)
      • Exhibit 45: Data Table on Healthcare - Year-over-year growth 2023-2028 (%)
    • 6.6 Others - Market size and forecast 2023-2028
      • Exhibit 46: Chart on Others - Market size and forecast 2023-2028 ($ billion)
      • Exhibit 47: Data Table on Others - Market size and forecast 2023-2028 ($ billion)
      • Exhibit 48: Chart on Others - Year-over-year growth 2023-2028 (%)
      • Exhibit 49: Data Table on Others - Year-over-year growth 2023-2028 (%)
    • 6.7 Market opportunity by End-user
      • Exhibit 50: Market opportunity by End-user ($ billion)
      • Exhibit 51: Data Table on Market opportunity by End-user ($ billion)

    7 Market Segmentation by Type

    • 7.1 Market segments
      • Exhibit 52: Chart on Type - Market share 2023-2028 (%)
      • Exhibit 53: Data Table on Type - Market share 2023-2028 (%)
    • 7.2 Comparison by Type
      • Exhibit 54: Chart on Comparison by Type
      • Exhibit 55: Data Table on Comparison by Type
    • 7.3 Full container load - Market size and forecast 2023-2028
      • Exhibit 56: Chart on Full container load - Market size and forecast 2023-2028 ($ billion)
      • Exhibit 57: Data Table on Full container load - Market size and forecast 2023-2028 ($ billion)
      • Exhibit 58: Chart on Full container load - Year-over-year growth 2023-2028 (%)
      • Exhibit 59: Data Table on Full container load - Year-over-year growth 2023-2028 (%)
    • 7.4 Less-than container load - Market size and forecast 2023-2028
      • Exhibit 60: Chart on Less-than container load - Market size and forecast 2023-2028 ($ billion)
      • Exhibit 61: Data Table on Less-than container load - Market size and forecast 2023-2028 ($ billion)
      • Exhibit 62: Chart on Less-than container load - Year-over-year growth 2023-2028 (%)
      • Exhibit 63: Data Table on Less-than container load - Year-over-year growth 2023-2028 (%)
    • 7.5 Market opportunity by Type
      • Exhibit 64: Market opportunity by Type ($ billion)
      • Exhibit 65: Data Table on Market opportunity by Type ($ billion)

    8 Customer Landscape

    • 8.1 Customer landscape overview
      • Exhibit 66: Analysis of price sensitivity, lifecycle, customer purchase basket, adoption rates, and purchase criteria

    9 Geographic Landscape

    • 9.1 Geographic segmentation
      • Exhibit 67: Chart on Market share by geography 2023-2028 (%)
      • Exhibit 68: Data Table on Market share by geography 2023-2028 (%)
    • 9.2 Geographic comparison
      • Exhibit 69: Chart on Geographic comparison
      • Exhibit 70: Data Table on Geographic comparison
    • 9.3 North America - Market size and forecast 2023-2028
      • Exhibit 71: Chart on North America - Market size and forecast 2023-2028 ($ billion)
      • Exhibit 72: Data Table on North America - Market size and forecast 2023-2028 ($ billion)
      • Exhibit 73: Chart on North America - Year-over-year growth 2023-2028 (%)
      • Exhibit 74: Data Table on North America - Year-over-year growth 2023-2028 (%)
    • 9.4 APAC - Market size and forecast 2023-2028
      • Exhibit 75: Chart on APAC - Market size and forecast 2023-2028 ($ billion)
      • Exhibit 76: Data Table on APAC - Market size and forecast 2023-2028 ($ billion)
      • Exhibit 77: Chart on APAC - Year-over-year growth 2023-2028 (%)
      • Exhibit 78: Data Table on APAC - Year-over-year growth 2023-2028 (%)
    • 9.5 Europe - Market size and forecast 2023-2028
      • Exhibit 79: Chart on Europe - Market size and forecast 2023-2028 ($ billion)
      • Exhibit 80: Data Table on Europe - Market size and forecast 2023-2028 ($ billion)
      • Exhibit 81: Chart on Europe - Year-over-year growth 2023-2028 (%)
      • Exhibit 82: Data Table on Europe - Year-over-year growth 2023-2028 (%)
    • 9.6 Middle East and Africa - Market size and forecast 2023-2028
      • Exhibit 83: Chart on Middle East and Africa - Market size and forecast 2023-2028 ($ billion)
      • Exhibit 84: Data Table on Middle East and Africa - Market size and forecast 2023-2028 ($ billion)
      • Exhibit 85: Chart on Middle East and Africa - Year-over-year growth 2023-2028 (%)
      • Exhibit 86: Data Table on Middle East and Africa - Year-over-year growth 2023-2028 (%)
    • 9.7 South America - Market size and forecast 2023-2028
      • Exhibit 87: Chart on South America - Market size and forecast 2023-2028 ($ billion)
      • Exhibit 88: Data Table on South America - Market size and forecast 2023-2028 ($ billion)
      • Exhibit 89: Chart on South America - Year-over-year growth 2023-2028 (%)
      • Exhibit 90: Data Table on South America - Year-over-year growth 2023-2028 (%)
    • 9.8 US - Market size and forecast 2023-2028
      • Exhibit 91: Chart on US - Market size and forecast 2023-2028 ($ billion)
      • Exhibit 92: Data Table on US - Market size and forecast 2023-2028 ($ billion)
      • Exhibit 93: Chart on US - Year-over-year growth 2023-2028 (%)
      • Exhibit 94: Data Table on US - Year-over-year growth 2023-2028 (%)
    • 9.9 China - Market size and forecast 2023-2028
      • Exhibit 95: Chart on China - Market size and forecast 2023-2028 ($ billion)
      • Exhibit 96: Data Table on China - Market size and forecast 2023-2028 ($ billion)
      • Exhibit 97: Chart on China - Year-over-year growth 2023-2028 (%)
      • Exhibit 98: Data Table on China - Year-over-year growth 2023-2028 (%)
    • 9.10 Germany - Market size and forecast 2023-2028
      • Exhibit 99: Chart on Germany - Market size and forecast 2023-2028 ($ billion)
      • Exhibit 100: Data Table on Germany - Market size and forecast 2023-2028 ($ billion)
      • Exhibit 101: Chart on Germany - Year-over-year growth 2023-2028 (%)
      • Exhibit 102: Data Table on Germany - Year-over-year growth 2023-2028 (%)
    • 9.11 France - Market size and forecast 2023-2028
      • Exhibit 103: Chart on France - Market size and forecast 2023-2028 ($ billion)
      • Exhibit 104: Data Table on France - Market size and forecast 2023-2028 ($ billion)
      • Exhibit 105: Chart on France - Year-over-year growth 2023-2028 (%)
      • Exhibit 106: Data Table on France - Year-over-year growth 2023-2028 (%)
    • 9.12 Japan - Market size and forecast 2023-2028
      • Exhibit 107: Chart on Japan - Market size and forecast 2023-2028 ($ billion)
      • Exhibit 108: Data Table on Japan - Market size and forecast 2023-2028 ($ billion)
      • Exhibit 109: Chart on Japan - Year-over-year growth 2023-2028 (%)
      • Exhibit 110: Data Table on Japan - Year-over-year growth 2023-2028 (%)
    • 9.13 Market opportunity by geography
      • Exhibit 111: Market opportunity by geography ($ billion)
      • Exhibit 112: Data Tables on Market opportunity by geography ($ billion)

    10 Drivers, Challenges, and Trends

    • 10.1 Market drivers
      • 10.2 Market challenges
        • 10.3 Impact of drivers and challenges
          • Exhibit 113: Impact of drivers and challenges in 2023 and 2028
        • 10.4 Market trends

          11 Vendor Landscape

          • 11.1 Overview
            • 11.2 Vendor landscape
              • Exhibit 114: Overview on Criticality of inputs and Factors of differentiation
            • 11.3 Landscape disruption
              • Exhibit 115: Overview on factors of disruption
            • 11.4 Industry risks
              • Exhibit 116: Impact of key risks on business

            12 Vendor Analysis

            • 12.1 Vendors covered
              • Exhibit 117: Vendors covered
            • 12.2 Market positioning of vendors
              • Exhibit 118: Matrix on vendor position and classification
            • 12.3 Agility Public Warehousing Co. K.S.C.P
              • Exhibit 119: Agility Public Warehousing Co. K.S.C.P - Overview
              • Exhibit 120: Agility Public Warehousing Co. K.S.C.P - Business segments
              • Exhibit 121: Agility Public Warehousing Co. K.S.C.P - Key news
              • Exhibit 122: Agility Public Warehousing Co. K.S.C.P - Key offerings
              • Exhibit 123: Agility Public Warehousing Co. K.S.C.P - Segment focus
            • 12.4 AP Moller Maersk AS
              • Exhibit 124: AP Moller Maersk AS - Overview
              • Exhibit 125: AP Moller Maersk AS - Business segments
              • Exhibit 126: AP Moller Maersk AS - Key news
              • Exhibit 127: AP Moller Maersk AS - Key offerings
              • Exhibit 128: AP Moller Maersk AS - Segment focus
            • 12.5 Bollore SE
              • Exhibit 129: Bollore SE - Overview
              • Exhibit 130: Bollore SE - Business segments
              • Exhibit 131: Bollore SE - Key offerings
              • Exhibit 132: Bollore SE - Segment focus
            • 12.6 C H Robinson Worldwide Inc.
              • Exhibit 133: C H Robinson Worldwide Inc. - Overview
              • Exhibit 134: C H Robinson Worldwide Inc. - Business segments
              • Exhibit 135: C H Robinson Worldwide Inc. - Key news
              • Exhibit 136: C H Robinson Worldwide Inc. - Key offerings
              • Exhibit 137: C H Robinson Worldwide Inc. - Segment focus
            • 12.7 CEVA Logistics S A
              • Exhibit 138: CEVA Logistics S A - Overview
              • Exhibit 139: CEVA Logistics S A - Business segments
              • Exhibit 140: CEVA Logistics S A - Key news
              • Exhibit 141: CEVA Logistics S A - Key offerings
              • Exhibit 142: CEVA Logistics S A - Segment focus
            • 12.8 DB Schenker
              • Exhibit 143: DB Schenker - Overview
              • Exhibit 144: DB Schenker - Business segments
              • Exhibit 145: DB Schenker - Key offerings
              • Exhibit 146: DB Schenker - Segment focus
            • 12.9 Deutsche Post AG
              • Exhibit 147: Deutsche Post AG - Overview
              • Exhibit 148: Deutsche Post AG - Product / Service
              • Exhibit 149: Deutsche Post AG - Key news
              • Exhibit 150: Deutsche Post AG - Key offerings
            • 12.10 DSV AS
              • Exhibit 151: DSV AS - Overview
              • Exhibit 152: DSV AS - Business segments
              • Exhibit 153: DSV AS - Key offerings
              • Exhibit 154: DSV AS - Segment focus
            • 12.11 Expeditors International of Washington Inc.
              • Exhibit 155: Expeditors International of Washington Inc. - Overview
              • Exhibit 156: Expeditors International of Washington Inc. - Business segments
              • Exhibit 157: Expeditors International of Washington Inc. - Key offerings
              • Exhibit 158: Expeditors International of Washington Inc. - Segment focus
            • 12.12 GEODIS
              • Exhibit 159: GEODIS - Overview
              • Exhibit 160: GEODIS - Product / Service
              • Exhibit 161: GEODIS - Key offerings
            • 12.13 Kuehne Nagel Management AG
              • Exhibit 162: Kuehne Nagel Management AG - Overview
              • Exhibit 163: Kuehne Nagel Management AG - Business segments
              • Exhibit 164: Kuehne Nagel Management AG - Key offerings
              • Exhibit 165: Kuehne Nagel Management AG - Segment focus
            • 12.14 Nippon Yusen Kabushiki Kaisha
              • Exhibit 166: Nippon Yusen Kabushiki Kaisha - Overview
              • Exhibit 167: Nippon Yusen Kabushiki Kaisha - Business segments
              • Exhibit 168: Nippon Yusen Kabushiki Kaisha - Key offerings
              • Exhibit 169: Nippon Yusen Kabushiki Kaisha - Segment focus
            • 12.15 SF Express Co. Ltd.
              • Exhibit 170: SF Express Co. Ltd. - Overview
              • Exhibit 171: SF Express Co. Ltd. - Business segments
              • Exhibit 172: SF Express Co. Ltd. - Key offerings
              • Exhibit 173: SF Express Co. Ltd. - Segment focus
            • 12.16 Sinotrans Ltd.
              • Exhibit 174: Sinotrans Ltd. - Overview
              • Exhibit 175: Sinotrans Ltd. - Business segments
              • Exhibit 176: Sinotrans Ltd. - Key offerings
              • Exhibit 177: Sinotrans Ltd. - Segment focus
            • 12.17 Total Group
              • Exhibit 178: Total Group - Overview
              • Exhibit 179: Total Group - Key offerings
            • 12.18 United Parcel Service Inc.
              • Exhibit 180: United Parcel Service Inc. - Overview
              • Exhibit 181: United Parcel Service Inc. - Business segments
              • Exhibit 182: United Parcel Service Inc. - Key offerings
              • Exhibit 183: United Parcel Service Inc. - Segment focus

            13 Appendix

            • 13.1 Scope of the report
              • 13.2 Inclusions and exclusions checklist
                • Exhibit 184: Inclusions checklist
                • Exhibit 185: Exclusions checklist
              • 13.3 Currency conversion rates for US$
                • Exhibit 186: Currency conversion rates for US$
              • 13.4 Research methodology
                • Exhibit 187: Research methodology
                • Exhibit 188: Validation techniques employed for market sizing
                • Exhibit 189: Information sources
              • 13.5 List of abbreviations
                • Exhibit 190: List of abbreviations

              Research Methodology

              Technavio presents a detailed picture of the market by way of study, synthesis, and summation of data from multiple sources. The analysts have presented the various facets of the market with a particular focus on identifying the key industry influencers. The data thus presented is comprehensive, reliable, and the result of extensive research, both primary and secondary.

              INFORMATION SOURCES

              Primary sources

              • Manufacturers and suppliers
              • Channel partners
              • Industry experts
              • Strategic decision makers

              Secondary sources

              • Industry journals and periodicals
              • Government data
              • Financial reports of key industry players
              • Historical data
              • Press releases

              DATA ANALYSIS

              Data Synthesis

              • Collation of data
              • Estimation of key figures
              • Analysis of derived insights

              Data Validation

              • Triangulation with data models
              • Reference against proprietary databases
              • Corroboration with industry experts

              REPORT WRITING

              Qualitative

              • Market drivers
              • Market challenges
              • Market trends
              • Five forces analysis

              Quantitative

              • Market size and forecast
              • Market segmentation
              • Geographical insights
              • Competitive landscape

              Interested in this report?

              Get your sample now to see our research methodology and insights!

              Download Now

              Frequently Asked Questions

              Seafreight Forwarding market growth will increase by $ 21.6 bn during 2024-2028.

              The Seafreight Forwarding market is expected to grow at a CAGR of 5.29% during 2024-2028.

              Seafreight Forwarding market is segmented by End-user( Manufacturing, Retail and consumer goods, Healthcare, Others) Type( Full container load, Less-than container load, North America, South America, MEA)

              Agility Public Warehousing Co. K.S.C.P, AP Moller Maersk AS, Bollore SE, C H Robinson Worldwide Inc., CEVA Logistics S A, DACHSER SE, DB Schenker, Deutsche Post AG, DSV AS, Expeditors International of Washington Inc., GEODIS, Glaube Logistics, Hellmann Worldwide Logistics SE and Co KG, Hitachi Ltd., Inchcape Shipping Services, Kuehne Nagel Management AG, LX Pantos India Pvt Ltd., Mullen Group, Nippon Express Holdings Inc., Nippon Yusen Kabushiki Kaisha, SF Express Co. Ltd., Total Group, United Parcel Service Inc., Sinotrans Ltd. are a few of the key vendors in the Seafreight Forwarding market.

              North America will register the highest growth rate of 38% among the other regions. Therefore, the Seafreight Forwarding market in North America is expected to garner significant business opportunities for the vendors during the forecast period.

              US, China, Japan, Germany, France

              • Growing global cross-border e-commerce market driving LCL volumeThe growing Internet penetration and rising purchasing power parity (PPP) across all regions are the key contributing factors to the growth of the global cross-border e-commerce industry. The US and China are the key contributing countries to the global cross-border e-commerce industry. This growth in cross-border e-commerce trade is expected to positively influence the volume of sea freight worldwide. The LCL seafreight shipments are propelled by the rise in the number of small package shipments. Vendors are also planning to expand their service portfolio to cross-border e-commerce is the driving factor this market.
              • which will further increase the volume of LCL. For instance is the driving factor this market.
              • in April 2022 is the driving factor this market.
              • DACHSER announced the expansion of its LCL network in seafreight service from Scandinavia and China.   Sea transportation is emerging as a preferred mode for e-commerce due to the developments in infrastructure and services designed specifically for the e-commerce industry. For instance is the driving factor this market.
              • in June 2022 is the driving factor this market.
              •  Maersk announced the acquisition of Senator International for cross-border logistics to Maersks North American landside logistics capabilities for different distribution models is the driving factor this market.
              • such as business-to-business (B2B) and business-to-consumer (B2C) . Therefore is the driving factor this market.
              • the growing demand for global cross-border e-commerce services is driving the growth of the global seafreight forwarding market during the forecast period. is the driving factor this market.

              The Seafreight Forwarding market vendors should focus on grabbing business opportunities from the Manufacturing segment as it accounted for the largest market share in the base year.