Ready To Drink (RTD) Alcoholic Beverages Market Analysis, Size, and Forecast 2025-2029: North America (US and Canada), Europe (France, Germany, Italy, and UK), APAC (Australia, China, India, and Japan), and Rest of World (ROW)

Ready To Drink (RTD) Alcoholic Beverages Market Analysis, Size, and Forecast 2025-2029:
North America (US and Canada), Europe (France, Germany, Italy, and UK), APAC (Australia, China, India, and Japan), and Rest of World (ROW)

Published: Jul 2025 210 Pages SKU: IRTNTR75287

Market Overview at a Glance

$8.46 B
Market Opportunity
5.6%
CAGR
5.2
YoY growth 2024-2025(%)

Ready To Drink Alcoholic Beverages Market Size 2025-2029

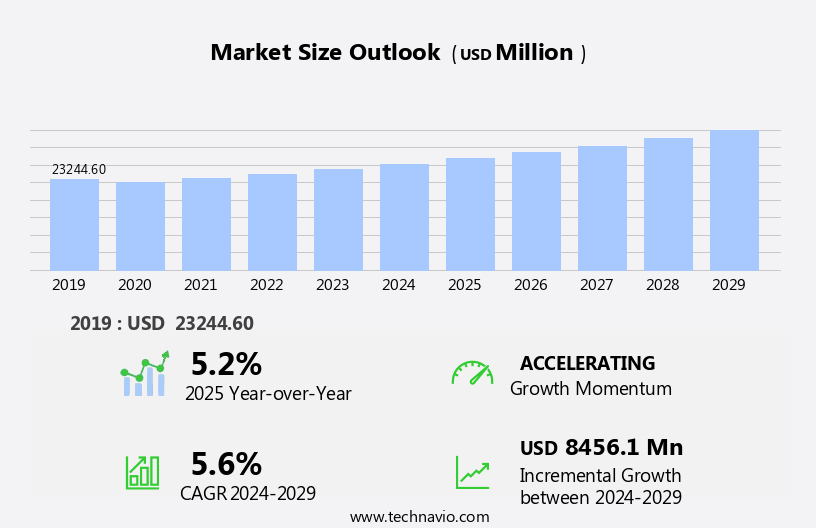
The ready to drink (RTD) alcoholic beverages market size is forecast to increase by USD 8.46 billion at a CAGR of 5.6% between 2024 and 2029.

  • The market is experiencing significant growth, driven by the increasing demand for convenience and the rising popularity of pre-mixes. Consumers are increasingly seeking on-the-go solutions for their alcoholic beverage needs, leading to a rise in demand for RTD beverages. Additionally, the growing trend towards craft and artisanal beverages is fueling innovation in the RTD market, as producers seek to differentiate themselves with unique flavors and high-quality ingredients. Ready-to-drink tea and coffee, sparkling water, and dairy-free milk alternatives are popular choices.
  • These challenges can impact the production and distribution of RTD beverages, potentially leading to price volatility and inventory management issues for manufacturers. Sports nutrition companies have also embraced bottles for their sports drinks. Companies must navigate these challenges effectively to capitalize on the market's growth potential and maintain their competitive edge. To succeed in this dynamic market, they must focus on supply chain resilience, innovation, and agility. The alcoholic beverages industry is experiencing supply chain disruptions due to various factors, including raw material availability, logistical issues, and regulatory hurdles.

What will be the Size of the Ready To Drink (RTD) Alcoholic Beverages Market during the forecast period?

Ready To Drink (RTD) Alcoholic Beverages Market Size

 Explore in-depth regional segment analysis with market size data - historical 2019-2023 and forecasts 2025-2029 - in the full report.  
Request Free Sample

The ready-to-drink (RTD) alcoholic beverages market is witnessing significant activity and trends, driven by advancements in technology and consumer preferences. Aroma compounds and flavor preservation techniques are essential for maintaining sensory quality, while cocktail mix technology ensures consistency and customer satisfaction. Microbial stability and packaging design are critical for product safety and environmental sustainability. Fizziness control and process optimization are key to economic viability, as RTD spirits, hard seltzer manufacturing, and canned cocktail innovation gain popularity. Sweetener selection and brand positioning are crucial elements of innovation strategy, as companies strive for competitive advantage.

Product lifecycle management, alcohol by volume, and promotion strategies are essential for effective business models. Regulatory compliance, color stability, and social responsibility are vital considerations for supply chain risk and ingredient quality. Supply chain efficiency and regulatory adherence are essential for market success. Bottles, including beverage cans or plastic containers are also used for RTD cocktails and premixed drinks, and the market is expected to grow in the timeframe of social gatherings and stay-at-home occasions.

How is this Ready To Drink (RTD) Alcoholic Beverages Industry segmented?

The ready to drink (RTD) alcoholic beverages industry research report provides comprehensive data (region-wise segment analysis), with forecasts and estimates in "USD million" for the period 2025-2029, as well as historical data from 2019-2023 for the following segments.

  • Distribution Channel
    • Off-trade
    • On-trade
  • Packaging
    • Bottles
    • Cans
    • Others
  • Type
    • Hard seltzers
    • Canned cocktails
    • Flavored malt beverages
    • Hard ciders
    • Hard kombucha
  • Geography
    • North America
      • US
      • Canada
    • Europe
      • France
      • Germany
      • Italy
      • UK
    • APAC
      • Australia
      • China
      • India
      • Japan
    • Rest of World (ROW)

By Distribution Channel Insights

The Off-trade segment is estimated to witness significant growth during the forecast period. In the dynamic RTD alcoholic beverage market, the off-trade distribution channel, comprising retail outlets, liquor stores, supermarkets, and online retailers, is experiencing substantial expansion. This growth can be attributed to the convenience factor, evolving consumer preferences, and the rise of e-commerce platforms. The popularity of RTD alcoholic beverages, including premixed cocktails, canned wines, and flavored alcoholic beverages, is on the rise due to their portability and ease of use. To cater to these consumer demands, the off-trade channel offers a diverse range of options. Beverage carbonation methods ensure product fizz and prolonged shelf life, while alcoholic beverage production employs distillation techniques and fermentation processes. This trend is particularly noticeable in the energy drinks and RTDs category, where global consumers are increasingly opting for healthier alternatives, including dairy-based beverages, particularly in emerging economies.

Quality control procedures, risk management, and packaging material selection are crucial for maintaining product consistency and safety. Natural flavor compounds add taste appeal, while alcohol tax regulations and supply chain management ensure efficient ingredient sourcing. Wastewater treatment, sugar content reduction, and energy consumption reduction are essential for sustainability. Filtration and clarification processes enhance product clarity, and carbon footprint assessment and recycling programs promote eco-friendliness. Product labeling regulations ensure transparency, and pricing strategies cater to various customer segments. Brand loyalty is fostered through marketing campaign effectiveness and sales forecasting, while profit margins are optimized through bottling line efficiency and product diversification strategies. RTD options, such as cold brew coffee, energy drinks, and flavored waters, have rised in popularity due to their convenience and sophistication.

Ready To Drink (RTD) Alcoholic Beverages Market Size

 Download Free Sample Report

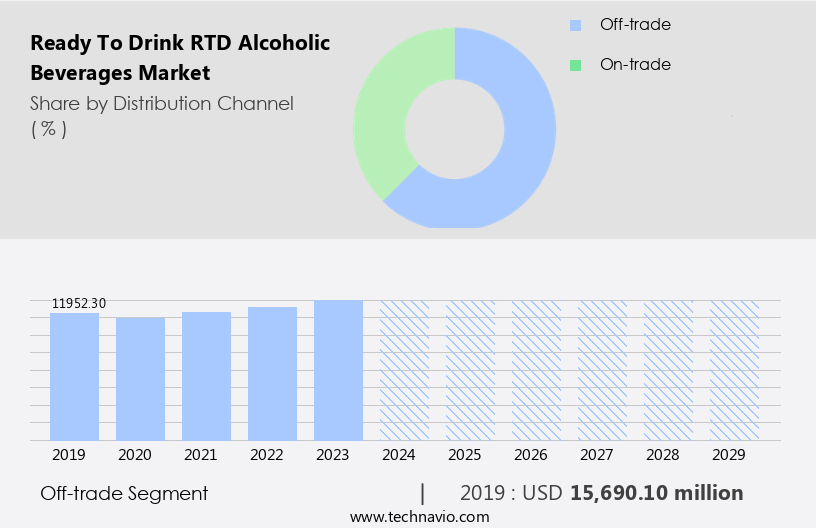
The Off-trade segment was valued at USD 15.69 billion in 2019 and showed a gradual increase during the forecast period.

The Ready-To-Drink (RTD) Alcoholic Beverages Market is experiencing accelerated growth, fueled by shifting consumer preferences and strategic customer segmentation. Brands are leveraging sensory evaluation techniques to fine-tune flavor profiles and enhance product appeal across diverse demographics. Innovations in the alcohol fermentation process enable smoother, more consistent production, contributing to substantial cost reduction. Companies are reimagining their business model to incorporate direct-to-consumer channels, premiumization strategies, and sustainable packaging. Within the spirits category, readytodrink spirits like canned cocktails and spirit-infused seltzers are dominating shelf space with convenience-driven appeal.

Competitor analysis and taste stability testing help companies stay competitive. The off-trade distribution channel's growth in the RTD alcoholic beverage market is driven by consumer preferences, convenience, and e-commerce trends. Companies must focus on product innovation, sustainability, and regulatory compliance to cater to evolving consumer demands and maintain market competitiveness. Health and wellness trends have led to the growth of plant-based beverages, energy drinks, and ph-balanced options. 

Regional Analysis

North America is estimated to contribute 34% to the growth of the global market during the forecast period. Technavio's analysts have elaborately explained the regional trends and drivers that shape the market during the forecast period.

Ready To Drink (RTD) Alcoholic Beverages Market Share by Geography

View Free PDF Sample

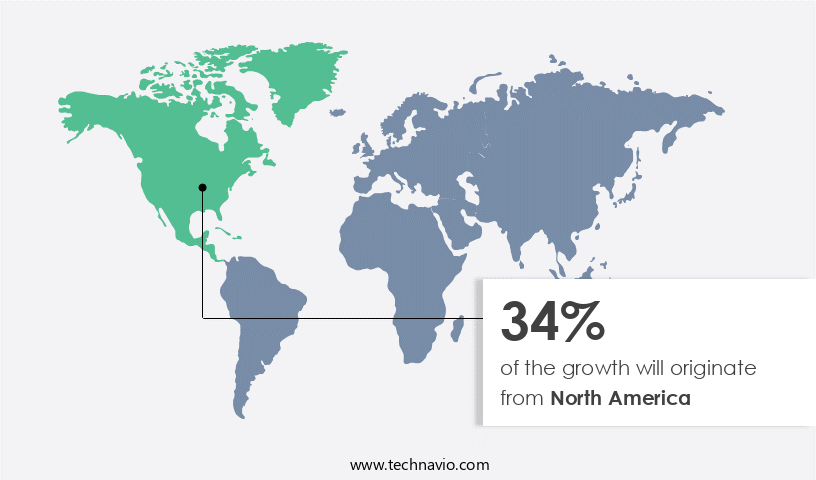
The ready-to-drink (RTD) alcoholic beverages market in North America is witnessing steady growth, with the US being a significant contributor. Consumers' shifting preferences towards craft beer, which is pricier than lager, fuels this expansion. Lifestyle changes, novel flavors and product diversification, and the rise of microbreweries, distilleries, and wineries catering to the millennial demographic are key growth drivers. However, the nearly static demand for traditional beer may pose a challenge to the market's progression. This is primarily due to beer's dominance as the leading alcoholic beverage category in most countries. In response to evolving consumer preferences, manufacturers employ various techniques such as beverage carbonation methods, shelf-life extension, and RTD can manufacturing.

Alcoholic beverage production adheres to stringent quality control procedures and risk management strategies. Packaging material selection prioritizes sustainability and recyclability, while natural flavor compounds add to the product's appeal. Alcohol tax regulations are closely monitored in the supply chain, and ingredient sourcing strategies prioritize local and ethical suppliers. Wastewater treatment and sugar content reduction are essential considerations for environmental sustainability. Filtration and clarification techniques ensure taste stability, while energy consumption reduction and carbon footprint assessment contribute to cost savings and eco-friendliness. Recycling programs and product labeling regulations are essential for consumer trust and compliance. Distillation techniques and alcohol fermentation processes are optimized for efficiency and consistency.

Competitor analysis, sales data analysis, and return on investment calculations guide pricing strategies and product diversification. Bottling line efficiency, consumer preference trends, marketing campaign effectiveness, sales forecasting, profit margins, and brand loyalty are crucial factors shaping the market landscape. However, the RTD alcoholic beverages market faces several challenges.

Market Dynamics

Our researchers analyzed the data with 2024 as the base year, along with the key drivers, trends, and challenges. A holistic analysis of drivers will help companies refine their marketing strategies to gain a competitive advantage.

What are the Ready To Drink (RTD) Alcoholic Beverages market drivers leading to the rise in the adoption of Industry?

  • The significant rise in demand for ready-to-drink (RTD) pre-mixes serves as the primary catalyst for market growth. The ready-to-drink (RTD) alcoholic beverages market is experiencing significant growth due to increasing consumer preferences for convenience and healthier choices. Regulations regarding alcohol taxation and supply chain management are crucial factors influencing market dynamics. Innovative ingredient sourcing strategies and wastewater treatment methods are essential for manufacturers to ensure product quality and sustainability.
  • Recycling programs are also a priority for companies to minimize environmental impact and cater to eco-conscious consumers. The market is witnessing an influx of new and exotic spirit-based RTD cocktails, appealing to consumers seeking premium, bar-quality experiences in a convenient format. These trends are expected to continue driving the growth of the RTD alcoholic beverages sector. Additionally, there is a growing focus on reducing sugar content, energy consumption, and carbon footprint assessments. Filtration and clarification techniques are employed to enhance the beverage's appearance and taste.

What are the Ready To Drink (RTD) Alcoholic Beverages market trends shaping the Industry?

  • The increasing preference for craft and artisanal beverages represents a significant market trend. This trend reflects consumers' growing appreciation for unique, high-quality beverage options. The market showcases a growing trend towards distinctive and premium options, characterized by unique flavors and high-quality ingredients. These beverages, often produced in small batches using artisanal spirits, organic produce, specialty botanicals, and unique spices, cater to consumers seeking a more upscale drinking experience. Product labeling regulations play a crucial role in this market, ensuring transparency and authenticity.
  • The focus on reliability and origin association drives the market, with craft and artisanal RTD alcoholic beverages commanding a premium price point. Distillation techniques and alcohol fermentation processes are meticulously refined to preserve taste stability. Distribution network optimization and sales data analysis are essential for maximizing return on investment. Competitor analysis and flavor profile optimization are critical components of marketing strategies, as companies aim to differentiate their offerings and cater to evolving consumer preferences.

How does Ready To Drink (RTD) Alcoholic Beverages market faces challenges during its growth?

  • Disruptions in the supply chain are creating significant growth challenges for the alcoholic beverages industry, impacting production timelines, distribution efficiency, and the availability of raw materials. The market presents complexities for manufacturers due to the dynamic nature of the industry. Alcohol content regulation, a critical factor, requires strict adherence to ensure consumer safety and regulatory compliance. Product diversification strategies are essential to cater to evolving consumer preference trends and maintain brand loyalty.
  • Delays or disruptions in the production process due to component shortages or delivery delays can impact sales and profitability. Pricing strategies are crucial to remain competitive and profitable, with bottling line efficiency a key consideration to minimize costs. Marketing campaign effectiveness and sales forecasting are vital to optimize revenue and profit margins. However, fluctuations in raw material prices, transportation expenses, and ingredient availability can pose challenges, potentially reducing profitability and necessitating flexible pricing strategies.

Exclusive Customer Landscape

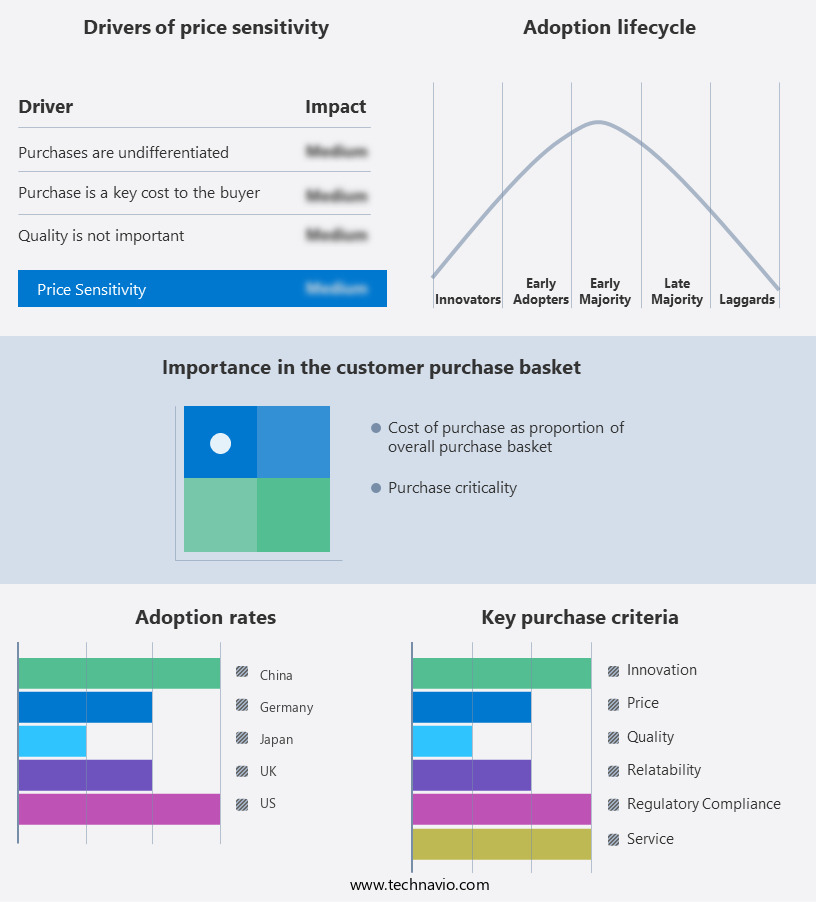
The ready to drink (RTD) alcoholic beverages market forecasting report includes the adoption lifecycle of the market, covering from the innovator's stage to the laggard's stage. It focuses on adoption rates in different regions based on penetration. Furthermore, the ready to drink (RTD) alcoholic beverages market report also includes key purchase criteria and drivers of price sensitivity to help companies evaluate and develop their market growth analysis strategies.

Ready To Drink (RTD) Alcoholic Beverages Market Share by Geography

 Customer Landscape

Key Companies & Market Insights

Companies are implementing various strategies, such as strategic alliances, ready to drink (RTD) alcoholic beverages market forecast, partnerships, mergers and acquisitions, geographical expansion, and product/service launches, to enhance their presence in the industry.

Accolade Wines Australia Ltd. - The company specializes in ready-to-drink (RTD) alcoholic beverages and offers its Yarra Burn brand, featuring Prosecco Spritz, Rose Spritz, Prosecco Spritz with orange bitters, and Cuvee Spritz.

The industry research and growth report includes detailed analyses of the competitive landscape of the market and information about key companies, including:

  • Accolade Wines Australia Ltd.
  • Anheuser Busch InBev SA NV
  • Asahi Group Holdings Ltd.
  • Bacardi and Co. Ltd.
  • Brown Forman Corp.
  • Campari Group
  • Carlsberg Breweries AS
  • Constellation Brands Inc.
  • Diageo PLC
  • Halewood International South Africa Pty Ltd.
  • Heaven Hill Distillery Inc.
  • Heineken NV
  • Manchester Drinks Ltd.
  • Mark Anthony Brands International Unlimited Co.
  • MIKES HARD LEMONADE Co.
  • Molson Coors Beverage Co.
  • Pernod Ricard SA
  • SHS Drinks
  • The Boston Beer Co. Inc.
  • United Brands LLC

Qualitative and quantitative analysis of companies has been conducted to help clients understand the wider business environment as well as the strengths and weaknesses of key industry players. Data is qualitatively analyzed to categorize companies as pure play, category-focused, industry-focused, and diversified; it is quantitatively analyzed to categorize companies as dominant, leading, strong, tentative, and weak.

Recent Development and News in Ready To Drink (RTD) Alcoholic Beverages Market

  • In January 2024, Diageo, a leading global beverage company, announced the launch of its new ready-to-drink (RTD) tequila product, "Smirnoff Tequila Sour," in the United States (Diageo Press Release, 2024). This expansion aimed to capitalize on the growing popularity of tequila and RTD beverages in the US market.
  • In March 2024, PepsiCo and Anheuser-Busch InBev, two industry giants, entered into a strategic partnership to co-create and distribute RTD alcoholic beverages, combining PepsiCo's distribution network with Anheuser-Busch InBev's brewing expertise (Business Wire, 2024). This collaboration was expected to bring innovative and unique RTD alcoholic beverages to consumers.
  • In May 2024, Constellation Brands, a major player in the RTD alcoholic beverages market, announced a USD150 million investment in its Canadian facility to expand production capacity for its RTD beverages, including its popular Mark West Coolers and Corona Refresca lines (Constellation Brands Press Release, 2024). This investment aimed to meet the increasing demand for RTD beverages and solidify Constellation Brands' market position.
  • In February 2025, the European Union's European Commission approved the acquisition of the UK's Fever-Tree Drinks, a leading producer of premium mixers for alcoholic beverages, by Japan's Suntory Holdings (European Commission Press Release, 2025). This acquisition was expected to strengthen Suntory's position in the RTD market by adding Fever-Tree's high-end mixers to its portfolio.

Research Analyst Overview

The market continues to evolve, driven by dynamic market dynamics and shifting consumer preferences. Beverage carbonation methods and shelf-life extension techniques are crucial in maintaining product freshness and appeal. RTD can manufacturing involves intricate processes such as alcohol fermentation and distillation techniques, ensuring taste stability and regulatory compliance. Quality control procedures and risk management are integral to the production process, with packaging material selection playing a significant role in preserving product integrity. Natural flavor compounds are increasingly being utilized to cater to evolving taste preferences, while alcohol tax regulations necessitate careful supply chain management and ingredient sourcing strategies.

Wastewater treatment and sugar content reduction are key considerations in the production process, as are energy consumption reduction and carbon footprint assessment. Recycling programs and product labeling regulations are essential components of sustainable business practices. Distribution network optimization and sales data analysis are vital for maximizing return on investment, while competitor analysis and flavor profile optimization inform strategic product diversification and pricing strategies. Bottling line efficiency and consumer preference trends shape marketing campaign effectiveness and sales forecasting, ultimately impacting profit margins and brand loyalty.

Dive into Technavio's robust research methodology, blending expert interviews, extensive data synthesis, and validated models for unparalleled Ready To Drink (RTD) Alcoholic Beverages Market insights. See full methodology.

Market Scope

Report Coverage

Details

Page number

210

Base year

2024

Historic period

2019-2023

Forecast period

2025-2029

Growth momentum & CAGR

Accelerate at a CAGR of 5.6%

Market growth 2025-2029

USD 8.46 billion

Market structure

Fragmented

YoY growth 2024-2025(%)

5.2

Key countries

US, China, UK, Canada, Germany, Japan, France, India, Australia, and Italy

Competitive landscape

Leading Companies, Market Positioning of Companies, Competitive Strategies, and Industry Risks

Request Free Sample

What are the Key Data Covered in this Ready To Drink (RTD) Alcoholic Beverages Market Research and Growth Report?

  • CAGR of the Ready To Drink (RTD) Alcoholic Beverages industry during the forecast period
  • Detailed information on factors that will drive the growth and forecasting between 2025 and 2029
  • Precise estimation of the size of the market and its contribution of the industry in focus to the parent market
  • Accurate predictions about upcoming growth and trends and changes in consumer behaviour
  • Growth of the market across North America, Europe, APAC, South America, and Middle East and Africa
  • Thorough analysis of the market's competitive landscape and detailed information about companies
  • Comprehensive analysis of factors that will challenge the ready to drink (RTD) alcoholic beverages market growth of industry companies

We can help! Our analysts can customize this ready to drink (RTD) alcoholic beverages market research report to meet your requirements.

Get in touch

1 Executive Summary

  • 1.1 Market overview
    • Executive Summary - Chart on Market Overview
    • Executive Summary - Data Table on Market Overview
    • Executive Summary - Chart on Global Market Characteristics
    • Executive Summary - Chart on Market by Geography
    • Executive Summary - Chart on Market Segmentation by Distribution Channel
    • Executive Summary - Chart on Market Segmentation by Packaging
    • Executive Summary - Chart on Market Segmentation by Type
    • Executive Summary - Chart on Incremental Growth
    • Executive Summary - Data Table on Incremental Growth
    • Executive Summary - Chart on Company Market Positioning

2 Technavio Analysis

  • 2.1 Analysis of price sensitivity, lifecycle, customer purchase basket, adoption rates, and purchase criteria
    • Analysis of price sensitivity, lifecycle, customer purchase basket, adoption rates, and purchase criteria
  • 2.2 Criticality of inputs and Factors of differentiation
    • Overview on criticality of inputs and factors of differentiation
  • 2.3 Factors of disruption
    • Overview on factors of disruption
  • 2.4 Impact of drivers and challenges
    • Impact of drivers and challenges in 2024 and 2029

3 Market Landscape

  • 3.1 Market ecosystem
    • Parent Market
    • Data Table on - Parent Market
  • 3.2 Market characteristics
    • Market characteristics analysis
  • 3.3 Value chain analysis
    • Value chain analysis

4 Market Sizing

  • 4.1 Market definition
    • Offerings of companies included in the market definition
  • 4.2 Market segment analysis
    • Market segments
  • 4.3 Market size 2024
    • 4.4 Market outlook: Forecast for 2024-2029
      • Chart on Global - Market size and forecast 2024-2029 ($ million)
      • Data Table on Global - Market size and forecast 2024-2029 ($ million)
      • Chart on Global Market: Year-over-year growth 2024-2029 (%)
      • Data Table on Global Market: Year-over-year growth 2024-2029 (%)

    5 Historic Market Size

    • 5.1 Global Ready To Drink (RTD) Alcoholic Beverages Market 2019 - 2023
      • Historic Market Size - Data Table on Global Ready To Drink (RTD) Alcoholic Beverages Market 2019 - 2023 ($ million)
    • 5.2 Distribution Channel segment analysis 2019 - 2023
      • Historic Market Size - Distribution Channel Segment 2019 - 2023 ($ million)
    • 5.3 Packaging segment analysis 2019 - 2023
      • Historic Market Size - Packaging Segment 2019 - 2023 ($ million)
    • 5.4 Type segment analysis 2019 - 2023
      • Historic Market Size - Type Segment 2019 - 2023 ($ million)
    • 5.5 Geography segment analysis 2019 - 2023
      • Historic Market Size - Geography Segment 2019 - 2023 ($ million)
    • 5.6 Country segment analysis 2019 - 2023
      • Historic Market Size - Country Segment 2019 - 2023 ($ million)

    6 Qualitative Analysis

    • 6.1 The AI impact on Global Ready to Drink (RTD) Alcoholic Beverages Market

      7 Five Forces Analysis

      • 7.1 Five forces summary
        • Five forces analysis - Comparison between 2024 and 2029
      • 7.2 Bargaining power of buyers
        • Bargaining power of buyers - Impact of key factors 2024 and 2029
      • 7.3 Bargaining power of suppliers
        • Bargaining power of suppliers - Impact of key factors in 2024 and 2029
      • 7.4 Threat of new entrants
        • Threat of new entrants - Impact of key factors in 2024 and 2029
      • 7.5 Threat of substitutes
        • Threat of substitutes - Impact of key factors in 2024 and 2029
      • 7.6 Threat of rivalry
        • Threat of rivalry - Impact of key factors in 2024 and 2029
      • 7.7 Market condition
        • Chart on Market condition - Five forces 2024 and 2029

      8 Market Segmentation by Distribution Channel

      • 8.1 Market segments
        • Chart on Distribution Channel - Market share 2024-2029 (%)
        • Data Table on Distribution Channel - Market share 2024-2029 (%)
      • 8.2 Comparison by Distribution Channel
        • Chart on Comparison by Distribution Channel
        • Data Table on Comparison by Distribution Channel
      • 8.3 Off-trade - Market size and forecast 2024-2029
        • Chart on Off-trade - Market size and forecast 2024-2029 ($ million)
        • Data Table on Off-trade - Market size and forecast 2024-2029 ($ million)
        • Chart on Off-trade - Year-over-year growth 2024-2029 (%)
        • Data Table on Off-trade - Year-over-year growth 2024-2029 (%)
      • 8.4 On-trade - Market size and forecast 2024-2029
        • Chart on On-trade - Market size and forecast 2024-2029 ($ million)
        • Data Table on On-trade - Market size and forecast 2024-2029 ($ million)
        • Chart on On-trade - Year-over-year growth 2024-2029 (%)
        • Data Table on On-trade - Year-over-year growth 2024-2029 (%)
      • 8.5 Market opportunity by Distribution Channel
        • Market opportunity by Distribution Channel ($ million)
        • Data Table on Market opportunity by Distribution Channel ($ million)

      9 Market Segmentation by Packaging

      • 9.1 Market segments
        • Chart on Packaging - Market share 2024-2029 (%)
        • Data Table on Packaging - Market share 2024-2029 (%)
      • 9.2 Comparison by Packaging
        • Chart on Comparison by Packaging
        • Data Table on Comparison by Packaging
      • 9.3 Bottles - Market size and forecast 2024-2029
        • Chart on Bottles - Market size and forecast 2024-2029 ($ million)
        • Data Table on Bottles - Market size and forecast 2024-2029 ($ million)
        • Chart on Bottles - Year-over-year growth 2024-2029 (%)
        • Data Table on Bottles - Year-over-year growth 2024-2029 (%)
      • 9.4 Cans - Market size and forecast 2024-2029
        • Chart on Cans - Market size and forecast 2024-2029 ($ million)
        • Data Table on Cans - Market size and forecast 2024-2029 ($ million)
        • Chart on Cans - Year-over-year growth 2024-2029 (%)
        • Data Table on Cans - Year-over-year growth 2024-2029 (%)
      • 9.5 Others - Market size and forecast 2024-2029
        • Chart on Others - Market size and forecast 2024-2029 ($ million)
        • Data Table on Others - Market size and forecast 2024-2029 ($ million)
        • Chart on Others - Year-over-year growth 2024-2029 (%)
        • Data Table on Others - Year-over-year growth 2024-2029 (%)
      • 9.6 Market opportunity by Packaging
        • Market opportunity by Packaging ($ million)
        • Data Table on Market opportunity by Packaging ($ million)

      10 Market Segmentation by Type

      • 10.1 Market segments
        • Chart on Type - Market share 2024-2029 (%)
        • Data Table on Type - Market share 2024-2029 (%)
      • 10.2 Comparison by Type
        • Chart on Comparison by Type
        • Data Table on Comparison by Type
      • 10.3 Hard seltzers - Market size and forecast 2024-2029
        • Chart on Hard seltzers - Market size and forecast 2024-2029 ($ million)
        • Data Table on Hard seltzers - Market size and forecast 2024-2029 ($ million)
        • Chart on Hard seltzers - Year-over-year growth 2024-2029 (%)
        • Data Table on Hard seltzers - Year-over-year growth 2024-2029 (%)
      • 10.4 Canned cocktails - Market size and forecast 2024-2029
        • Chart on Canned cocktails - Market size and forecast 2024-2029 ($ million)
        • Data Table on Canned cocktails - Market size and forecast 2024-2029 ($ million)
        • Chart on Canned cocktails - Year-over-year growth 2024-2029 (%)
        • Data Table on Canned cocktails - Year-over-year growth 2024-2029 (%)
      • 10.5 Flavored malt beverages - Market size and forecast 2024-2029
        • Chart on Flavored malt beverages - Market size and forecast 2024-2029 ($ million)
        • Data Table on Flavored malt beverages - Market size and forecast 2024-2029 ($ million)
        • Chart on Flavored malt beverages - Year-over-year growth 2024-2029 (%)
        • Data Table on Flavored malt beverages - Year-over-year growth 2024-2029 (%)
      • 10.6 Hard ciders - Market size and forecast 2024-2029
        • Chart on Hard ciders - Market size and forecast 2024-2029 ($ million)
        • Data Table on Hard ciders - Market size and forecast 2024-2029 ($ million)
        • Chart on Hard ciders - Year-over-year growth 2024-2029 (%)
        • Data Table on Hard ciders - Year-over-year growth 2024-2029 (%)
      • 10.7 Hard kombucha - Market size and forecast 2024-2029
        • Chart on Hard kombucha - Market size and forecast 2024-2029 ($ million)
        • Data Table on Hard kombucha - Market size and forecast 2024-2029 ($ million)
        • Chart on Hard kombucha - Year-over-year growth 2024-2029 (%)
        • Data Table on Hard kombucha - Year-over-year growth 2024-2029 (%)
      • 10.8 Market opportunity by Type
        • Market opportunity by Type ($ million)
        • Data Table on Market opportunity by Type ($ million)

      11 Customer Landscape

      • 11.1 Customer landscape overview
        • Analysis of price sensitivity, lifecycle, customer purchase basket, adoption rates, and purchase criteria

      12 Geographic Landscape

      • 12.1 Geographic segmentation
        • Chart on Market share by geography 2024-2029 (%)
        • Data Table on Market share by geography 2024-2029 (%)
      • 12.2 Geographic comparison
        • Chart on Geographic comparison
        • Data Table on Geographic comparison
      • 12.3 North America - Market size and forecast 2024-2029
        • Chart on North America - Market size and forecast 2024-2029 ($ million)
        • Data Table on North America - Market size and forecast 2024-2029 ($ million)
        • Chart on North America - Year-over-year growth 2024-2029 (%)
        • Data Table on North America - Year-over-year growth 2024-2029 (%)
      • 12.4 Europe - Market size and forecast 2024-2029
        • Chart on Europe - Market size and forecast 2024-2029 ($ million)
        • Data Table on Europe - Market size and forecast 2024-2029 ($ million)
        • Chart on Europe - Year-over-year growth 2024-2029 (%)
        • Data Table on Europe - Year-over-year growth 2024-2029 (%)
      • 12.5 APAC - Market size and forecast 2024-2029
        • Chart on APAC - Market size and forecast 2024-2029 ($ million)
        • Data Table on APAC - Market size and forecast 2024-2029 ($ million)
        • Chart on APAC - Year-over-year growth 2024-2029 (%)
        • Data Table on APAC - Year-over-year growth 2024-2029 (%)
      • 12.6 South America - Market size and forecast 2024-2029
        • Chart on South America - Market size and forecast 2024-2029 ($ million)
        • Data Table on South America - Market size and forecast 2024-2029 ($ million)
        • Chart on South America - Year-over-year growth 2024-2029 (%)
        • Data Table on South America - Year-over-year growth 2024-2029 (%)
      • 12.7 Middle East and Africa - Market size and forecast 2024-2029
        • Chart on Middle East and Africa - Market size and forecast 2024-2029 ($ million)
        • Data Table on Middle East and Africa - Market size and forecast 2024-2029 ($ million)
        • Chart on Middle East and Africa - Year-over-year growth 2024-2029 (%)
        • Data Table on Middle East and Africa - Year-over-year growth 2024-2029 (%)
      • 12.8 US - Market size and forecast 2024-2029
        • Chart on US - Market size and forecast 2024-2029 ($ million)
        • Data Table on US - Market size and forecast 2024-2029 ($ million)
        • Chart on US - Year-over-year growth 2024-2029 (%)
        • Data Table on US - Year-over-year growth 2024-2029 (%)
      • 12.9 China - Market size and forecast 2024-2029
        • Chart on China - Market size and forecast 2024-2029 ($ million)
        • Data Table on China - Market size and forecast 2024-2029 ($ million)
        • Chart on China - Year-over-year growth 2024-2029 (%)
        • Data Table on China - Year-over-year growth 2024-2029 (%)
      • 12.10 UK - Market size and forecast 2024-2029
        • Chart on UK - Market size and forecast 2024-2029 ($ million)
        • Data Table on UK - Market size and forecast 2024-2029 ($ million)
        • Chart on UK - Year-over-year growth 2024-2029 (%)
        • Data Table on UK - Year-over-year growth 2024-2029 (%)
      • 12.11 Canada - Market size and forecast 2024-2029
        • Chart on Canada - Market size and forecast 2024-2029 ($ million)
        • Data Table on Canada - Market size and forecast 2024-2029 ($ million)
        • Chart on Canada - Year-over-year growth 2024-2029 (%)
        • Data Table on Canada - Year-over-year growth 2024-2029 (%)
      • 12.12 Germany - Market size and forecast 2024-2029
        • Chart on Germany - Market size and forecast 2024-2029 ($ million)
        • Data Table on Germany - Market size and forecast 2024-2029 ($ million)
        • Chart on Germany - Year-over-year growth 2024-2029 (%)
        • Data Table on Germany - Year-over-year growth 2024-2029 (%)
      • 12.13 Japan - Market size and forecast 2024-2029
        • Chart on Japan - Market size and forecast 2024-2029 ($ million)
        • Data Table on Japan - Market size and forecast 2024-2029 ($ million)
        • Chart on Japan - Year-over-year growth 2024-2029 (%)
        • Data Table on Japan - Year-over-year growth 2024-2029 (%)
      • 12.14 France - Market size and forecast 2024-2029
        • Chart on France - Market size and forecast 2024-2029 ($ million)
        • Data Table on France - Market size and forecast 2024-2029 ($ million)
        • Chart on France - Year-over-year growth 2024-2029 (%)
        • Data Table on France - Year-over-year growth 2024-2029 (%)
      • 12.15 India - Market size and forecast 2024-2029
        • Chart on India - Market size and forecast 2024-2029 ($ million)
        • Data Table on India - Market size and forecast 2024-2029 ($ million)
        • Chart on India - Year-over-year growth 2024-2029 (%)
        • Data Table on India - Year-over-year growth 2024-2029 (%)
      • 12.16 Australia - Market size and forecast 2024-2029
        • Chart on Australia - Market size and forecast 2024-2029 ($ million)
        • Data Table on Australia - Market size and forecast 2024-2029 ($ million)
        • Chart on Australia - Year-over-year growth 2024-2029 (%)
        • Data Table on Australia - Year-over-year growth 2024-2029 (%)
      • 12.17 Italy - Market size and forecast 2024-2029
        • Chart on Italy - Market size and forecast 2024-2029 ($ million)
        • Data Table on Italy - Market size and forecast 2024-2029 ($ million)
        • Chart on Italy - Year-over-year growth 2024-2029 (%)
        • Data Table on Italy - Year-over-year growth 2024-2029 (%)
      • 12.18 Market opportunity by geography
        • Market opportunity by geography ($ million)
        • Data Tables on Market opportunity by geography ($ million)

      13 Drivers, Challenges, and Opportunity/Restraints

      • 13.1 Market drivers
        • 13.2 Market challenges
          • 13.3 Impact of drivers and challenges
            • Impact of drivers and challenges in 2024 and 2029
          • 13.4 Market opportunities/restraints

            14 Competitive Landscape

            • 14.1 Overview
              • 14.2 Competitive Landscape
                • Overview on criticality of inputs and factors of differentiation
              • 14.3 Landscape disruption
                • Overview on factors of disruption
              • 14.4 Industry risks
                • Impact of key risks on business

              15 Competitive Analysis

              • 15.1 Companies profiled
                • Companies covered
              • 15.2 Company ranking index
                • Company ranking index
              • 15.3 Market positioning of companies
                • Matrix on companies position and classification
              • 15.4 Accolade Wines Australia Ltd.
                • Accolade Wines Australia Ltd. - Overview
                • Accolade Wines Australia Ltd. - Product / Service
                • Accolade Wines Australia Ltd. - Key offerings
                • SWOT
              • 15.5 Anheuser Busch InBev SA NV
                • Anheuser Busch InBev SA NV - Overview
                • Anheuser Busch InBev SA NV - Product / Service
                • Anheuser Busch InBev SA NV - Key offerings
                • SWOT
              • 15.6 Asahi Group Holdings Ltd.
                • Asahi Group Holdings Ltd. - Overview
                • Asahi Group Holdings Ltd. - Business segments
                • Asahi Group Holdings Ltd. - Key news
                • Asahi Group Holdings Ltd. - Key offerings
                • Asahi Group Holdings Ltd. - Segment focus
                • SWOT
              • 15.7 Bacardi and Co. Ltd.
                • Bacardi and Co. Ltd. - Overview
                • Bacardi and Co. Ltd. - Product / Service
                • Bacardi and Co. Ltd. - Key news
                • Bacardi and Co. Ltd. - Key offerings
                • SWOT
              • 15.8 Brown Forman Corp.
                • Brown Forman Corp. - Overview
                • Brown Forman Corp. - Product / Service
                • Brown Forman Corp. - Key offerings
                • SWOT
              • 15.9 Campari Group
                • Campari Group - Overview
                • Campari Group - Business segments
                • Campari Group - Key offerings
                • Campari Group - Segment focus
                • SWOT
              • 15.10 Carlsberg Breweries AS
                • Carlsberg Breweries AS - Overview
                • Carlsberg Breweries AS - Business segments
                • Carlsberg Breweries AS - Key news
                • Carlsberg Breweries AS - Key offerings
                • Carlsberg Breweries AS - Segment focus
                • SWOT
              • 15.11 Diageo PLC
                • Diageo PLC - Overview
                • Diageo PLC - Business segments
                • Diageo PLC - Key news
                • Diageo PLC - Key offerings
                • Diageo PLC - Segment focus
                • SWOT
              • 15.12 Halewood International South Africa Pty Ltd.
                • Halewood International South Africa Pty Ltd. - Overview
                • Halewood International South Africa Pty Ltd. - Product / Service
                • Halewood International South Africa Pty Ltd. - Key offerings
                • SWOT
              • 15.13 Heineken NV
                • Heineken NV - Overview
                • Heineken NV - Business segments
                • Heineken NV - Key offerings
                • Heineken NV - Segment focus
                • SWOT
              • 15.14 MIKES HARD LEMONADE Co.
                • MIKES HARD LEMONADE Co. - Overview
                • MIKES HARD LEMONADE Co. - Product / Service
                • MIKES HARD LEMONADE Co. - Key offerings
                • SWOT
              • 15.15 Molson Coors Beverage Co.
                • Molson Coors Beverage Co. - Overview
                • Molson Coors Beverage Co. - Business segments
                • Molson Coors Beverage Co. - Key offerings
                • Molson Coors Beverage Co. - Segment focus
                • SWOT
              • 15.16 Pernod Ricard SA
                • Pernod Ricard SA - Overview
                • Pernod Ricard SA - Product / Service
                • Pernod Ricard SA - Key news
                • Pernod Ricard SA - Key offerings
                • SWOT
              • 15.17 The Boston Beer Co. Inc.
                • The Boston Beer Co. Inc. - Overview
                • The Boston Beer Co. Inc. - Product / Service
                • The Boston Beer Co. Inc. - Key offerings
                • SWOT
              • 15.18 United Brands LLC
                • United Brands LLC - Overview
                • United Brands LLC - Product / Service
                • United Brands LLC - Key offerings
                • SWOT

              16 Appendix

              • 16.1 Scope of the report
                • 16.2 Inclusions and exclusions checklist
                  • Inclusions checklist
                  • Exclusions checklist
                • 16.3 Currency conversion rates for US$
                  • Currency conversion rates for US$
                • 16.4 Research methodology
                  • Research methodology
                • 16.5 Data procurement
                  • Information sources
                • 16.6 Data validation
                  • Data validation
                • 16.7 Validation techniques employed for market sizing
                  • Validation techniques employed for market sizing
                • 16.8 Data synthesis
                  • Data synthesis
                • 16.9 360 degree market analysis
                  • 360 degree market analysis
                • 16.10 List of abbreviations
                  • List of abbreviations

                Research Methodology

                Technavio presents a detailed picture of the market by way of study, synthesis, and summation of data from multiple sources. The analysts have presented the various facets of the market with a particular focus on identifying the key industry influencers. The data thus presented is comprehensive, reliable, and the result of extensive research, both primary and secondary.

                INFORMATION SOURCES

                Primary sources

                • Manufacturers and suppliers
                • Channel partners
                • Industry experts
                • Strategic decision makers

                Secondary sources

                • Industry journals and periodicals
                • Government data
                • Financial reports of key industry players
                • Historical data
                • Press releases

                DATA ANALYSIS

                Data Synthesis

                • Collation of data
                • Estimation of key figures
                • Analysis of derived insights

                Data Validation

                • Triangulation with data models
                • Reference against proprietary databases
                • Corroboration with industry experts

                REPORT WRITING

                Qualitative

                • Market drivers
                • Market challenges
                • Market trends
                • Five forces analysis

                Quantitative

                • Market size and forecast
                • Market segmentation
                • Geographical insights
                • Competitive landscape

                Interested in this report?

                Get your sample now to see our research methodology and insights!

                Download Now

                Frequently Asked Questions

                Ready To Drink (Rtd) Alcoholic Beverages market growth will increase by $ 8456.1 mn during 2025-2029.

                The Ready To Drink (Rtd) Alcoholic Beverages market is expected to grow at a CAGR of 5.6% during 2025-2029.

                Ready To Drink (Rtd) Alcoholic Beverages market is segmented by Distribution Channel( Off-trade, On-trade, Others) Packaging( Bottles, Cans, Others) Type( Hard seltzers, Canned cocktails, Flavored malt beverages, Hard ciders, Hard kombucha)

                Accolade Wines Australia Ltd., Anheuser Busch InBev SA NV, Asahi Group Holdings Ltd., Bacardi and Co. Ltd., Brown Forman Corp., Campari Group, Carlsberg Breweries AS, Constellation Brands Inc., Diageo PLC, Halewood International South Africa Pty Ltd., Heaven Hill Distillery Inc., Heineken NV, Manchester Drinks Ltd., Mark Anthony Brands International Unlimited Co., MIKES HARD LEMONADE Co., Molson Coors Beverage Co., Pernod Ricard SA, SHS Drinks, The Boston Beer Co. Inc., United Brands LLC are a few of the key vendors in the Ready To Drink (Rtd) Alcoholic Beverages market.

                North America will register the highest growth rate of 34% among the other regions. Therefore, the Ready To Drink (Rtd) Alcoholic Beverages market in North America is expected to garner significant business opportunities for the vendors during the forecast period.

                US, China, UK, Canada, Germany, Japan, France, India, Australia, Italy

                • Increasing demand for RTD pre-mixesThe rising demand for ready-to-drink (RTD) pre-mixes is largely driven by their inherent convenience is the driving factor this market.
                • catering to consumers with busy schedules seeking quick and accessible options. This is further fueled by a growing inclination towards healthier choices is the driving factor this market.
                • with many RTD pre-mixes offering lower calories and alcohol content compared to traditional beverages. The market is witnessing a surge in innovations is the driving factor this market.
                • including the introduction of diverse variants is the driving factor this market.
                • new and exotic flavors is the driving factor this market.
                • and eye-catching packaging formats is the driving factor this market.
                • further attracting a broader consumer base and contributing to the projected growth of the RTD pre-mix sector. The spirit-based RTD cocktails are experiencing rapid growth is the driving factor this market.
                • fueled by consumer desires for premium is the driving factor this market.
                • bar-quality experiences in a convenient format is the driving factor this market.
                • with the U.S. spirit-based RTD cocktails sector.Dark spirit based RTD mixes contain dark Scotch is the driving factor this market.
                • rum is the driving factor this market.
                • and Bourbon whiskey as the base. Dark spirit based RTD pre-mixes witness a higher demand during winter. Light spirit based RTD pre-mixes have liqueur is the driving factor this market.
                • light rum is the driving factor this market.
                • vodka is the driving factor this market.
                • and gin as the base. The demand for RTD pre-mixes is higher during the summer season. Innovation in terms of packaging is the driving factor this market.
                • flavor is the driving factor this market.
                • and ingredients is expected to fuel the growth of this market segment. Owing to these reasons is the driving factor this market.
                • the market in focus is expected to witness considerable growth during the forecast period. is the driving factor this market.

                The Ready To Drink (Rtd) Alcoholic Beverages market vendors should focus on grabbing business opportunities from the Off-trade segment as it accounted for the largest market share in the base year.