RS232, RS422, RS485 Drives Market Analysis, Size, and Forecast 2025-2029: APAC (China, Japan, and India), North America (US and Canada), Europe (Germany, UK, and France), Middle East and Africa (Saudi Arabia and UAE), South America (Brazil and Argentina), and Rest of World (ROW)

RS232, RS422, RS485 Drives Market Analysis, Size, and Forecast 2025-2029:
APAC (China, Japan, and India), North America (US and Canada), Europe (Germany, UK, and France), Middle East and Africa (Saudi Arabia and UAE), South America (Brazil and Argentina), and Rest of World (ROW)

Published: Dec 2025 269 Pages SKU: IRTNTR81009

Market Overview at a Glance

$364.8 Mn
Market Opportunity
5.7%
CAGR 2024 - 2029
40.8%
APAC Growth
$482.5 Mn
RS-485 drives segment 2023

RS232, RS422, RS485 Drives Market Size 2025-2029

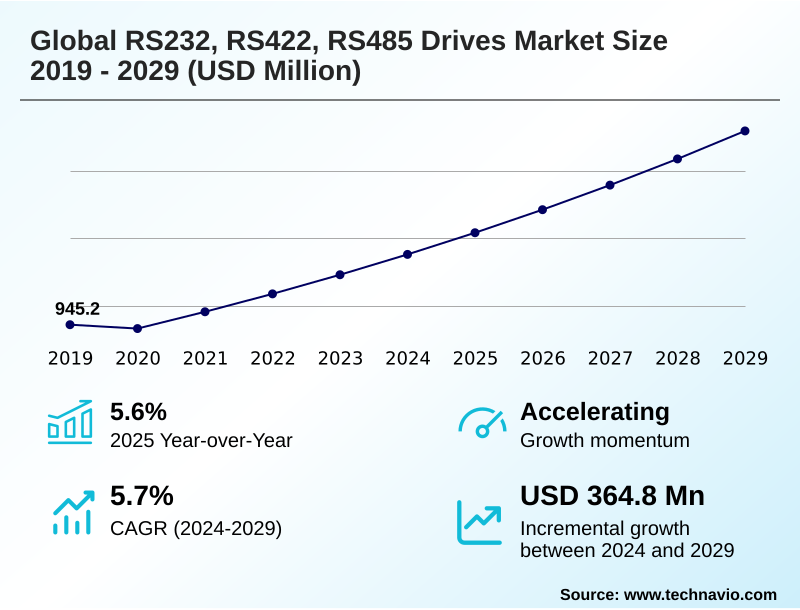
The rs232, rs422, rs485 drives market size is valued to increase by USD 364.8 million, at a CAGR of 5.7% from 2024 to 2029. Continued Integration within Industrial Automation will drive the rs232, rs422, rs485 drives market.

Major Market Trends & Insights

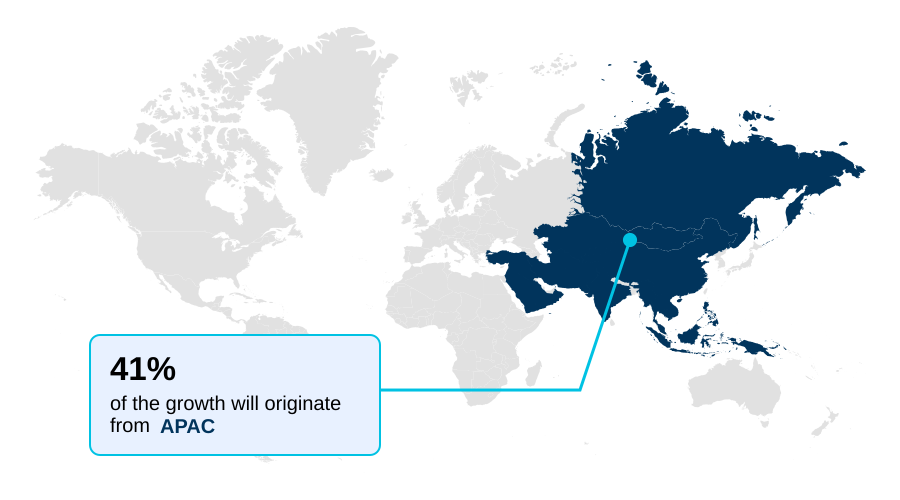
  • APAC dominated the market and accounted for a 40.8% growth during the forecast period.
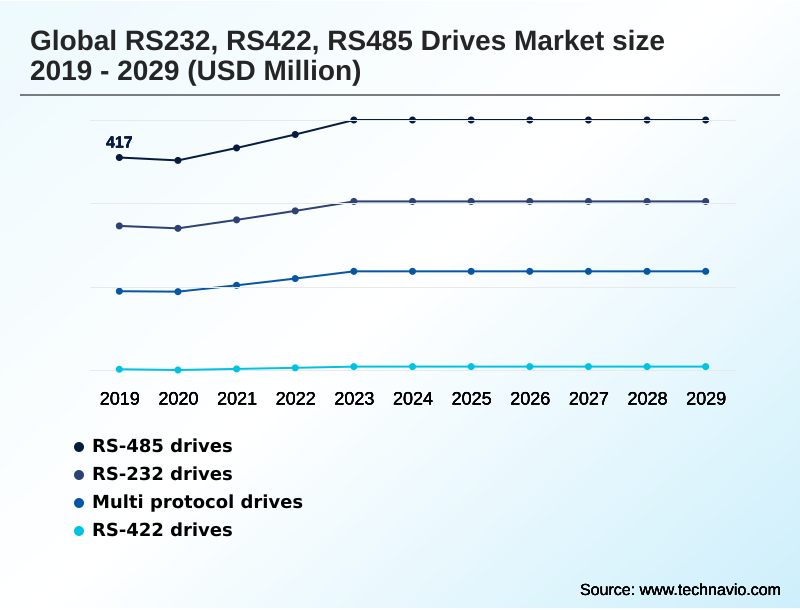
  • By Type - RS-485 drives segment was valued at USD 482.5 million in 2023
  • By Application - Industrial automation and process control segment accounted for the largest market revenue share in 2023

Market Size & Forecast

  • Market Opportunities: USD 572.5 million
  • Market Future Opportunities: USD 364.8 million
  • CAGR from 2024 to 2029 : 5.7%

Market Summary

  • The RS232, RS422, RS485 drives market maintains its relevance through its role as a critical enabler of industrial automation and the industrial internet of things (iiot). These serial communication standards provide a reliable and cost-effective method for controlling motors in a vast array of applications, from manufacturing to building automation.
  • A primary market driver is the need for brownfield integration, where existing operational technology (ot) infrastructure is modernized without a complete and costly overhaul. For instance, a manufacturing facility can achieve significant efficiency gains by deploying a serial-to-ethernet gateway to connect its legacy machines, which use modbus rtu protocol, to a cloud-based analytics platform.
  • This allows for predictive maintenance and performance monitoring, reducing downtime by over 15% without replacing functional equipment. While facing competition from newer protocols, the inherent robustness, simplicity, and large installed base of these drives ensure their continued demand.
  • Trends toward miniaturization and enhanced on-chip features like galvanic isolation further extend their applicability into new, space-constrained, and specialized sectors, ensuring a persistent role in the evolving landscape of industrial connectivity.

What will be the Size of the RS232, RS422, RS485 Drives Market during the forecast period?

Get Key Insights on Market Forecast (PDF) Request Free Sample

How is the RS232, RS422, RS485 Drives Market Segmented?

The rs232, rs422, rs485 drives industry research report provides comprehensive data (region-wise segment analysis), with forecasts and estimates in "USD million" for the period 2025-2029, as well as historical data from 2019-2023 for the following segments.

  • Type
    • RS-485 drives
    • RS-232 drives
    • Multi protocol drives
    • RS-422 drives
  • Application
    • Industrial automation and process control
    • Building automation
    • Utilities and energy
    • Transportation
    • Others
  • Product
    • Multi drop
    • Point to point
    • Half duplex
    • Full duplex
  • Geography
    • APAC
      • China
      • Japan
      • India
    • North America
      • US
      • Canada
    • Europe
      • Germany
      • UK
      • France
    • Middle East and Africa
      • Saudi Arabia
      • UAE
    • South America
      • Brazil
      • Argentina
    • Rest of World (ROW)

By Type Insights

The rs-485 drives segment is estimated to witness significant growth during the forecast period.

The RS-485 drives segment leads the market, valued for its robust networking capabilities and cost-effectiveness. Utilizing a differential signaling standard, this protocol excels in long-distance communication and demonstrates superior noise immunity in high-EMI environments.

Its key advantage is the support for a multi-drop network, where a single twisted-pair cable can connect up to 32 standard devices in a half-duplex communication arrangement.

This architecture, often governed by a master-slave protocol, significantly reduces wiring complexity compared to point-to-point communication solutions.

Consequently, it is the standard for industrial automation and process control, coordinating conveyor systems, managing building automation systems (bas), and enabling remote infrastructure monitoring, bridging operational technology (ot) with modern IT networks through effective command-and-control signaling.

Request Free Sample

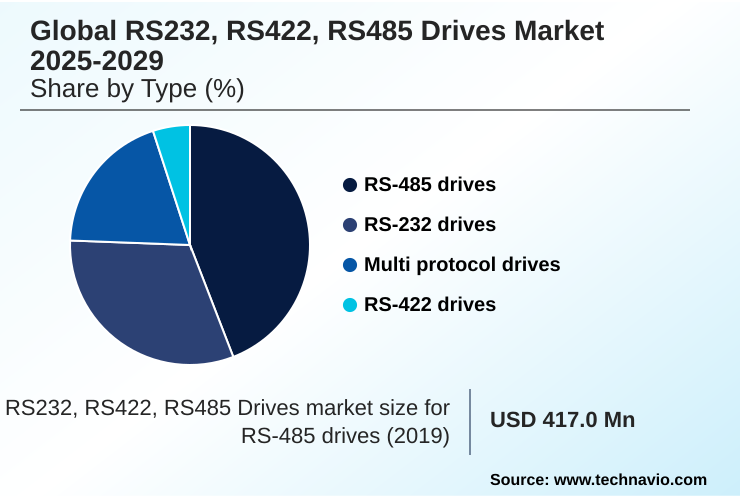
The RS-485 drives segment was valued at USD 482.5 million in 2023 and showed a gradual increase during the forecast period.

Request Free Sample

Regional Analysis

APAC is estimated to contribute 40.8% to the growth of the global market during the forecast period.Technavio’s analysts have elaborately explained the regional trends and drivers that shape the market during the forecast period.

See How RS232, RS422, RS485 Drives Market Demand is Rising in APAC Request Free Sample

Geographically, the market is led by the APAC region, which is projected to expand more rapidly than other territories, including North America and Europe.

This growth is driven by massive industrialization, government-led manufacturing initiatives, and the region's status as a global electronics production hub.

Countries like China, India, and Japan are significant contributors, fueled by advanced robotics, automotive, and semiconductor manufacturing sectors that demand precise motion control.

In North America, which accounts for over 28% of the market's growth, demand is strong for building automation systems (bas) and the modernization of legacy factory equipment.

The technical merits of differential signaling make these drives indispensable for mission-critical applications and in any high-emi environment globally, sustaining demand for both new installations and brownfield integration projects.

Market Dynamics

Our researchers analyzed the data with 2024 as the base year, along with the key drivers, trends, and challenges. A holistic analysis of drivers will help companies refine their marketing strategies to gain a competitive advantage.

  • Strategic decision-making in the RS232, RS422, RS485 drives market often involves choosing between rs485 and industrial ethernet. While ethernet offers higher bandwidth, the cost-benefit of serial vs ethernet drives remains favorable for many applications, especially in distributed sensor networks.
  • For oem flexibility, using multi-protocol drives is a key strategy, as it can reduce inventory SKUs by more than half compared to stocking single-protocol variants. A deep understanding of rs422 for full-duplex point-to-point links is critical for applications requiring simultaneous, low-latency data flow.
  • Implementing modbus rtu over rs485 networks remains a standard practice, but it requires addressing noise immunity techniques for rs485 buses and proper troubleshooting of rs485 signal reflection issues to ensure reliability. The miniaturization trends in rs485 transceivers are enabling new use cases, although challenges of integrating serial to ip gateways persist, particularly around securing legacy serial device networks.
  • For specific applications, rs232 for legacy device configuration ports is still indispensable due to its simplicity. Extending rs485 communication distance is a frequent goal, especially for large scale solar farms and process control systems that utilize a multi-drop bus architecture.
  • Ultimately, selecting drives for industrial automation systems requires balancing these technical factors, including rs232 limitations in industrial settings, with the unique demands of applications like rs485 drives in hvac control systems or rs485 vs bluetooth mesh for building automation.

What are the key market drivers leading to the rise in the adoption of RS232, RS422, RS485 Drives Industry?

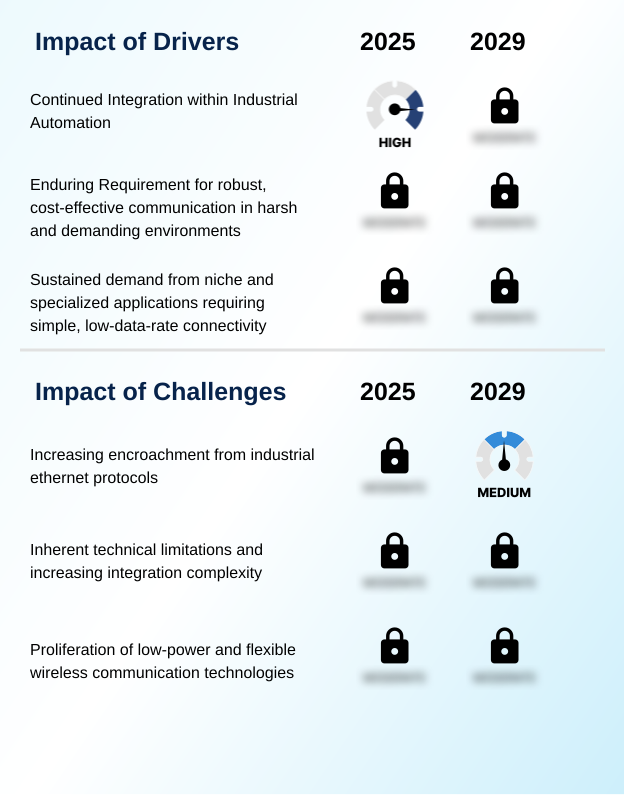
  • The continued integration of serial communication drives within industrial automation serves as a fundamental driver for market growth.

  • Market momentum is fundamentally propelled by continued integration within industrial automation and the need for robust, cost-effective connectivity.
  • The technical merits of differential signaling in RS422 and RS485 standards provide exceptional noise immunity and support communication over distances of up to 1200 meters, making them indispensable in high-EMI environments like manufacturing floors and electrical substations.
  • The ability of a multi-drop network to connect up to 32 devices on a single cable significantly reduces wiring costs and complexity compared to point-to-point alternatives.
  • This efficiency is critical in large-scale deployments such as building automation systems (bas) and logistics automation, where hundreds of nodes must be reliably connected.

What are the market trends shaping the RS232, RS422, RS485 Drives Industry?

  • A key market trend involves the strategic integration of serial drives with Industrial IoT and edge computing platforms. This approach focuses on modernizing legacy systems rather than complete replacement.

  • A primary trend is the strategic integration of serial interfaces with Industrial IoT and edge computing ecosystems, which enables legacy system modernization. This brownfield approach allows companies to unlock data from existing machinery, with implementations showing a 15% reduction in unplanned downtime without costly hardware replacement.
  • Another trend is the proliferation of these drives in specialized sectors like renewable energy management and precision agriculture communication, where long-distance capability and noise immunity are critical.
  • Finally, accelerated miniaturization at the component level, through innovations like system-in-package (sip) and wafer-level chip-scale package (wlcsp) designs, is enabling the use of robust serial communication in space-constrained applications such as collaborative robots (cobots) and portable medical device interfacing.

What challenges does the RS232, RS422, RS485 Drives Industry face during its growth?

  • A primary challenge affecting market growth is the increasing encroachment from industrial Ethernet protocols in new and retrofit installations.

  • The market faces significant challenges from the encroachment of industrial Ethernet protocols, which offer superior bandwidth and seamless IT network integration. The development of single pair ethernet (spe) directly threatens the core use case for RS485 at the field level. Furthermore, inherent technical limitations, including bandwidth ceilings and the complexity of integrating non-IP devices into modern IIoT platforms, present hurdles.
  • Gateways required for such integration add cost and create potential security vulnerabilities, as legacy serial protocols lack native encryption. The proliferation of low-power wireless technologies like LoRaWAN and Bluetooth Mesh also provides a compelling alternative, eliminating cabling costs entirely and reducing installation labor by up to 70% in retrofit scenarios.

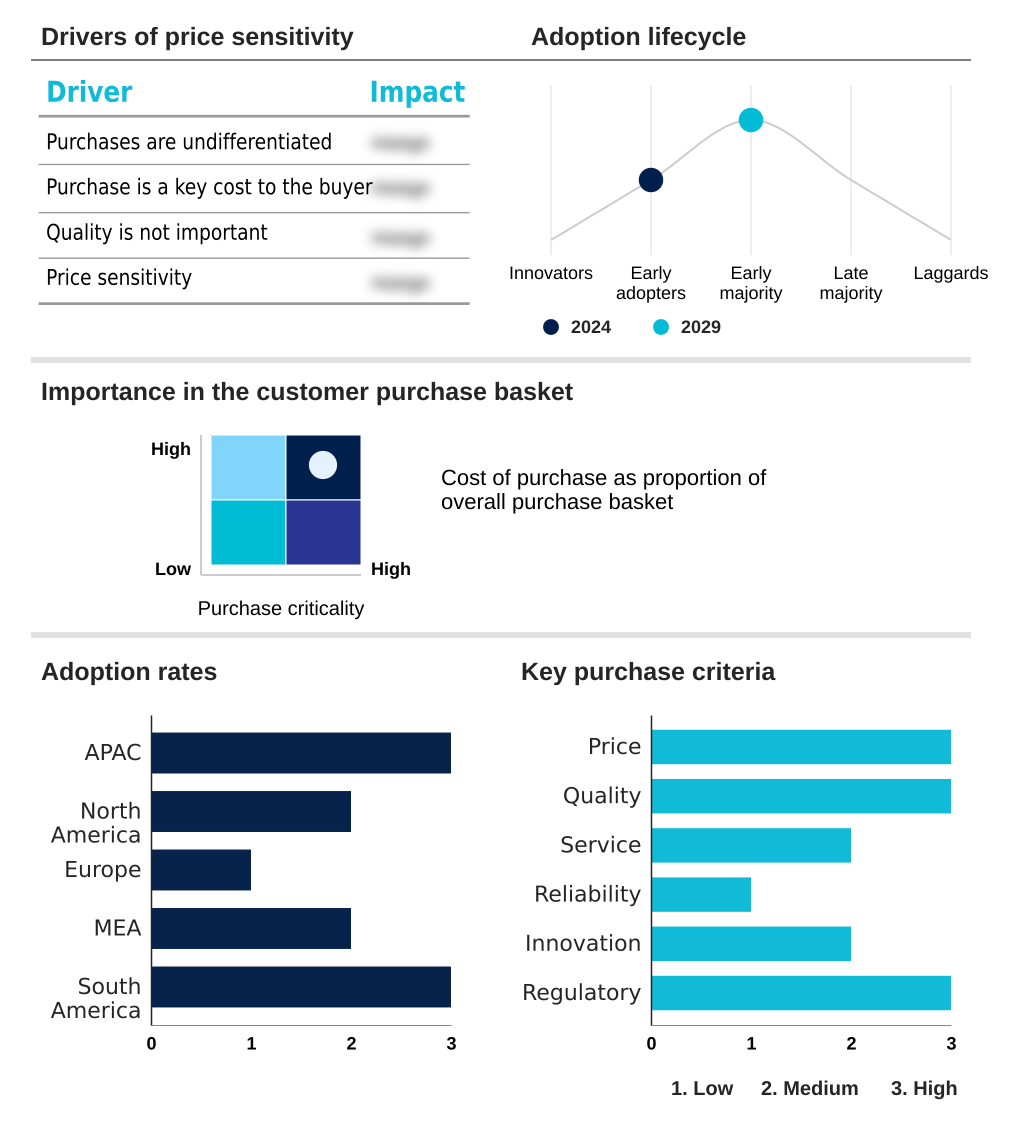
Exclusive Technavio Analysis on Customer Landscape

The rs232, rs422, rs485 drives market forecasting report includes the adoption lifecycle of the market, covering from the innovator’s stage to the laggard’s stage. It focuses on adoption rates in different regions based on penetration. Furthermore, the rs232, rs422, rs485 drives market report also includes key purchase criteria and drivers of price sensitivity to help companies evaluate and develop their market growth analysis strategies.

Customer Landscape of RS232, RS422, RS485 Drives Industry

Competitive Landscape

Companies are implementing various strategies, such as strategic alliances, rs232, rs422, rs485 drives market forecast, partnerships, mergers and acquisitions, geographical expansion, and product/service launches, to enhance their presence in the industry.

ABB Ltd. - Core offerings include variable speed and AC drives with embedded RS485 interfaces, supporting key industrial protocols for automation and system integration.

The industry research and growth report includes detailed analyses of the competitive landscape of the market and information about key companies, including:

  • ABB Ltd.
  • Danfoss AS
  • Delta Electronics Inc.
  • Fuji Electric Co. Ltd.
  • Hamilton Co.
  • Mitsubishi Electric Corp.
  • Rockwell Automation Inc.
  • Schneider Electric SE
  • Siemens AG
  • Yaskawa Electric Corp.

Qualitative and quantitative analysis of companies has been conducted to help clients understand the wider business environment as well as the strengths and weaknesses of key industry players. Data is qualitatively analyzed to categorize companies as pure play, category-focused, industry-focused, and diversified; it is quantitatively analyzed to categorize companies as dominant, leading, strong, tentative, and weak.

Recent Development and News in Rs232, rs422, rs485 drives market

  • In September 2024, Johnson Controls announced a new portfolio of building access control solutions, featuring architectures that rely heavily on RS485 communication backbones for connecting numerous peripheral devices throughout large facilities.
  • In November 2024, Toast reported continued hardware deployments for its restaurant management platforms, sustaining steady demand for cost-effective RS232-based point-of-sale peripherals, including receipt printers and kitchen display systems.
  • In January 2025, Analog Devices launched its new ADM2867E series of isolated RS485 transceivers, which integrate proprietary isolation technology into a single surface-mount package to address the growing demand for miniaturization in industrial automation.
  • In April 2025, the SPE Industrial Partner Network announced new strategic collaborations aimed at accelerating the market adoption of Single Pair Ethernet (SPE), a technology positioned as a long-term alternative to RS485 for field-level device connectivity.

Dive into Technavio’s robust research methodology, blending expert interviews, extensive data synthesis, and validated models for unparalleled RS232, RS422, RS485 Drives Market insights. See full methodology.

Market Scope
Page number 269
Base year 2024
Historic period 2019-2023
Forecast period 2025-2029
Growth momentum & CAGR Accelerate at a CAGR of 5.7%
Market growth 2025-2029 USD 364.8 million
Market structure Concentrated
YoY growth 2024-2025(%) 5.6%
Key countries China, Japan, India, South Korea, Australia, US, Canada, Germany, UK, France, Saudi Arabia, UAE, Brazil and Argentina
Competitive landscape Leading Companies, Market Positioning of Companies, Competitive Strategies, and Industry Risks

Request Free Sample

Research Analyst Overview

  • The market for RS-series drives is defined by its enduring utility in industrial settings, where reliability and cost-effectiveness are paramount. Boardroom-level decisions increasingly favor brownfield integration over expensive system overhauls, cementing the role of these drives. A key technical feature is differential signaling, which enables common-mode noise rejection and communication over distances up to 1200 meters.
  • This makes the serial communication standard ideal for multi-drop network configurations using a single twisted-pair cable, often managed by a master-slave protocol like modbus rtu protocol. The integration of operational technology (ot) with the industrial internet of things (iiot) is facilitated by the protocol converter and serial-to-ethernet gateway, which connect legacy equipment.
  • Modern drives incorporate advanced features through system-in-package (sip) designs, offering enhanced electrostatic discharge (esd) protection and even galvanic isolation. Component-level innovations, such as the universal synchronous/asynchronous receiver-transmitter (usart) in microcontrollers and low-power transceivers in wafer-level chip-scale package (wlcsp) formats, address the trend toward miniaturization.
  • While single pair ethernet poses a future challenge, the utility of half-duplex communication and full-duplex communication in specific topologies persists. Proper bus termination and network biasing are critical for stable operation. These drives are crucial for variable frequency drives (vfds), human-machine interfaces (hmis), intelligent electronic devices (ieds), and remote terminal units (rtus), especially for command-and-control signaling.
  • The availability of software-selectable ports and transient voltage protection in modern data circuit-terminating equipment (dce) counters the limitations of older single-ended signaling methods.

What are the Key Data Covered in this RS232, RS422, RS485 Drives Market Research and Growth Report?

  • What is the expected growth of the RS232, RS422, RS485 Drives Market between 2025 and 2029?

    • USD 364.8 million, at a CAGR of 5.7%

  • What segmentation does the market report cover?

    • The report is segmented by Type (RS-485 drives, RS-232 drives, Multi protocol drives, RS-422 drives), Application (Industrial automation and process control, Building automation, Utilities and energy, Transportation, Others), Product (Multi drop, Point to point, Half duplex, Full duplex) and Geography (APAC, North America, Europe, Middle East and Africa, South America)

  • Which regions are analyzed in the report?

    • APAC, North America, Europe, Middle East and Africa and South America

  • What are the key growth drivers and market challenges?

    • Continued Integration within Industrial Automation , Increasing encroachment from industrial ethernet protocols

  • Who are the major players in the RS232, RS422, RS485 Drives Market?

    • ABB Ltd., Danfoss AS, Delta Electronics Inc., Fuji Electric Co. Ltd., Hamilton Co., Mitsubishi Electric Corp., Rockwell Automation Inc., Schneider Electric SE, Siemens AG and Yaskawa Electric Corp.

Market Research Insights

  • The market dynamics for RS-series drives are shaped by a balance between legacy system modernization and the need for harsh environment communication. These drives are central to distributed control systems that require simple, low-data-rate connectivity. While newer protocols offer higher bandwidth, the proven reliability and cost-effectiveness of serial standards ensure their continued use.
  • For example, adopting multi-drop networks can reduce wiring complexity by more than 50% compared to individual point-to-point connections. In sectors like precision agriculture communication and smart grid infrastructure, this leads to significant savings.
  • Furthermore, implementing intelligent gateways enables a reduction in unplanned downtime by linking previously isolated assets, demonstrating a clear return on investment for upgrading existing industrial automation and process control infrastructure without full replacement.

We can help! Our analysts can customize this rs232, rs422, rs485 drives market research report to meet your requirements.

Get in touch

1. Executive Summary

1.1 Market overview

Executive Summary - Chart on Market Overview
Executive Summary - Data Table on Market Overview
Executive Summary - Chart on Global Market Characteristics
Executive Summary - Chart on Market by Geography
Executive Summary - Chart on Market Segmentation by Type
Executive Summary - Chart on Market Segmentation by Application
Executive Summary - Chart on Market Segmentation by Product
Executive Summary - Chart on Incremental Growth
Executive Summary - Data Table on Incremental Growth
Executive Summary - Chart on Company Market Positioning

2. Technavio Analysis

2.1 Analysis of price sensitivity, lifecycle, customer purchase basket, adoption rates, and purchase criteria

2.2 Criticality of inputs and Factors of differentiation

Chart on Overview on criticality of inputs and factors of differentiation

2.3 Factors of disruption

Chart on Overview on factors of disruption

2.4 Impact of drivers and challenges

Chart on Impact of drivers and challenges in 2024 and 2029

3. Market Landscape

3.1 Market ecosystem

Chart on Parent Market
Data Table on - Parent Market

3.2 Market characteristics

Chart on Market characteristics analysis

3.3 Value chain analysis

Chart on Value chain analysis

4. Market Sizing

4.1 Market definition

Data Table on Offerings of companies included in the market definition

4.2 Market segment analysis

Market segments

4.3 Market size 2024

4.4 Market outlook: Forecast for 2024-2029

Chart on Global - Market size and forecast 2024-2029 ($ million)
Data Table on Global - Market size and forecast 2024-2029 ($ million)
Chart on Global Market: Year-over-year growth 2024-2029 (%)
Data Table on Global Market: Year-over-year growth 2024-2029 (%)

5. Historic Market Size

5.1 Global RS232, RS422, RS485 Drives Market 2019 - 2023

Historic Market Size - Data Table on Global RS232, RS422, RS485 Drives Market 2019 - 2023 ($ million)

5.2 Type segment analysis 2019 - 2023

Historic Market Size - Type Segment 2019 - 2023 ($ million)

5.3 Application segment analysis 2019 - 2023

Historic Market Size - Application Segment 2019 - 2023 ($ million)

5.4 Product segment analysis 2019 - 2023

Historic Market Size - Product Segment 2019 - 2023 ($ million)

5.5 Geography segment analysis 2019 - 2023

Historic Market Size - Geography Segment 2019 - 2023 ($ million)

5.6 Country segment analysis 2019 - 2023

Historic Market Size - Country Segment 2019 - 2023 ($ million)

6. Five Forces Analysis

6.1 Five forces summary

Five forces analysis - Comparison between 2024 and 2029

6.2 Bargaining power of buyers

Bargaining power of buyers - Impact of key factors 2024 and 2029

6.3 Bargaining power of suppliers

Bargaining power of suppliers - Impact of key factors in 2024 and 2029

6.4 Threat of new entrants

Threat of new entrants - Impact of key factors in 2024 and 2029

6.5 Threat of substitutes

Threat of substitutes - Impact of key factors in 2024 and 2029

6.6 Threat of rivalry

Threat of rivalry - Impact of key factors in 2024 and 2029

6.7 Market condition

Chart on Market condition - Five forces 2024 and 2029

7. Market Segmentation by Type

7.1 Market segments

Chart on Type - Market share 2024-2029 (%)
Data Table on Type - Market share 2024-2029 (%)

7.2 Comparison by Type

Chart on Comparison by Type
Data Table on Comparison by Type

7.3 RS-485 drives - Market size and forecast 2024-2029

Chart on RS-485 drives - Market size and forecast 2024-2029 ($ million)
Data Table on RS-485 drives - Market size and forecast 2024-2029 ($ million)
Chart on RS-485 drives - Year-over-year growth 2024-2029 (%)
Data Table on RS-485 drives - Year-over-year growth 2024-2029 (%)

7.4 RS-232 drives - Market size and forecast 2024-2029

Chart on RS-232 drives - Market size and forecast 2024-2029 ($ million)
Data Table on RS-232 drives - Market size and forecast 2024-2029 ($ million)
Chart on RS-232 drives - Year-over-year growth 2024-2029 (%)
Data Table on RS-232 drives - Year-over-year growth 2024-2029 (%)

7.5 Multi protocol drives - Market size and forecast 2024-2029

Chart on Multi protocol drives - Market size and forecast 2024-2029 ($ million)
Data Table on Multi protocol drives - Market size and forecast 2024-2029 ($ million)
Chart on Multi protocol drives - Year-over-year growth 2024-2029 (%)
Data Table on Multi protocol drives - Year-over-year growth 2024-2029 (%)

7.6 RS-422 drives - Market size and forecast 2024-2029

Chart on RS-422 drives - Market size and forecast 2024-2029 ($ million)
Data Table on RS-422 drives - Market size and forecast 2024-2029 ($ million)
Chart on RS-422 drives - Year-over-year growth 2024-2029 (%)
Data Table on RS-422 drives - Year-over-year growth 2024-2029 (%)

7.7 Market opportunity by Type

Market opportunity by Type ($ million)
Data Table on Market opportunity by Type ($ million)

8. Market Segmentation by Application

8.1 Market segments

Chart on Application - Market share 2024-2029 (%)
Data Table on Application - Market share 2024-2029 (%)

8.2 Comparison by Application

Chart on Comparison by Application
Data Table on Comparison by Application

8.3 Industrial automation and process control - Market size and forecast 2024-2029

Chart on Industrial automation and process control - Market size and forecast 2024-2029 ($ million)
Data Table on Industrial automation and process control - Market size and forecast 2024-2029 ($ million)
Chart on Industrial automation and process control - Year-over-year growth 2024-2029 (%)
Data Table on Industrial automation and process control - Year-over-year growth 2024-2029 (%)

8.4 Building automation - Market size and forecast 2024-2029

Chart on Building automation - Market size and forecast 2024-2029 ($ million)
Data Table on Building automation - Market size and forecast 2024-2029 ($ million)
Chart on Building automation - Year-over-year growth 2024-2029 (%)
Data Table on Building automation - Year-over-year growth 2024-2029 (%)

8.5 Utilities and energy - Market size and forecast 2024-2029

Chart on Utilities and energy - Market size and forecast 2024-2029 ($ million)
Data Table on Utilities and energy - Market size and forecast 2024-2029 ($ million)
Chart on Utilities and energy - Year-over-year growth 2024-2029 (%)
Data Table on Utilities and energy - Year-over-year growth 2024-2029 (%)

8.6 Transportation - Market size and forecast 2024-2029

Chart on Transportation - Market size and forecast 2024-2029 ($ million)
Data Table on Transportation - Market size and forecast 2024-2029 ($ million)
Chart on Transportation - Year-over-year growth 2024-2029 (%)
Data Table on Transportation - Year-over-year growth 2024-2029 (%)

8.7 Others - Market size and forecast 2024-2029

Chart on Others - Market size and forecast 2024-2029 ($ million)
Data Table on Others - Market size and forecast 2024-2029 ($ million)
Chart on Others - Year-over-year growth 2024-2029 (%)
Data Table on Others - Year-over-year growth 2024-2029 (%)

8.8 Market opportunity by Application

Market opportunity by Application ($ million)
Data Table on Market opportunity by Application ($ million)

9. Market Segmentation by Product

9.1 Market segments

Chart on Product - Market share 2024-2029 (%)
Data Table on Product - Market share 2024-2029 (%)

9.2 Comparison by Product

Chart on Comparison by Product
Data Table on Comparison by Product

9.3 Multi drop - Market size and forecast 2024-2029

Chart on Multi drop - Market size and forecast 2024-2029 ($ million)
Data Table on Multi drop - Market size and forecast 2024-2029 ($ million)
Chart on Multi drop - Year-over-year growth 2024-2029 (%)
Data Table on Multi drop - Year-over-year growth 2024-2029 (%)

9.4 Point to point - Market size and forecast 2024-2029

Chart on Point to point - Market size and forecast 2024-2029 ($ million)
Data Table on Point to point - Market size and forecast 2024-2029 ($ million)
Chart on Point to point - Year-over-year growth 2024-2029 (%)
Data Table on Point to point - Year-over-year growth 2024-2029 (%)

9.5 Half duplex - Market size and forecast 2024-2029

Chart on Half duplex - Market size and forecast 2024-2029 ($ million)
Data Table on Half duplex - Market size and forecast 2024-2029 ($ million)
Chart on Half duplex - Year-over-year growth 2024-2029 (%)
Data Table on Half duplex - Year-over-year growth 2024-2029 (%)

9.6 Full duplex - Market size and forecast 2024-2029

Chart on Full duplex - Market size and forecast 2024-2029 ($ million)
Data Table on Full duplex - Market size and forecast 2024-2029 ($ million)
Chart on Full duplex - Year-over-year growth 2024-2029 (%)
Data Table on Full duplex - Year-over-year growth 2024-2029 (%)

9.7 Market opportunity by Product

Market opportunity by Product ($ million)
Data Table on Market opportunity by Product ($ million)

10. Customer Landscape

10.1 Customer landscape overview

Analysis of price sensitivity, lifecycle, customer purchase basket, adoption rates, and purchase criteria

11. Geographic Landscape

11.1 Geographic segmentation

Chart on Market share by geography 2024-2029 (%)
Data Table on Market share by geography 2024-2029 (%)

11.2 Geographic comparison

Chart on Geographic comparison
Data Table on Geographic comparison

11.3 APAC - Market size and forecast 2024-2029

Chart on APAC - Market size and forecast 2024-2029 ($ million)
Data Table on APAC - Market size and forecast 2024-2029 ($ million)
Chart on APAC - Year-over-year growth 2024-2029 (%)
Data Table on APAC - Year-over-year growth 2024-2029 (%)
Chart on Regional Comparison - APAC
Data Table on Regional Comparison - APAC

11.3.1 China - Market size and forecast 2024-2029

Chart on China - Market size and forecast 2024-2029 ($ million)
Data Table on China - Market size and forecast 2024-2029 ($ million)
Chart on China - Year-over-year growth 2024-2029 (%)
Data Table on China - Year-over-year growth 2024-2029 (%)

11.3.2 Japan - Market size and forecast 2024-2029

Chart on Japan - Market size and forecast 2024-2029 ($ million)
Data Table on Japan - Market size and forecast 2024-2029 ($ million)
Chart on Japan - Year-over-year growth 2024-2029 (%)
Data Table on Japan - Year-over-year growth 2024-2029 (%)

11.3.3 India - Market size and forecast 2024-2029

Chart on India - Market size and forecast 2024-2029 ($ million)
Data Table on India - Market size and forecast 2024-2029 ($ million)
Chart on India - Year-over-year growth 2024-2029 (%)
Data Table on India - Year-over-year growth 2024-2029 (%)

11.3.4 South Korea - Market size and forecast 2024-2029

Chart on South Korea - Market size and forecast 2024-2029 ($ million)
Data Table on South Korea - Market size and forecast 2024-2029 ($ million)
Chart on South Korea - Year-over-year growth 2024-2029 (%)
Data Table on South Korea - Year-over-year growth 2024-2029 (%)

11.3.5 Australia - Market size and forecast 2024-2029

Chart on Australia - Market size and forecast 2024-2029 ($ million)
Data Table on Australia - Market size and forecast 2024-2029 ($ million)
Chart on Australia - Year-over-year growth 2024-2029 (%)
Data Table on Australia - Year-over-year growth 2024-2029 (%)

11.4 North America - Market size and forecast 2024-2029

Chart on North America - Market size and forecast 2024-2029 ($ million)
Data Table on North America - Market size and forecast 2024-2029 ($ million)
Chart on North America - Year-over-year growth 2024-2029 (%)
Data Table on North America - Year-over-year growth 2024-2029 (%)
Chart on Regional Comparison - North America
Data Table on Regional Comparison - North America

11.4.1 US - Market size and forecast 2024-2029

Chart on US - Market size and forecast 2024-2029 ($ million)
Data Table on US - Market size and forecast 2024-2029 ($ million)
Chart on US - Year-over-year growth 2024-2029 (%)
Data Table on US - Year-over-year growth 2024-2029 (%)

11.4.2 Canada - Market size and forecast 2024-2029

Chart on Canada - Market size and forecast 2024-2029 ($ million)
Data Table on Canada - Market size and forecast 2024-2029 ($ million)
Chart on Canada - Year-over-year growth 2024-2029 (%)
Data Table on Canada - Year-over-year growth 2024-2029 (%)

11.5 Europe - Market size and forecast 2024-2029

Chart on Europe - Market size and forecast 2024-2029 ($ million)
Data Table on Europe - Market size and forecast 2024-2029 ($ million)
Chart on Europe - Year-over-year growth 2024-2029 (%)
Data Table on Europe - Year-over-year growth 2024-2029 (%)
Chart on Regional Comparison - Europe
Data Table on Regional Comparison - Europe

11.5.1 Germany - Market size and forecast 2024-2029

Chart on Germany - Market size and forecast 2024-2029 ($ million)
Data Table on Germany - Market size and forecast 2024-2029 ($ million)
Chart on Germany - Year-over-year growth 2024-2029 (%)
Data Table on Germany - Year-over-year growth 2024-2029 (%)

11.5.2 UK - Market size and forecast 2024-2029

Chart on UK - Market size and forecast 2024-2029 ($ million)
Data Table on UK - Market size and forecast 2024-2029 ($ million)
Chart on UK - Year-over-year growth 2024-2029 (%)
Data Table on UK - Year-over-year growth 2024-2029 (%)

11.5.3 France - Market size and forecast 2024-2029

Chart on France - Market size and forecast 2024-2029 ($ million)
Data Table on France - Market size and forecast 2024-2029 ($ million)
Chart on France - Year-over-year growth 2024-2029 (%)
Data Table on France - Year-over-year growth 2024-2029 (%)

11.6 Middle East and Africa - Market size and forecast 2024-2029

Chart on Middle East and Africa - Market size and forecast 2024-2029 ($ million)
Data Table on Middle East and Africa - Market size and forecast 2024-2029 ($ million)
Chart on Middle East and Africa - Year-over-year growth 2024-2029 (%)
Data Table on Middle East and Africa - Year-over-year growth 2024-2029 (%)
Chart on Regional Comparison - Middle East and Africa
Data Table on Regional Comparison - Middle East and Africa

11.6.1 Saudi Arabia - Market size and forecast 2024-2029

Chart on Saudi Arabia - Market size and forecast 2024-2029 ($ million)
Data Table on Saudi Arabia - Market size and forecast 2024-2029 ($ million)
Chart on Saudi Arabia - Year-over-year growth 2024-2029 (%)
Data Table on Saudi Arabia - Year-over-year growth 2024-2029 (%)

11.6.2 UAE - Market size and forecast 2024-2029

Chart on UAE - Market size and forecast 2024-2029 ($ million)
Data Table on UAE - Market size and forecast 2024-2029 ($ million)
Chart on UAE - Year-over-year growth 2024-2029 (%)
Data Table on UAE - Year-over-year growth 2024-2029 (%)

11.7 South America - Market size and forecast 2024-2029

Chart on South America - Market size and forecast 2024-2029 ($ million)
Data Table on South America - Market size and forecast 2024-2029 ($ million)
Chart on South America - Year-over-year growth 2024-2029 (%)
Data Table on South America - Year-over-year growth 2024-2029 (%)
Chart on Regional Comparison - South America
Data Table on Regional Comparison - South America

11.7.1 Brazil - Market size and forecast 2024-2029

Chart on Brazil - Market size and forecast 2024-2029 ($ million)
Data Table on Brazil - Market size and forecast 2024-2029 ($ million)
Chart on Brazil - Year-over-year growth 2024-2029 (%)
Data Table on Brazil - Year-over-year growth 2024-2029 (%)

11.7.2 Argentina - Market size and forecast 2024-2029

Chart on Argentina - Market size and forecast 2024-2029 ($ million)
Data Table on Argentina - Market size and forecast 2024-2029 ($ million)
Chart on Argentina - Year-over-year growth 2024-2029 (%)
Data Table on Argentina - Year-over-year growth 2024-2029 (%)

11.8 Market opportunity by geography

Market opportunity by geography ($ million)
Data Tables on Market opportunity by geography ($ million)

12. Drivers, Challenges, and Opportunity

12.1 Market drivers

Continued Integration within Industrial Automation
Enduring Requirement for robust, cost-effective communication in harsh and demanding environments
Sustained demand from niche and specialized applications requiring simple, low-data-rate connectivity

12.2 Market challenges

Increasing encroachment from industrial ethernet protocols
Inherent technical limitations and increasing integration complexity
Proliferation of low-power and flexible wireless communication technologies

12.3 Impact of drivers and challenges

Impact of drivers and challenges in 2024 and 2029

12.4 Market opportunities

Strategic integration with IIoT and edge computing for legacy system modernization
Proliferation in distributed and environmentally demanding niche applications
Accelerated miniaturization and enhanced on-chip functional integration

13. Competitive Landscape

13.1 Overview

13.2

Overview on criticality of inputs and factors of differentiation

13.3 Landscape disruption

Overview on factors of disruption

13.4 Industry risks

Impact of key risks on business

14. Competitive Analysis

14.1 Companies profiled

Companies covered

14.2 Company ranking index

14.3 Market positioning of companies

Matrix on companies position and classification

14.4 ABB Ltd.

ABB Ltd. - Overview
ABB Ltd. - Business segments
ABB Ltd. - Key news
ABB Ltd. - Key offerings
ABB Ltd. - Segment focus
SWOT

14.5 Danfoss AS

Danfoss AS - Overview
Danfoss AS - Product / Service
Danfoss AS - Key offerings
SWOT

14.6 Delta Electronics Inc.

Delta Electronics Inc. - Overview
Delta Electronics Inc. - Business segments
Delta Electronics Inc. - Key news
Delta Electronics Inc. - Key offerings
Delta Electronics Inc. - Segment focus
SWOT

14.7 Fuji Electric Co. Ltd.

Fuji Electric Co. Ltd. - Overview
Fuji Electric Co. Ltd. - Business segments
Fuji Electric Co. Ltd. - Key news
Fuji Electric Co. Ltd. - Key offerings
Fuji Electric Co. Ltd. - Segment focus
SWOT

14.8 Hamilton Co.

Hamilton Co. - Overview
Hamilton Co. - Product / Service
Hamilton Co. - Key offerings
SWOT

14.9 Mitsubishi Electric Corp.

Mitsubishi Electric Corp. - Overview
Mitsubishi Electric Corp. - Business segments
Mitsubishi Electric Corp. - Key offerings
Mitsubishi Electric Corp. - Segment focus
SWOT

14.10 Rockwell Automation Inc.

Rockwell Automation Inc. - Overview
Rockwell Automation Inc. - Business segments
Rockwell Automation Inc. - Key news
Rockwell Automation Inc. - Key offerings
Rockwell Automation Inc. - Segment focus
SWOT

14.11 Schneider Electric SE

Schneider Electric SE - Overview
Schneider Electric SE - Business segments
Schneider Electric SE - Key news
Schneider Electric SE - Key offerings
Schneider Electric SE - Segment focus
SWOT

14.12 Siemens AG

Siemens AG - Overview
Siemens AG - Business segments
Siemens AG - Key news
Siemens AG - Key offerings
Siemens AG - Segment focus
SWOT

14.13 Yaskawa Electric Corp.

Yaskawa Electric Corp. - Overview
Yaskawa Electric Corp. - Product / Service
Yaskawa Electric Corp. - Key news
Yaskawa Electric Corp. - Key offerings
SWOT

15. Appendix

15.1 Scope of the report

Market definition
Objectives
Notes and caveats

15.2 Inclusions and exclusions checklist

Inclusions checklist
Exclusions checklist

15.3 Currency conversion rates for US$

15.4 Research methodology

15.5 Data procurement

Information sources

15.6 Data validation

15.7 Validation techniques employed for market sizing

15.8 Data synthesis

15.9 360 degree market analysis

15.10 List of abbreviations

Research Methodology

Technavio presents a detailed picture of the market by way of study, synthesis, and summation of data from multiple sources. The analysts have presented the various facets of the market with a particular focus on identifying the key industry influencers. The data thus presented is comprehensive, reliable, and the result of extensive research, both primary and secondary.

INFORMATION SOURCES

Primary sources

  • Manufacturers and suppliers
  • Channel partners
  • Industry experts
  • Strategic decision makers

Secondary sources

  • Industry journals and periodicals
  • Government data
  • Financial reports of key industry players
  • Historical data
  • Press releases

DATA ANALYSIS

Data Synthesis

  • Collation of data
  • Estimation of key figures
  • Analysis of derived insights

Data Validation

  • Triangulation with data models
  • Reference against proprietary databases
  • Corroboration with industry experts

REPORT WRITING

Qualitative

  • Market drivers
  • Market challenges
  • Market trends
  • Five forces analysis

Quantitative

  • Market size and forecast
  • Market segmentation
  • Geographical insights
  • Competitive landscape

Interested in this report?

Get your sample now to see our research methodology and insights!

Download Now

Frequently Asked Questions

RS232, RS422, RS485 Drives market growth will increase by USD 364.8 million during 2025-2029.

The RS232, RS422, RS485 Drives market is expected to grow at a CAGR of 5.7% during 2025-2029.

RS232, RS422, RS485 Drives market is segmented by Type (RS-485 drives, RS-232 drives, Multi protocol drives, RS-422 drives) Application (Industrial automation and process control, Building automation, Utilities and energy, Transportation, Others) Product (Multi drop, Point to point, Half duplex, Full duplex)

ABB Ltd., Danfoss AS, Delta Electronics Inc., Fuji Electric Co. Ltd., Hamilton Co., Mitsubishi Electric Corp., Rockwell Automation Inc., Schneider Electric SE, Siemens AG, Yaskawa Electric Corp. are a few of the key vendors in the RS232, RS422, RS485 Drives market.

APAC will register the highest growth rate of 40.8% among the other regions. Therefore, the RS232, RS422, RS485 Drives market in APAC is expected to garner significant business opportunities for the vendors during the forecast period.

China, Japan, India, South Korea, Australia, US, Canada, Germany, UK, France, Saudi Arabia, UAE, Brazil, Argentina

  • Continued Integration within Industrial Automation is the driving factor this market.

The RS232, RS422, RS485 Drives market vendors should focus on grabbing business opportunities from the Type segment as it accounted for the largest market share in the base year.