Rolling Stock Market Analysis, Size, and Forecast 2025-2029: APAC (China, India, Japan, South Korea), Europe (France, Germany, Italy, The Netherlands, UK), North America (US), South America , and Middle East and Africa

Rolling Stock Market Analysis, Size, and Forecast 2025-2029:
APAC (China, India, Japan, South Korea), Europe (France, Germany, Italy, The Netherlands, UK), North America (US), South America , and Middle East and Africa

Published: Mar 2025 206 Pages SKU: IRTNTR76541

Market Overview at a Glance

$13.53 B
Market Opportunity
4.4%
CAGR
3.5
YoY growth 2024-2025(%)

Rolling Stock Market Size 2025-2029

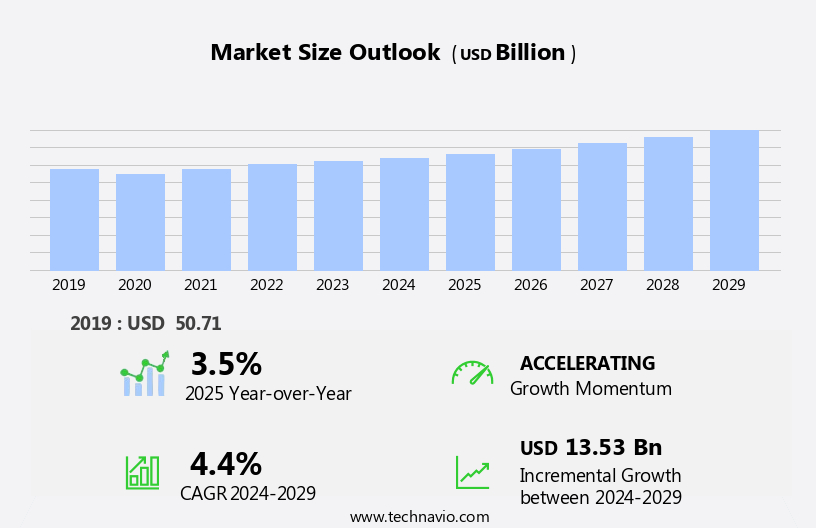
The rolling stock market size is forecast to increase by USD 13.53 billion, at a CAGR of 4.4% between 2024 and 2029.

  • The market is experiencing significant growth, driven by the rise in e-commerce and the increasing adoption of electrification and hybrid solutions in transportation. The e-commerce sector's expansion has led to a rise in demand for efficient and reliable logistics solutions, which rolling stock provides. Moreover, the shift towards sustainable and environmentally friendly transportation is fueling the market's growth, with electrification and hybrid solutions gaining popularity. However, the market faces challenges, including high capital costs in manufacturing. The integration of advanced technologies, such as automation and IoT, into rolling stock production, increases the initial investment required. Companies must navigate these challenges to capitalize on market opportunities and maintain competitiveness. To succeed, they must focus on cost reduction through operational efficiencies, strategic partnerships, and technology innovation. By addressing these challenges, manufacturers can tap into the market's potential and meet the evolving demands of customers.

What will be the size of the Rolling Stock Market during the forecast period?

Rolling Stock Market Size

 Request Free Sample

  • The market encompasses the design, manufacturing, maintenance, and operation of vehicles used for transporting passengers and freight on railway networks. This market is driven by various factors, including the demand for efficient and sustainable transportation solutions in the energy sector. With the increasing focus on electricity and reducing carbon emissions, the electrification of railway systems is gaining momentum. Mechanical brakes are being gradually replaced by more energy-efficient and environmentally friendly electric brakes. Additionally, the adoption of hydrogen fuel as a cleaner alternative to traditional diesel engines is a significant trend in the market.
  • The market is expected to grow steadily due to the increasing demand for greener transportation options and the expansion of railway networks and rail service facilities. Railway telematics, which enable real-time monitoring and optimization of rail travel, are also gaining popularity due to their potential to improve efficiency and reduce costs. Overall, the market is poised for growth as it plays a crucial role in the transition towards more sustainable and efficient energy systems.

How is this Rolling Stock Industry segmented?

The report provides comprehensive data (region-wise segment analysis), with forecasts and estimates in "USD billion" for the period 2025-2029, as well as historical data from 2019-2023 for the following segments.

  • Application
    • Rail freight
    • Rail passenger
  • Type
    • Diesel
    • Electric
    • Electro-diesel
  • Product
    • Locomotive
    • Rapid transit vehicle
    • Wagon
  • Geography
    • APAC
      • China
      • India
      • Japan
      • South Korea
    • Europe
      • France
      • Germany
      • Italy
      • The Netherlands
      • UK
    • North America
      • US
    • South America
    • Middle East and Africa

By Application Insights

The rail freight segment is estimated to witness significant growth during the forecast period. The rail transportation sector experiences significant demand due to the close correlation with economic activity and the need for efficient freight transport. Industries such as agriculture, mining, energy, and manufacturing rely heavily on rail freight for transporting raw materials and finished products. The expansion and modernization of rail networks, including the construction of new lines and upgrading of existing tracks, necessitate additional rolling stock, including locomotives, freight cars, and maintenance equipment. The types and quantities of commodities transported influence the demand. Furthermore, the shift towards greener transportation and decarbonization initiatives has led to an increased focus on energy-efficient rolling stock, such as electric-based and battery-operated rail vehicles.

Energy conservation technologies, including mechanical brakes, hydrogen fuel, and EV charging infrastructure, are also gaining traction. Urban planners and city infrastructure developers are investing in rapid transit systems, tramways, and high-speed trains to provide affordable and eco-friendly transportation options for commuters. The OEMs and rail operators are responding to these trends by offering energy-efficient rolling stock, onboard Wi-Fi, predictive maintenance, data analytics, sensors and train systems control centers. The metro segment is expected to witness significant growth due to the increasing urbanization and population growth in cities. The rail services facilities market is also expected to grow due to the increasing demand for rail transportation and the need for maintenance and repair services.

Rolling Stock Market Size

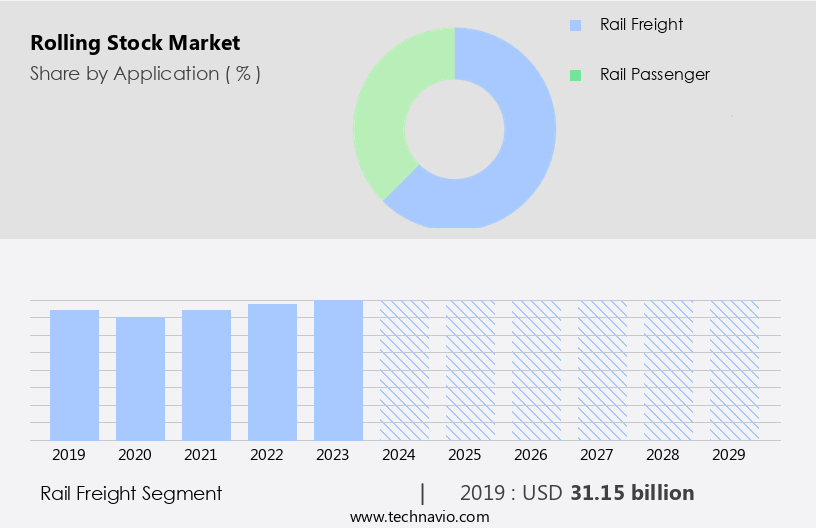
Get a glance at the market report of share of various segments Request Free Sample

The rail freight segment was valued at USD 31.15 billion in 2019 and showed a gradual increase during the forecast period.

Regional Analysis

APAC is estimated to contribute 52% to the growth of the global market during the forecast period. Technavio's analysts have elaborately explained the regional trends and drivers that shape the market during the forecast period.

Rolling Stock Market Share by Geography

For more insights on the market size of various regions, Request Free Sample

The Asia-Pacific (APAC) region's diverse economies and urbanization patterns fuel the growth of the market. Urbanization in APAC countries, such as China, Japan, and South Korea, drives demand for efficient urban transit systems, including subways, light rail, and commuter trains. High-speed rail networks, a necessity for many APAC countries due to extensive trade and logistics networks, necessitate the production of specialized rolling stock. Incorporating energy-efficient technologies, such as electric-based and hydrogen fuel cells, contributes to decarbonization efforts and eco-friendly transportation. 

Original Equipment Manufacturers (OEMs) and rail operators collaborate to provide energy-efficient, technologically advanced solutions, including onboard Wi-Fi, predictive maintenance, and sensors for data analytics. Rapid transit systems, including low-floor trains and trams, cater to the affordability and accessibility needs of commuters. The integration of computer vision, railway telematics, and control centers enhances rail services facilities, improving the overall rail travel experience. The APAC market encompasses passenger rails, freight trains, and railway infrastructure, including rapid transit vehicles, railway freight transport, and railway services facilities.

Market Dynamics

Our researchers analyzed the data with 2024 as the base year, along with the key drivers, trends, and challenges. A holistic analysis of drivers will help companies refine their marketing strategies to gain a competitive advantage.

What are the key market drivers leading to the rise in the adoption of Rolling Stock Industry?

  • Growing e-commerce boosting rolling stock market is the key driver of the market.  The market experiences growth due to the increasing demand for efficient transportation solutions, particularly in freight transportation. The rise of e-commerce is a significant factor driving this demand, as more consumers shop online and expect faster delivery times. 
  • In response, e-commerce companies are building distribution centers and warehouses closer to urban areas to streamline their logistics operations. Rail transportation plays a vital role in moving goods between these hubs, offering a cost-effective and eco-friendly alternative to trucking and air freight. As e-commerce continues to expand, the need for reliable and efficient rolling stock solutions will only increase.

What are the market trends shaping the Rolling Stock Industry?

  • Electrification and hybrid solutions is the upcoming market trend. The market is witnessing a significant shift towards electrification and hybrid solutions to address environmental concerns and enhance energy efficiency. Electrified railways, including high-speed and urban transit systems, are gaining popularity due to their lower greenhouse gas emissions compared to diesel-powered counterparts. High-speed rail networks, which are typically electrified for efficiency and speed, are expanding in regions such as Europe and Asia, fueling the demand for advanced electric rolling stock.  
  • Hybrid locomotives, which combine diesel and electric power, are also becoming increasingly common. This trend aligns with global efforts to reduce carbon footprints and combat climate change, making electric rolling stock a preferred choice for sustainable transportation solutions. The demand is expected to increase as environmental concerns intensify.

What challenges does the Rolling Stock Industry face during its growth?

  • High capital costs in rolling stock manufacturing are a key challenge affecting the industry growth. The market encompasses the manufacturing and procurement of specialized vehicles for passenger and freight services. The industry involves significant capital investments, posing a financial barrier for new entrants and challenging rail operators. The production necessitates advanced technology, precision engineering, and skilled labor, contributing to high costs. Safety is a paramount concern in this sector, necessitating compliance with stringent regulations and standards.
  • Meeting these requirements often involves the use of costly specialized materials and components. The engineering and design complexity necessitates a high level of expertise, further increasing production costs. The market demands substantial investments and advanced technology, making it a challenging industry. The importance of safety and regulatory compliance adds to the costs, highlighting the need for efficient manufacturing processes and cost management strategies.

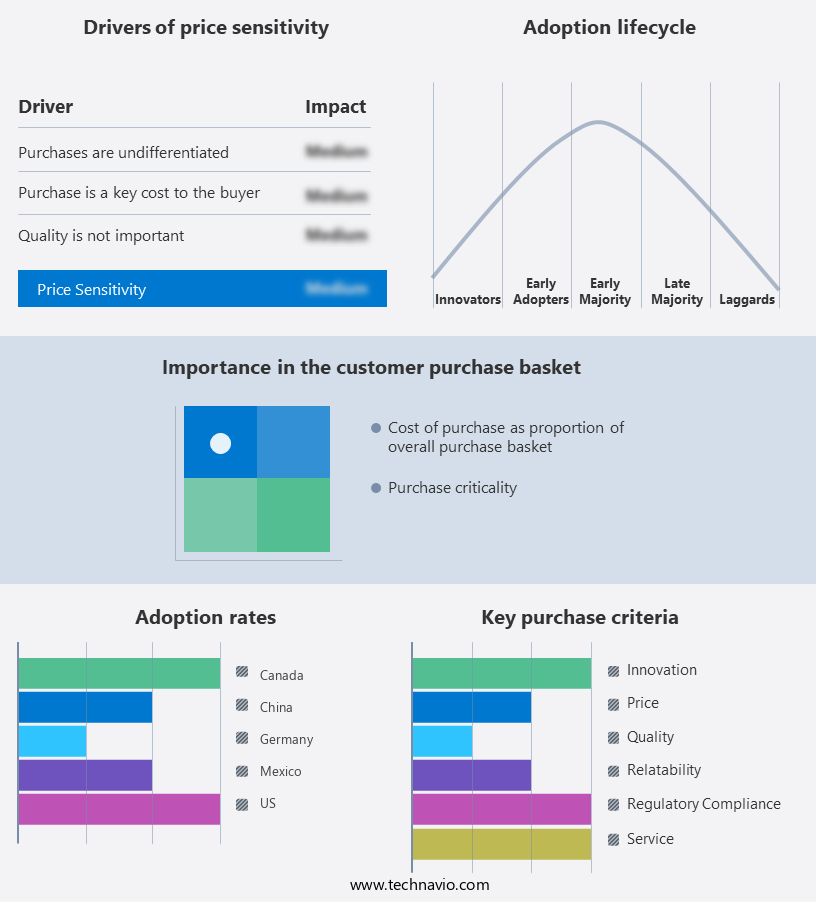
Exclusive Customer Landscape

The market forecasting report includes the adoption lifecycle of the market, covering from the innovator's stage to the laggard's stage. It focuses on adoption rates in different regions based on penetration. Furthermore, the market report also includes key purchase criteria and drivers of price sensitivity to help companies evaluate and develop their market growth analysis strategies.

Rolling Stock Market Share by Geography

 Customer Landscape

Key Companies & Market Insights

Companies are implementing various strategies, such as strategic alliances, market forecast, partnerships, mergers and acquisitions, geographical expansion, and product/service launches, to enhance their presence in the industry.

ALSTOM SA - The company offers rolling stock products for rail industry.

The industry research and growth report includes detailed analyses of the competitive landscape of the market and information about key companies, including:

  • Caterpillar Inc.
  • Central Japan Railway Co.
  • CONSTRUCCIONES Y AUXILIAR DE FERROCARRILES S.A.
  • CRRC Corp. Ltd.
  • Hitachi Ltd.
  • Hyundai Motor Co.
  • IHI Corp.
  • Kawasaki Heavy Industries Ltd.
  • MAPNA Group Co.
  • PATENTES TALGO S.L.U.
  • Pesa Group
  • PPF Group
  • Siemens AG
  • Stadler Rail Ag
  • Tatravagonka a.s. Poprad
  • The Greenbrier Companies Inc.
  • The Kinki Sharyo Co. Ltd.
  • Trinity Industries Inc.
  • Westinghouse Air Brake Technologies Corp.

Qualitative and quantitative analysis of companies has been conducted to help clients understand the wider business environment as well as the strengths and weaknesses of key industry players. Data is qualitatively analyzed to categorize companies as pure play, category-focused, industry-focused, and diversified; it is quantitatively analyzed to categorize companies as dominant, leading, strong, tentative, and weak.

Research Analyst Overview

The market encompasses the design, manufacturing, and maintenance of rail vehicles, including passenger trains and freight trains. This sector plays a crucial role in the transportation industry, providing an alternative to traditional road and air transportation. The demand is driven by several factors, including the need for greener transportation, urban infrastructure development, and decarbonization efforts. Energy conservation is a significant trend in the market. Electricity, hydrogen fuel, and battery-operated are gaining popularity due to their lower carbon emissions and energy efficiency. Mechanical brakes are being replaced with more advanced systems, such as regenerative braking, to reduce energy consumption and improve overall performance.

Further, the transportation sector, including rolling stock, is undergoing a transformation to meet the demands of urban planners and commuters for affordable and efficient transportation. Rapid transit systems, tramways, and high-speed trains are becoming increasingly common in cities around the world. Refurbishing existing rolling stock fleets is also a popular solution for rail operators looking to extend the life of their assets while maintaining affordability. Decarbonization is a major focus in the rail industry, with a shift towards electric-based rolling stock and the electrification of railway infrastructure. Diesel-based rolling stock is being phased out due to its high carbon emissions.

In addition, passenger rails and freight trains are essential components of the transportation network, with daily commuting and railway freight transport relying heavily on these modes of transport. Rail services facilities, such as control centers and train systems, are becoming more advanced, with the integration of computer vision, railway telematics, and predictive maintenance. Sensors and data analytics are used to optimize train performance, reduce downtime, and improve safety. The metro segment is a growing area of focus in the market, with eco-friendly transport solutions, such as electric trains and high-speed rail networks, gaining popularity. The global warming crisis has highlighted the importance of reducing carbon emissions, and the rail industry is responding by investing in energy-efficient rolling stock and infrastructure.

Market Scope

Report Coverage

Details

Page number

206

Base year

2024

Historic period

2019-2023

Forecast period

2025-2029

Growth momentum & CAGR

Accelerate at a CAGR of 4.4%

Market Growth 2025-2029

USD 13.53 billion

Market structure

Fragmented

YoY growth 2024-2025(%)

3.5

Key countries

US, China, Japan, India, UK, South Korea, Germany, France, Italy, The Netherlands,

Competitive landscape

Leading Companies, Market Positioning of Companies, Competitive Strategies, and Industry Risks

Request Free Sample

What are the Key Data Covered in this Rolling Stock Market Research and Growth Report?

  • CAGR of the Rolling Stock industry during the forecast period
  • Detailed information on factors that will drive the market growth and forecasting between 2025 and 2029
  • Precise estimation of the size of the market and its contribution of the industry in focus to the parent market
  • Accurate predictions about upcoming growth and trends and changes in consumer behaviour
  • Growth of the market across APAC, Europe, North America, South America, Middle East and Africa,
  • Thorough analysis of the market's competitive landscape and detailed information about companies
  • Comprehensive analysis of factors that will challenge the rolling stock market growth of industry companies

We can help! Our analysts can customize this rolling stock market research report to meet your requirements.

Get in touch

1 Executive Summary

  • 1.1 Market overview
    • Executive Summary - Chart on Market Overview
    • Executive Summary - Data Table on Market Overview
    • Executive Summary - Chart on Global Market Characteristics
    • Executive Summary - Chart on Market by Geography
    • Executive Summary - Chart on Market Segmentation by Application
    • Executive Summary - Chart on Market Segmentation by Type
    • Executive Summary - Chart on Market Segmentation by Product
    • Executive Summary - Chart on Incremental Growth
    • Executive Summary - Data Table on Incremental Growth
    • Executive Summary - Chart on Company Market Positioning

2 Technavio Analysis

  • 2.1 Analysis of price sensitivity, lifecycle, customer purchase basket, adoption rates, and purchase criteria
    • Analysis of price sensitivity, lifecycle, customer purchase basket, adoption rates, and purchase criteria
  • 2.2 Criticality of inputs and Factors of differentiation
    • Overview on criticality of inputs and factors of differentiation
  • 2.3 Factors of disruption
    • Overview on factors of disruption
  • 2.4 Impact of drivers and challenges
    • Impact of drivers and challenges in 2024 and 2029

3 Market Landscape

  • 3.1 Market ecosystem
    • Parent Market
    • Data Table on - Parent Market
  • 3.2 Market characteristics
    • Market characteristics analysis
  • 3.3 Value chain analysis
    • Value chain analysis

4 Market Sizing

  • 4.1 Market definition
    • Offerings of companies included in the market definition
  • 4.2 Market segment analysis
    • Market segments
  • 4.3 Market size 2024
    • 4.4 Market outlook: Forecast for 2024-2029
      • Chart on Global - Market size and forecast 2024-2029 ($ million)
      • Data Table on Global - Market size and forecast 2024-2029 ($ million)
      • Chart on Global Market: Year-over-year growth 2024-2029 (%)
      • Data Table on Global Market: Year-over-year growth 2024-2029 (%)

    5 Historic Market Size

    • 5.1 Global Rolling Stock Market 2019 - 2023
      • Historic Market Size - Data Table on Global Rolling Stock Market 2019 - 2023 ($ million)
    • 5.2 Application segment analysis 2019 - 2023
      • Historic Market Size - Application Segment 2019 - 2023 ($ million)
    • 5.3 Type segment analysis 2019 - 2023
      • Historic Market Size - Type Segment 2019 - 2023 ($ million)
    • 5.4 Product segment analysis 2019 - 2023
      • Historic Market Size - Product Segment 2019 - 2023 ($ million)
    • 5.5 Geography segment analysis 2019 - 2023
      • Historic Market Size - Geography Segment 2019 - 2023 ($ million)
    • 5.6 Country segment analysis 2019 - 2023
      • Historic Market Size - Country Segment 2019 - 2023 ($ million)

    6 Qualitative Analysis

    • 6.1 Impact of AI in the Global Rolling Stock Market

      7 Five Forces Analysis

      • 7.1 Five forces summary
        • Five forces analysis - Comparison between 2024 and 2029
      • 7.2 Bargaining power of buyers
        • Bargaining power of buyers - Impact of key factors 2024 and 2029
      • 7.3 Bargaining power of suppliers
        • Bargaining power of suppliers - Impact of key factors in 2024 and 2029
      • 7.4 Threat of new entrants
        • Threat of new entrants - Impact of key factors in 2024 and 2029
      • 7.5 Threat of substitutes
        • Threat of substitutes - Impact of key factors in 2024 and 2029
      • 7.6 Threat of rivalry
        • Threat of rivalry - Impact of key factors in 2024 and 2029
      • 7.7 Market condition
        • Chart on Market condition - Five forces 2024 and 2029

      8 Market Segmentation by Application

      • 8.1 Market segments
        • Chart on Application - Market share 2024-2029 (%)
        • Data Table on Application - Market share 2024-2029 (%)
      • 8.2 Comparison by Application
        • Chart on Comparison by Application
        • Data Table on Comparison by Application
      • 8.3 Rail freight - Market size and forecast 2024-2029
        • Chart on Rail freight - Market size and forecast 2024-2029 ($ million)
        • Data Table on Rail freight - Market size and forecast 2024-2029 ($ million)
        • Chart on Rail freight - Year-over-year growth 2024-2029 (%)
        • Data Table on Rail freight - Year-over-year growth 2024-2029 (%)
      • 8.4 Rail passenger - Market size and forecast 2024-2029
        • Chart on Rail passenger - Market size and forecast 2024-2029 ($ million)
        • Data Table on Rail passenger - Market size and forecast 2024-2029 ($ million)
        • Chart on Rail passenger - Year-over-year growth 2024-2029 (%)
        • Data Table on Rail passenger - Year-over-year growth 2024-2029 (%)
      • 8.5 Market opportunity by Application
        • Market opportunity by Application ($ million)
        • Data Table on Market opportunity by Application ($ million)

      9 Market Segmentation by Type

      • 9.1 Market segments
        • Chart on Type - Market share 2024-2029 (%)
        • Data Table on Type - Market share 2024-2029 (%)
      • 9.2 Comparison by Type
        • Chart on Comparison by Type
        • Data Table on Comparison by Type
      • 9.3 Diesel - Market size and forecast 2024-2029
        • Chart on Diesel - Market size and forecast 2024-2029 ($ million)
        • Data Table on Diesel - Market size and forecast 2024-2029 ($ million)
        • Chart on Diesel - Year-over-year growth 2024-2029 (%)
        • Data Table on Diesel - Year-over-year growth 2024-2029 (%)
      • 9.4 Electric - Market size and forecast 2024-2029
        • Chart on Electric - Market size and forecast 2024-2029 ($ million)
        • Data Table on Electric - Market size and forecast 2024-2029 ($ million)
        • Chart on Electric - Year-over-year growth 2024-2029 (%)
        • Data Table on Electric - Year-over-year growth 2024-2029 (%)
      • 9.5 Electro-diesel - Market size and forecast 2024-2029
        • Chart on Electro-diesel - Market size and forecast 2024-2029 ($ million)
        • Data Table on Electro-diesel - Market size and forecast 2024-2029 ($ million)
        • Chart on Electro-diesel - Year-over-year growth 2024-2029 (%)
        • Data Table on Electro-diesel - Year-over-year growth 2024-2029 (%)
      • 9.6 Market opportunity by Type
        • Market opportunity by Type ($ million)
        • Data Table on Market opportunity by Type ($ million)

      10 Market Segmentation by Product

      • 10.1 Market segments
        • Chart on Product - Market share 2024-2029 (%)
        • Data Table on Product - Market share 2024-2029 (%)
      • 10.2 Comparison by Product
        • Chart on Comparison by Product
        • Data Table on Comparison by Product
      • 10.3 Locomotive - Market size and forecast 2024-2029
        • Chart on Locomotive - Market size and forecast 2024-2029 ($ million)
        • Data Table on Locomotive - Market size and forecast 2024-2029 ($ million)
        • Chart on Locomotive - Year-over-year growth 2024-2029 (%)
        • Data Table on Locomotive - Year-over-year growth 2024-2029 (%)
      • 10.4 Rapid transit vehicle - Market size and forecast 2024-2029
        • Chart on Rapid transit vehicle - Market size and forecast 2024-2029 ($ million)
        • Data Table on Rapid transit vehicle - Market size and forecast 2024-2029 ($ million)
        • Chart on Rapid transit vehicle - Year-over-year growth 2024-2029 (%)
        • Data Table on Rapid transit vehicle - Year-over-year growth 2024-2029 (%)
      • 10.5 Wagon - Market size and forecast 2024-2029
        • Chart on Wagon - Market size and forecast 2024-2029 ($ million)
        • Data Table on Wagon - Market size and forecast 2024-2029 ($ million)
        • Chart on Wagon - Year-over-year growth 2024-2029 (%)
        • Data Table on Wagon - Year-over-year growth 2024-2029 (%)
      • 10.6 Market opportunity by Product
        • Market opportunity by Product ($ million)
        • Data Table on Market opportunity by Product ($ million)

      11 Customer Landscape

      • 11.1 Customer landscape overview
        • Analysis of price sensitivity, lifecycle, customer purchase basket, adoption rates, and purchase criteria

      12 Geographic Landscape

      • 12.1 Geographic segmentation
        • Chart on Market share by geography 2024-2029 (%)
        • Data Table on Market share by geography 2024-2029 (%)
      • 12.2 Geographic comparison
        • Chart on Geographic comparison
        • Data Table on Geographic comparison
      • 12.3 APAC - Market size and forecast 2024-2029
        • Chart on APAC - Market size and forecast 2024-2029 ($ million)
        • Data Table on APAC - Market size and forecast 2024-2029 ($ million)
        • Chart on APAC - Year-over-year growth 2024-2029 (%)
        • Data Table on APAC - Year-over-year growth 2024-2029 (%)
      • 12.4 Europe - Market size and forecast 2024-2029
        • Chart on Europe - Market size and forecast 2024-2029 ($ million)
        • Data Table on Europe - Market size and forecast 2024-2029 ($ million)
        • Chart on Europe - Year-over-year growth 2024-2029 (%)
        • Data Table on Europe - Year-over-year growth 2024-2029 (%)
      • 12.5 North America - Market size and forecast 2024-2029
        • Chart on North America - Market size and forecast 2024-2029 ($ million)
        • Data Table on North America - Market size and forecast 2024-2029 ($ million)
        • Chart on North America - Year-over-year growth 2024-2029 (%)
        • Data Table on North America - Year-over-year growth 2024-2029 (%)
      • 12.6 South America - Market size and forecast 2024-2029
        • Chart on South America - Market size and forecast 2024-2029 ($ million)
        • Data Table on South America - Market size and forecast 2024-2029 ($ million)
        • Chart on South America - Year-over-year growth 2024-2029 (%)
        • Data Table on South America - Year-over-year growth 2024-2029 (%)
      • 12.7 Middle East and Africa - Market size and forecast 2024-2029
        • Chart on Middle East and Africa - Market size and forecast 2024-2029 ($ million)
        • Data Table on Middle East and Africa - Market size and forecast 2024-2029 ($ million)
        • Chart on Middle East and Africa - Year-over-year growth 2024-2029 (%)
        • Data Table on Middle East and Africa - Year-over-year growth 2024-2029 (%)
      • 12.8 US - Market size and forecast 2024-2029
        • Chart on US - Market size and forecast 2024-2029 ($ million)
        • Data Table on US - Market size and forecast 2024-2029 ($ million)
        • Chart on US - Year-over-year growth 2024-2029 (%)
        • Data Table on US - Year-over-year growth 2024-2029 (%)
      • 12.9 China - Market size and forecast 2024-2029
        • Chart on China - Market size and forecast 2024-2029 ($ million)
        • Data Table on China - Market size and forecast 2024-2029 ($ million)
        • Chart on China - Year-over-year growth 2024-2029 (%)
        • Data Table on China - Year-over-year growth 2024-2029 (%)
      • 12.10 Japan - Market size and forecast 2024-2029
        • Chart on Japan - Market size and forecast 2024-2029 ($ million)
        • Data Table on Japan - Market size and forecast 2024-2029 ($ million)
        • Chart on Japan - Year-over-year growth 2024-2029 (%)
        • Data Table on Japan - Year-over-year growth 2024-2029 (%)
      • 12.11 India - Market size and forecast 2024-2029
        • Chart on India - Market size and forecast 2024-2029 ($ million)
        • Data Table on India - Market size and forecast 2024-2029 ($ million)
        • Chart on India - Year-over-year growth 2024-2029 (%)
        • Data Table on India - Year-over-year growth 2024-2029 (%)
      • 12.12 UK - Market size and forecast 2024-2029
        • Chart on UK - Market size and forecast 2024-2029 ($ million)
        • Data Table on UK - Market size and forecast 2024-2029 ($ million)
        • Chart on UK - Year-over-year growth 2024-2029 (%)
        • Data Table on UK - Year-over-year growth 2024-2029 (%)
      • 12.13 Germany - Market size and forecast 2024-2029
        • Chart on Germany - Market size and forecast 2024-2029 ($ million)
        • Data Table on Germany - Market size and forecast 2024-2029 ($ million)
        • Chart on Germany - Year-over-year growth 2024-2029 (%)
        • Data Table on Germany - Year-over-year growth 2024-2029 (%)
      • 12.14 South Korea - Market size and forecast 2024-2029
        • Chart on South Korea - Market size and forecast 2024-2029 ($ million)
        • Data Table on South Korea - Market size and forecast 2024-2029 ($ million)
        • Chart on South Korea - Year-over-year growth 2024-2029 (%)
        • Data Table on South Korea - Year-over-year growth 2024-2029 (%)
      • 12.15 France - Market size and forecast 2024-2029
        • Chart on France - Market size and forecast 2024-2029 ($ million)
        • Data Table on France - Market size and forecast 2024-2029 ($ million)
        • Chart on France - Year-over-year growth 2024-2029 (%)
        • Data Table on France - Year-over-year growth 2024-2029 (%)
      • 12.16 Italy - Market size and forecast 2024-2029
        • Chart on Italy - Market size and forecast 2024-2029 ($ million)
        • Data Table on Italy - Market size and forecast 2024-2029 ($ million)
        • Chart on Italy - Year-over-year growth 2024-2029 (%)
        • Data Table on Italy - Year-over-year growth 2024-2029 (%)
      • 12.17 The Netherlands - Market size and forecast 2024-2029
        • Chart on The Netherlands - Market size and forecast 2024-2029 ($ million)
        • Data Table on The Netherlands - Market size and forecast 2024-2029 ($ million)
        • Chart on The Netherlands - Year-over-year growth 2024-2029 (%)
        • Data Table on The Netherlands - Year-over-year growth 2024-2029 (%)
      • 12.18 Market opportunity by geography
        • Market opportunity by geography ($ million)
        • Data Tables on Market opportunity by geography ($ million)

      13 Drivers, Challenges, and Opportunity/Restraints

      • 13.1 Market drivers
        • 13.2 Market challenges
          • 13.3 Impact of drivers and challenges
            • Impact of drivers and challenges in 2024 and 2029
          • 13.4 Market opportunities/restraints

            14 Competitive Landscape

            • 14.1 Overview
              • 14.2 Competitive Landscape
                • Overview on criticality of inputs and factors of differentiation
              • 14.3 Landscape disruption
                • Overview on factors of disruption
              • 14.4 Industry risks
                • Impact of key risks on business

              15 Competitive Analysis

              • 15.1 Companies profiled
                • Companies covered
              • 15.2 Company ranking index
                • Company ranking index
              • 15.3 Market positioning of companies
                • Matrix on companies position and classification
              • 15.4 ALSTOM SA
                • ALSTOM SA - Overview
                • ALSTOM SA - Business segments
                • ALSTOM SA - Key offerings
                • ALSTOM SA - Segment focus
                • SWOT
              • 15.5 Caterpillar Inc.
                • Caterpillar Inc. - Overview
                • Caterpillar Inc. - Business segments
                • Caterpillar Inc. - Key news
                • Caterpillar Inc. - Key offerings
                • Caterpillar Inc. - Segment focus
                • SWOT
              • 15.6 Central Japan Railway Co.
                • Central Japan Railway Co. - Overview
                • Central Japan Railway Co. - Product / Service
                • Central Japan Railway Co. - Key offerings
                • SWOT
              • 15.7 CONSTRUCCIONES Y AUXILIAR DE FERROCARRILES S.A.
                • CONSTRUCCIONES Y AUXILIAR DE FERROCARRILES S.A. - Overview
                • CONSTRUCCIONES Y AUXILIAR DE FERROCARRILES S.A. - Product / Service
                • CONSTRUCCIONES Y AUXILIAR DE FERROCARRILES S.A. - Key offerings
                • SWOT
              • 15.8 CRRC Corp. Ltd.
                • CRRC Corp. Ltd. - Overview
                • CRRC Corp. Ltd. - Product / Service
                • CRRC Corp. Ltd. - Key offerings
                • SWOT
              • 15.9 Hitachi Ltd.
                • Hitachi Ltd. - Overview
                • Hitachi Ltd. - Business segments
                • Hitachi Ltd. - Key news
                • Hitachi Ltd. - Key offerings
                • Hitachi Ltd. - Segment focus
                • SWOT
              • 15.10 Hyundai Motor Co.
                • Hyundai Motor Co. - Overview
                • Hyundai Motor Co. - Business segments
                • Hyundai Motor Co. - Key news
                • Hyundai Motor Co. - Key offerings
                • Hyundai Motor Co. - Segment focus
                • SWOT
              • 15.11 IHI Corp.
                • IHI Corp. - Overview
                • IHI Corp. - Business segments
                • IHI Corp. - Key offerings
                • IHI Corp. - Segment focus
                • SWOT
              • 15.12 Kawasaki Heavy Industries Ltd.
                • Kawasaki Heavy Industries Ltd. - Overview
                • Kawasaki Heavy Industries Ltd. - Business segments
                • Kawasaki Heavy Industries Ltd. - Key news
                • Kawasaki Heavy Industries Ltd. - Key offerings
                • Kawasaki Heavy Industries Ltd. - Segment focus
                • SWOT
              • 15.13 MAPNA Group Co.
                • MAPNA Group Co. - Overview
                • MAPNA Group Co. - Product / Service
                • MAPNA Group Co. - Key offerings
                • SWOT
              • 15.14 PATENTES TALGO S.L.U.
                • PATENTES TALGO S.L.U. - Overview
                • PATENTES TALGO S.L.U. - Product / Service
                • PATENTES TALGO S.L.U. - Key offerings
                • SWOT
              • 15.15 Pesa Group
                • Pesa Group - Overview
                • Pesa Group - Product / Service
                • Pesa Group - Key offerings
                • SWOT
              • 15.16 Siemens AG
                • Siemens AG - Overview
                • Siemens AG - Business segments
                • Siemens AG - Key news
                • Siemens AG - Key offerings
                • Siemens AG - Segment focus
                • SWOT
              • 15.17 Stadler Rail Ag
                • Stadler Rail Ag - Overview
                • Stadler Rail Ag - Business segments
                • Stadler Rail Ag - Key offerings
                • Stadler Rail Ag - Segment focus
                • SWOT
              • 15.18 Westinghouse Air Brake Technologies Corp.
                • Westinghouse Air Brake Technologies Corp. - Overview
                • Westinghouse Air Brake Technologies Corp. - Business segments
                • Westinghouse Air Brake Technologies Corp. - Key offerings
                • Westinghouse Air Brake Technologies Corp. - Segment focus
                • SWOT

              16 Appendix

              • 16.1 Scope of the report
                • 16.2 Inclusions and exclusions checklist
                  • Inclusions checklist
                  • Exclusions checklist
                • 16.3 Currency conversion rates for US$
                  • Currency conversion rates for US$
                • 16.4 Research methodology
                  • Research methodology
                • 16.5 Data procurement
                  • Information sources
                • 16.6 Data validation
                  • Data validation
                • 16.7 Validation techniques employed for market sizing
                  • Validation techniques employed for market sizing
                • 16.8 Data synthesis
                  • Data synthesis
                • 16.9 360 degree market analysis
                  • 360 degree market analysis
                • 16.10 List of abbreviations
                  • List of abbreviations

                Research Methodology

                Technavio presents a detailed picture of the market by way of study, synthesis, and summation of data from multiple sources. The analysts have presented the various facets of the market with a particular focus on identifying the key industry influencers. The data thus presented is comprehensive, reliable, and the result of extensive research, both primary and secondary.

                INFORMATION SOURCES

                Primary sources

                • Manufacturers and suppliers
                • Channel partners
                • Industry experts
                • Strategic decision makers

                Secondary sources

                • Industry journals and periodicals
                • Government data
                • Financial reports of key industry players
                • Historical data
                • Press releases

                DATA ANALYSIS

                Data Synthesis

                • Collation of data
                • Estimation of key figures
                • Analysis of derived insights

                Data Validation

                • Triangulation with data models
                • Reference against proprietary databases
                • Corroboration with industry experts

                REPORT WRITING

                Qualitative

                • Market drivers
                • Market challenges
                • Market trends
                • Five forces analysis

                Quantitative

                • Market size and forecast
                • Market segmentation
                • Geographical insights
                • Competitive landscape

                Interested in this report?

                Get your sample now to see our research methodology and insights!

                Download Now

                Frequently Asked Questions

                Rolling Stock market growth will increase by 13528.3 million during 2025-2029.

                The Rolling Stock market is expected to grow at a CAGR of 4.4% during 2025-2029.

                Rolling Stock market is segmented by Application( Rail freight, Rail passenger) Type( Diesel, Electric, Electro-diesel) Product( Locomotive, Rapid transit vehicle, Wagon, South America, Middle East and Africa)

                ALSTOM SA, Caterpillar Inc., Central Japan Railway Co., CONSTRUCCIONES Y AUXILIAR DE FERROCARRILES S.A., CRRC Corp. Ltd., Hitachi Ltd., Hyundai Motor Co., IHI Corp., Kawasaki Heavy Industries Ltd., MAPNA Group Co., PATENTES TALGO S.L.U., Pesa Group, PPF Group, Siemens AG, Stadler Rail Ag, Tatravagonka a.s. Poprad, The Greenbrier Companies Inc., The Kinki Sharyo Co. Ltd., Trinity Industries Inc., Westinghouse Air Brake Technologies Corp. are a few of the key vendors in the Rolling Stock market.

                APAC will register the highest growth rate of 52.1% among the other regions. Therefore, the Rolling Stock market in APAC is expected to garner significant business opportunities for the vendors during the forecast period.

                US, China, Japan, India, UK, South Korea, Germany, France, Italy, The Netherlands

                • Growing e-commerce boosting rolling stockThe growth of e-commerce is a significant driver that has the potential to boost the global rolling stock market is the driving factor this market.
                • particularly in the context of freight transportation. E-commerce has led to a surge in the movement of goods as more consumers shop online. This has resulted in higher demand for transportation services is the driving factor this market.
                • including rail freight is the driving factor this market.
                • to move products from distribution centers to consumers. To meet the demand for faster delivery times is the driving factor this market.
                • e-commerce companies are building more distribution centers and warehouses closer to urban centers. Rail transportation can play a crucial role in efficiently moving goods between these distribution hubs. E-commerce logistics often involve multiple modes of transportation is the driving factor this market.
                • including rail is the driving factor this market.
                • trucking is the driving factor this market.
                • and air freight. Railroads are an integral part of intermodal transportation networks is the driving factor this market.
                • facilitating the movement of goods over long distances. The rise of e-commerce has spurred innovation and competition in the transportation and logistics sectors. This can lead to the development of new rolling stock technologies and services to meet the evolving needs of e-commerce is the driving factor this market.
                • which will have a positive impact on the growth of the global rolling stock market during the forecast period. is the driving factor this market.

                The Rolling Stock market vendors should focus on grabbing business opportunities from the Rail freight segment as it accounted for the largest market share in the base year.