Retransfer Card Printers Market Analysis, Size, and Forecast 2026-2030: North America (US, Canada, and Mexico), Europe (Germany, UK, and France), APAC (China, Japan, and India), South America (Brazil and Argentina), Middle East and Africa (Saudi Arabia, UAE, and South Africa), and Rest of World (ROW)

Retransfer Card Printers Market Analysis, Size, and Forecast 2026-2030:
North America (US, Canada, and Mexico), Europe (Germany, UK, and France), APAC (China, Japan, and India), South America (Brazil and Argentina), Middle East and Africa (Saudi Arabia, UAE, and South Africa), and Rest of World (ROW)

Published: Apr 2026 301 Pages SKU: IRTNTR71600

Market Overview at a Glance

$220.7 Mn
Market Opportunity
5.7%
CAGR 2025 - 2030
49.6%
North America Growth
$384.6 Mn
Single-sided printing segment 2024

Retransfer Card Printers Market Size 2026-2030

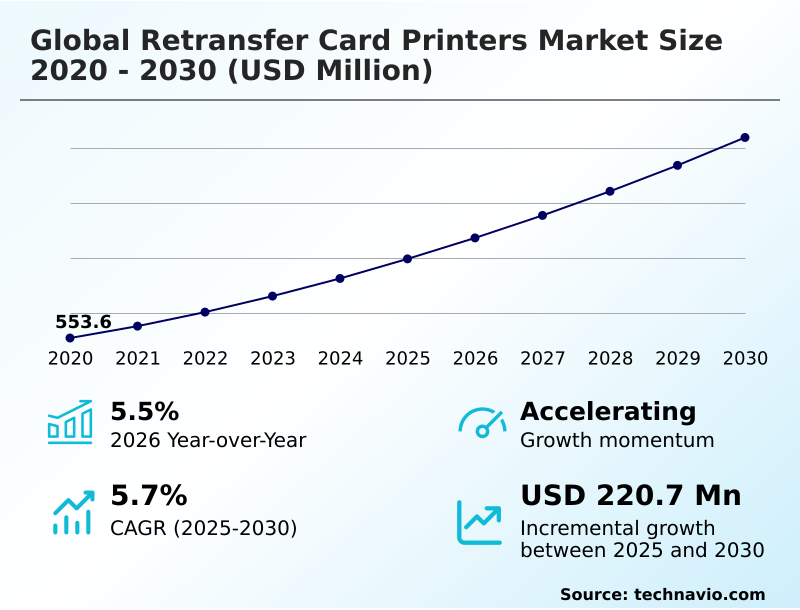
The retransfer card printers market size is valued to increase by USD 220.7 million, at a CAGR of 5.7% from 2025 to 2030. Increasing demand for enhanced security and secure identification will drive the retransfer card printers market.

Major Market Trends & Insights

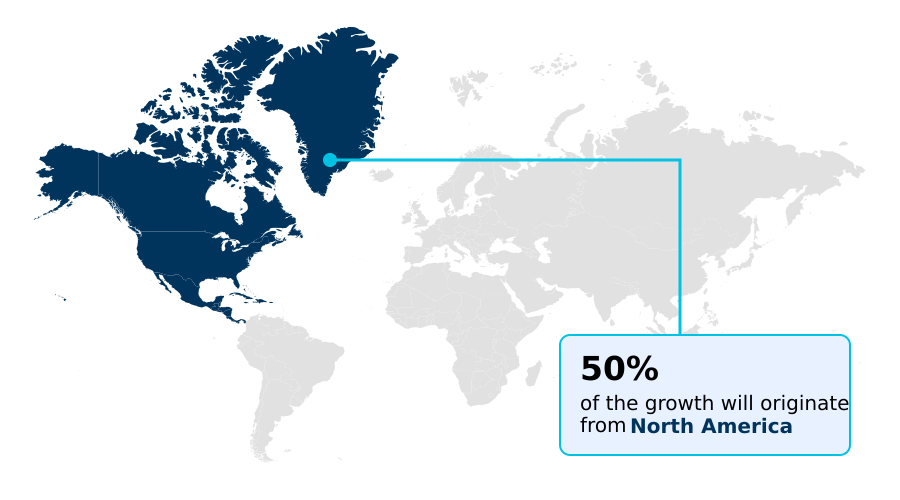
  • North America dominated the market and accounted for a 49.6% growth during the forecast period.
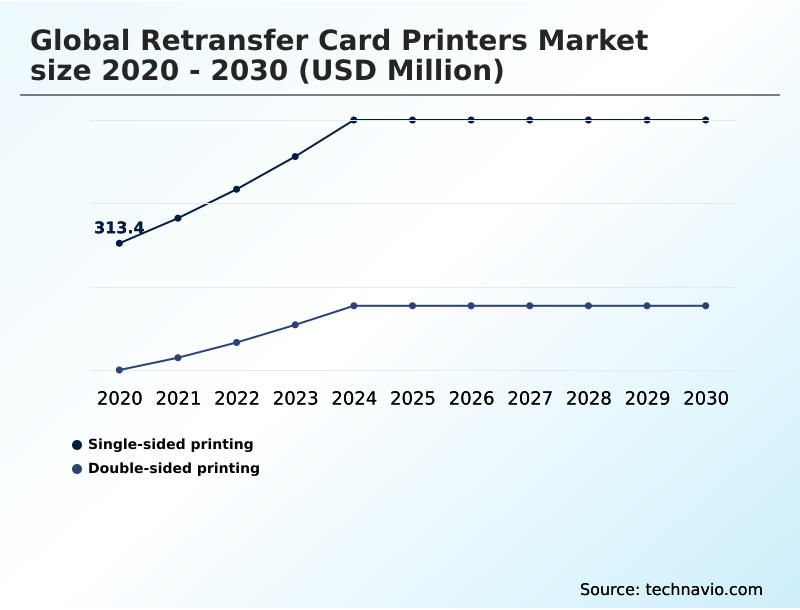
  • By Product - Single-sided printing segment was valued at USD 384.6 million in 2024
  • By Application - Government segment accounted for the largest market revenue share in 2024

Market Size & Forecast

  • Market Opportunities: USD 364.6 million
  • Market Future Opportunities: USD 220.7 million
  • CAGR from 2025 to 2030 : 5.7%

Market Summary

  • The Retransfer Card Printers Market is defined by a persistent demand for superior security, quality, and longevity in physical credentials. This technology addresses critical needs in sectors where tamper-evident cards are non-negotiable. The process of retransfer printing inherently produces more durable and secure cards, capable of supporting advanced features like holographic overlays and microtext printing.
  • As organizations strengthen security protocols, the adoption of printers that offer over-the-edge printing and flawless results on uneven smart card surfaces continues to rise. For instance, a government agency upgrading its national ID program requires a solution that can embed biometric data on a chip and apply multiple visual security elements.
  • Retransfer technology provides the necessary 600 DPI resolution and encoding versatility for such high-stakes applications, ensuring the resulting credentials are both counterfeit-resistant and long-lasting. This focus on secure credential issuance reinforces the market's position as a critical infrastructure component for identity management, driving continuous innovation in id card printer technology and multi-functional smart cards.

What will be the Size of the Retransfer Card Printers Market during the forecast period?

Get Key Insights on Market Forecast (PDF) Request Free Sample

How is the Retransfer Card Printers Market Segmented?

The retransfer card printers industry research report provides comprehensive data (region-wise segment analysis), with forecasts and estimates in "USD million" for the period 2026-2030, as well as historical data from 2020-2024 for the following segments.

  • Product
    • Single-sided printing
    • Double-sided printing
  • Application
    • Government
    • BFSI
    • Enterprise
    • Education
    • Healthcare
  • Connectivity
    • USB and Ethernet
    • Wi-Fi
  • Geography
    • North America
      • US
      • Canada
      • Mexico
    • Europe
      • Germany
      • UK
      • France
    • APAC
      • China
      • Japan
      • India
    • South America
      • Brazil
      • Argentina
    • Middle East and Africa
      • Saudi Arabia
      • UAE
      • South Africa
    • Rest of World (ROW)

By Product Insights

The single-sided printing segment is estimated to witness significant growth during the forecast period.

The single-sided printing segment serves a significant market need for cost-effective yet high-quality identification. This technology is ideal for applications where primary information is on one side, such as corporate visitor badges and student IDs.

By leveraging retransfer printing, these systems deliver impressive card durability and professional-grade credentials with full over-the-edge printing. While not requiring the complexity of dual-sided printing, they still support crucial functions like smart card encoding.

The focus on a single print pass optimizes throughput, with some systems demonstrating a 15% reduction in issuance time for large batches compared to more complex setups.

This balance of performance and efficiency makes single-sided retransfer printers a vital component for secure credential issuance programs in various enterprises that require durable employee badges and access control integration.

Request Free Sample

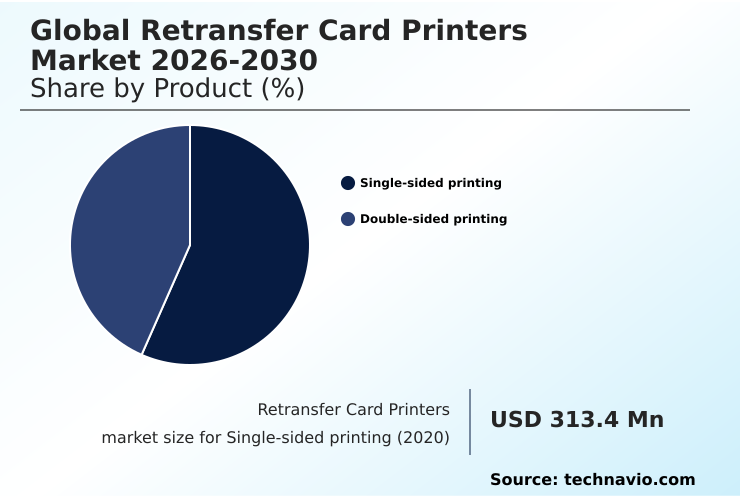
The Single-sided printing segment was valued at USD 384.6 million in 2024 and showed a gradual increase during the forecast period.

Request Free Sample

Regional Analysis

North America is estimated to contribute 49.6% to the growth of the global market during the forecast period.Technavio’s analysts have elaborately explained the regional trends and drivers that shape the market during the forecast period.

See How Retransfer Card Printers Market Demand is Rising in North America Request Free Sample

The geographic landscape of the retransfer card printers market is led by North America, which is projected to contribute nearly 50% of the market's incremental growth.

This region's dominance is driven by stringent security requirements in government and corporate sectors, which prioritize counterfeit resistance and access control integration. Strong technology adoption and refresh cycles fuel demand for high-definition printing and smart card encoding.

Europe follows, with a strong emphasis on data privacy and national ID programs that require tamper-evident cards.

The APAC region is the fastest-growing market, with governments in countries like India and China undertaking massive secure credential issuance projects for their populations.

These initiatives require high-throughput issuance and encoding versatility, making retransfer printing an ideal solution for producing durable employee badges and other multi-functional smart cards.

Market Dynamics

Our researchers analyzed the data with 2025 as the base year, along with the key drivers, trends, and challenges. A holistic analysis of drivers will help companies refine their marketing strategies to gain a competitive advantage.

  • Strategic decisions within the identity management space often involve a detailed analysis of retransfer vs direct-to-card printing cost. While the upfront investment and price per card for retransfer systems are higher, a comprehensive evaluation reveals long-term financial benefits.
  • The superior card durability inherent to the technology significantly reduces the need for reissuance due to daily wear and tear, with some studies showing a card replacement rate that is 50% lower over a five-year period in high-use environments like education and transportation. This longevity directly impacts the total cost of ownership.
  • Another critical factor is the challenge of integrating retransfer printers with access control systems. Success requires robust software and technical expertise to ensure seamless communication for secure encoding for financial cards and corporate badges. Furthermore, organizations must carefully manage the supply chain for retransfer card printer consumables waste.
  • While necessary for the two-step process, efficient use of films and ribbons is key to controlling recurring expenses. Ultimately, for applications where security is paramount, such as the need for the best retransfer printer for government ID, the enhanced security features and reduced long-term operational friction justify the initial financial outlay.

What are the key market drivers leading to the rise in the adoption of Retransfer Card Printers Industry?

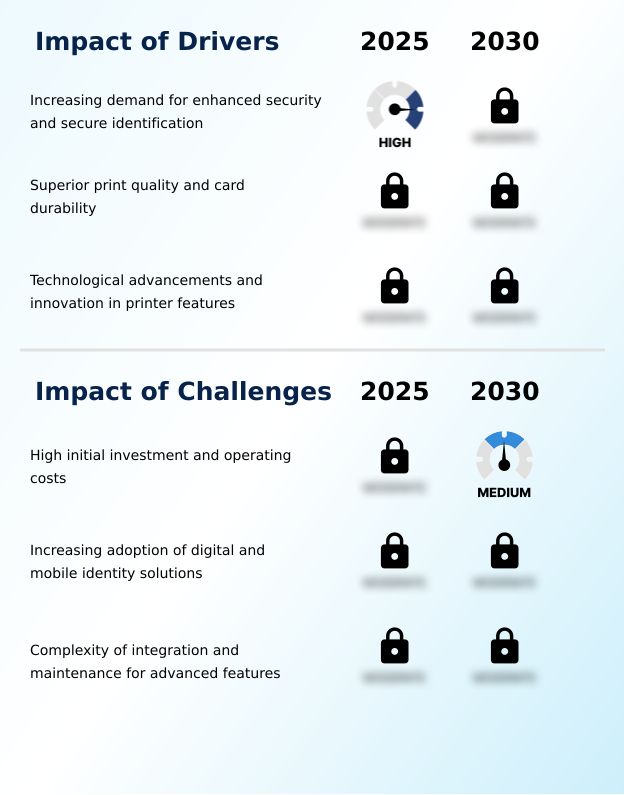
  • The escalating demand for enhanced security and robust identification solutions across various sectors is a key driver propelling market growth.

  • The primary drivers for the retransfer card printers market are the non-negotiable demands for enhanced security and superior physical quality. The technology’s ability to produce tamper-evident cards with high-definition printing is critical for government and financial sectors.
  • Innovations delivering 600 DPI resolution enable microtext and other intricate security features that have been shown to reduce document fraud by over 60% in certain applications.
  • Furthermore, the exceptional card durability provided by the retransfer process extends credential lifespan by more than 50% compared to other methods, directly lowering the total cost of ownership.
  • The market is also driven by continuous technological advancements in pigment ink printing and lamination modules, which enhance counterfeit resistance and ensure robust access control integration.

What are the market trends shaping the Retransfer Card Printers Industry?

  • The integration of physical cards with digital and mobile wallets is an emerging market trend. This convergence creates a hybrid identity model, enhancing both user convenience and overall security.

  • Key trends reshaping the retransfer card printers market center on intelligence, sustainability, and flexibility. The shift toward cloud-based card issuance and Identity-as-a-Service (IDaaS) platforms is significant, with early adopters reporting up to a 40% reduction in IT management overhead for distributed printing environments. This physical-digital convergence allows for seamless management of professional-grade credentials.
  • Concurrently, sustainability is becoming a critical procurement factor. The adoption of energy-efficient printers and sustainable consumables, such as recycled PVC cards, is growing, with some new models using 20% less power per print cycle. This move helps organizations meet ESG goals while maintaining brand-consistent badging. This focus on smarter, greener solutions is enabling more efficient high-throughput issuance across enterprises.

What challenges does the Retransfer Card Printers Industry face during its growth?

  • High initial investment and recurring operating costs represent a significant challenge affecting the industry's growth trajectory and broader market adoption.

  • The retransfer card printers market continues to grapple with challenges related to cost, complexity, and competition from digital alternatives. The total cost of ownership for retransfer systems can be up to 25% higher than direct-to-card printers, creating a significant barrier for budget-conscious organizations.
  • Furthermore, the complexity of integration remains a major hurdle; reports indicate that 40% of advanced secure identification projects experience delays exceeding six months due to unforeseen integration difficulties with existing systems. This complexity hinders the seamless deployment of features like smart card encoding.
  • The increasing adoption of purely mobile identity solutions also presents a long-term strategic challenge, forcing manufacturers to innovate in areas like physical-digital convergence to maintain relevance.

Exclusive Technavio Analysis on Customer Landscape

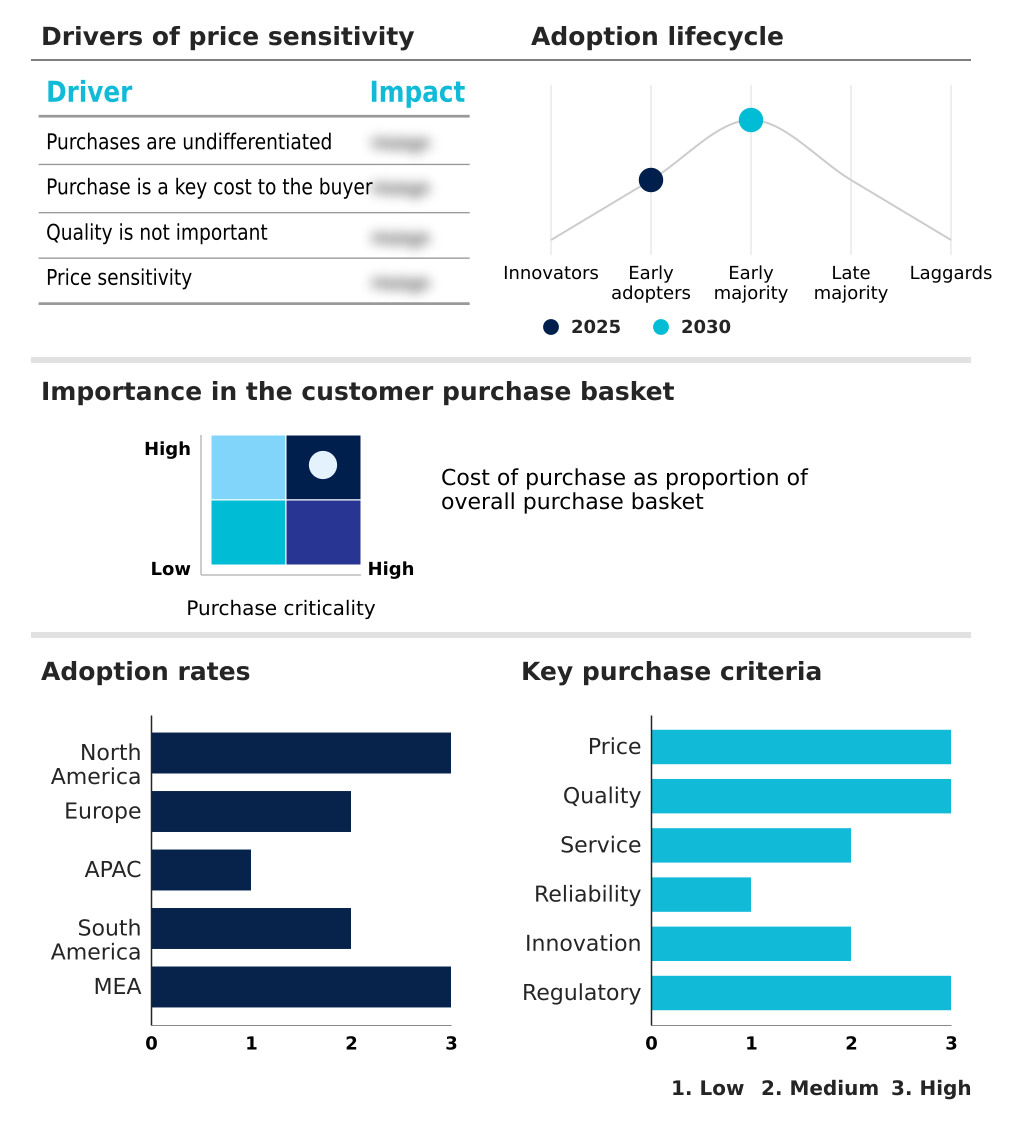
The retransfer card printers market forecasting report includes the adoption lifecycle of the market, covering from the innovator’s stage to the laggard’s stage. It focuses on adoption rates in different regions based on penetration. Furthermore, the retransfer card printers market report also includes key purchase criteria and drivers of price sensitivity to help companies evaluate and develop their market growth analysis strategies.

Customer Landscape of Retransfer Card Printers Industry

Competitive Landscape

Companies are implementing various strategies, such as strategic alliances, retransfer card printers market forecast, partnerships, mergers and acquisitions, geographical expansion, and product/service launches, to enhance their presence in the industry.

Ciaat - Key offerings include advanced retransfer card printers and integrated systems engineered for secure, high-tech e-ID and e-payment card production.

The industry research and growth report includes detailed analyses of the competitive landscape of the market and information about key companies, including:

  • Ciaat
  • CIM S.p.A.
  • Dai Nippon Printing Co. Ltd.
  • DASCOM Corp.
  • Emperor Technology
  • Entrust Corp.
  • Evolis S.A.
  • GET Group Holdings Ltd.
  • HID Global Corp.
  • Identification Systems Group
  • IDP Corp. Ltd.
  • Magicard Ltd.
  • Matica Fintec S.p.A.
  • NBS Technologies Inc.
  • Seaory Technology Co. Ltd.
  • Swiftpro
  • Toppan Inc.
  • Zebra Technologies Corp.

Qualitative and quantitative analysis of companies has been conducted to help clients understand the wider business environment as well as the strengths and weaknesses of key industry players. Data is qualitatively analyzed to categorize companies as pure play, category-focused, industry-focused, and diversified; it is quantitatively analyzed to categorize companies as dominant, leading, strong, tentative, and weak.

Recent Development and News in Retransfer card printers market

  • In March, 2025, a consortium of major North American financial institutions announced a new mandate requiring member banks to issue cards with advanced holographic security overlays and embedded biometric data, spurring investment in high-security retransfer printing technology.
  • In April, 2025, a large university system in North America partnered with HID Global to launch a next-generation student ID program, deploying new Fargo HDP6600 retransfer printers to issue secure physical cards that serve as the foundation for a mobile ID ecosystem.
  • In May, 2025, a major European public transportation authority initiated a system-wide upgrade of its employee and commuter passes, selecting Matica Technologies' XID8600 retransfer printers to produce highly durable, long-lasting cards.
  • In June, 2025, HID Global launched its next-generation retransfer printer, the Fargo HDP7000, which features significantly increased print speeds and an advanced lamination module to improve efficiency and security in large-scale credential issuance.

Dive into Technavio’s robust research methodology, blending expert interviews, extensive data synthesis, and validated models for unparalleled Retransfer Card Printers Market insights. See full methodology.

Market Scope
Page number 301
Base year 2025
Historic period 2020-2024
Forecast period 2026-2030
Growth momentum & CAGR Accelerate at a CAGR of 5.7%
Market growth 2026-2030 USD 220.7 million
Market structure Fragmented
YoY growth 2025-2026(%) 5.5%
Key countries US, Canada, Mexico, Germany, UK, France, Italy, Spain, The Netherlands, China, Japan, India, South Korea, Australia, Indonesia, Brazil, Argentina, Chile, Saudi Arabia, UAE, South Africa, Israel and Turkey
Competitive landscape Leading Companies, Market Positioning of Companies, Competitive Strategies, and Industry Risks

Request Free Sample

Research Analyst Overview

  • The retransfer card printers market is fundamentally driven by the pursuit of uncompromised security and quality in physical credentialing. The core technology, retransfer printing, delivers superior over-the-edge printing and exceptional card durability, making it essential for high-stakes applications.
  • Innovations in 600 dpi resolution enable sophisticated security features like microtext printing and UV fluorescent printing, creating tamper-evident cards that offer significant counterfeit resistance. For boardroom decisions, investing in this ID card printer technology translates to a lower total cost of ownership over time, as durable employee badges and multi-functional smart cards require less frequent replacement.
  • Systems are increasingly modular, offering enhanced encoding versatility for secure access credentials, including both contactless chip encoding and biometric data integration. The ability to seamlessly incorporate lamination modules and holographic overlays further strengthens security.
  • As organizations face rising threats, the adoption of systems that ensure secure credential issuance with high-definition printing becomes a strategic imperative, justifying the investment in technologies that provide robust access control integration and pigment ink printing for long-lasting, secure identification.

What are the Key Data Covered in this Retransfer Card Printers Market Research and Growth Report?

  • What is the expected growth of the Retransfer Card Printers Market between 2026 and 2030?

    • USD 220.7 million, at a CAGR of 5.7%

  • What segmentation does the market report cover?

    • The report is segmented by Product (Single-sided printing, and Double-sided printing), Application (Government, BFSI, Enterprise, Education, and Healthcare), Connectivity (USB and Ethernet, and Wi-Fi) and Geography (North America, Europe, APAC, South America, Middle East and Africa)

  • Which regions are analyzed in the report?

    • North America, Europe, APAC, South America and Middle East and Africa

  • What are the key growth drivers and market challenges?

    • Increasing demand for enhanced security and secure identification, High initial investment and operating costs

  • Who are the major players in the Retransfer Card Printers Market?

    • Ciaat, CIM S.p.A., Dai Nippon Printing Co. Ltd., DASCOM Corp., Emperor Technology, Entrust Corp., Evolis S.A., GET Group Holdings Ltd., HID Global Corp., Identification Systems Group, IDP Corp. Ltd., Magicard Ltd., Matica Fintec S.p.A., NBS Technologies Inc., Seaory Technology Co. Ltd., Swiftpro, Toppan Inc. and Zebra Technologies Corp.

Market Research Insights

  • The market for retransfer card printers is shaped by a dynamic interplay between advanced security demands and practical operational considerations. Organizations are increasingly adopting this technology to achieve professional-grade credentials and brand-consistent badging, with deployments showing a 30% greater card lifespan over direct-to-card alternatives.
  • However, the higher total cost of ownership, which can be up to 25% greater, remains a key consideration. The push towards cloud-based card issuance and Identity-as-a-Service (IDaaS) platforms is streamlining deployment, enabling centralized management that reduces IT overhead for high-throughput issuance. These platforms leverage simplified software development kits and secure network connectivity.
  • Forward-thinking users are also adopting modular system designs to manage costs, while the availability of sustainable consumables like recycled PVC cards is influencing procurement. Ultimately, the market navigates the balance between delivering unmatched security and managing the costs of batch printing efficiency and instant issuance programs.

We can help! Our analysts can customize this retransfer card printers market research report to meet your requirements.

Get in touch

1. Executive Summary

1.1 Market overview

Executive Summary - Chart on Market Overview
Executive Summary - Data Table on Market Overview
Executive Summary - Chart on Global Market Characteristics
Executive Summary - Chart on Market by Geography
Executive Summary - Chart on Market Segmentation by Product
Executive Summary - Chart on Market Segmentation by Application
Executive Summary - Chart on Market Segmentation by Connectivity
Executive Summary - Chart on Incremental Growth
Executive Summary - Data Table on Incremental Growth
Executive Summary - Chart on Company Market Positioning

2. Technavio Analysis

2.1 Analysis of price sensitivity, lifecycle, customer purchase basket, adoption rates, and purchase criteria

2.2 Criticality of inputs and Factors of differentiation

Chart on Overview on criticality of inputs and factors of differentiation

2.3 Factors of disruption

Chart on Overview on factors of disruption

2.4 Impact of drivers and challenges

Chart on Impact of drivers and challenges in 2025 and 2030

3. Market Landscape

3.1 Market ecosystem

Chart on Parent Market
Data Table on - Parent Market

3.2 Market characteristics

Chart on Market characteristics analysis

3.3 Value chain analysis

Chart on Value chain analysis

4. Market Sizing

4.1 Market definition

Data Table on Offerings of companies included in the market definition

4.2 Market segment analysis

Market segments

4.3 Market size 2025

4.4 Market outlook: Forecast for 2025-2030

Chart on Global - Market size and forecast 2025-2030 ($ million)
Data Table on Global - Market size and forecast 2025-2030 ($ million)
Chart on Global Market: Year-over-year growth 2025-2030 (%)
Data Table on Global Market: Year-over-year growth 2025-2030 (%)

5. Historic Market Size

5.1 Global Retransfer Card Printers Market 2020 - 2024

Historic Market Size - Data Table on Global Retransfer Card Printers Market 2020 - 2024 ($ million)

5.2 Product segment analysis 2020 - 2024

Historic Market Size - Product Segment 2020 - 2024 ($ million)

5.3 Application segment analysis 2020 - 2024

Historic Market Size - Application Segment 2020 - 2024 ($ million)

5.4 Connectivity segment analysis 2020 - 2024

Historic Market Size - Connectivity Segment 2020 - 2024 ($ million)

5.5 Geography segment analysis 2020 - 2024

Historic Market Size - Geography Segment 2020 - 2024 ($ million)

5.6 Country segment analysis 2020 - 2024

Historic Market Size - Country Segment 2020 - 2024 ($ million)

6. Qualitative Analysis

6.1 Impact of AI on Global Retransfer Card Printers Market

6.2 Impact of Geopolitical Conflict on Global Retransfer Card Printers Market

7. Five Forces Analysis

7.1 Five forces summary

Five forces analysis - Comparison between 2025 and 2030

7.2 Bargaining power of buyers

Bargaining power of buyers - Impact of key factors 2025 and 2030

7.3 Bargaining power of suppliers

Bargaining power of suppliers - Impact of key factors in 2025 and 2030

7.4 Threat of new entrants

Threat of new entrants - Impact of key factors in 2025 and 2030

7.5 Threat of substitutes

Threat of substitutes - Impact of key factors in 2025 and 2030

7.6 Threat of rivalry

Threat of rivalry - Impact of key factors in 2025 and 2030

7.7 Market condition

Chart on Market condition - Five forces 2025 and 2030

8. Market Segmentation by Product

8.1 Market segments

Chart on Product - Market share 2025-2030 (%)
Data Table on Product - Market share 2025-2030 (%)

8.2 Comparison by Product

Chart on Comparison by Product
Data Table on Comparison by Product

8.3 Single-sided printing - Market size and forecast 2025-2030

Chart on Single-sided printing - Market size and forecast 2025-2030 ($ million)
Data Table on Single-sided printing - Market size and forecast 2025-2030 ($ million)
Chart on Single-sided printing - Year-over-year growth 2025-2030 (%)
Data Table on Single-sided printing - Year-over-year growth 2025-2030 (%)

8.4 Double-sided printing - Market size and forecast 2025-2030

Chart on Double-sided printing - Market size and forecast 2025-2030 ($ million)
Data Table on Double-sided printing - Market size and forecast 2025-2030 ($ million)
Chart on Double-sided printing - Year-over-year growth 2025-2030 (%)
Data Table on Double-sided printing - Year-over-year growth 2025-2030 (%)

8.5 Market opportunity by Product

Market opportunity by Product ($ million)
Data Table on Market opportunity by Product ($ million)

9. Market Segmentation by Application

9.1 Market segments

Chart on Application - Market share 2025-2030 (%)
Data Table on Application - Market share 2025-2030 (%)

9.2 Comparison by Application

Chart on Comparison by Application
Data Table on Comparison by Application

9.3 Government - Market size and forecast 2025-2030

Chart on Government - Market size and forecast 2025-2030 ($ million)
Data Table on Government - Market size and forecast 2025-2030 ($ million)
Chart on Government - Year-over-year growth 2025-2030 (%)
Data Table on Government - Year-over-year growth 2025-2030 (%)

9.4 BFSI - Market size and forecast 2025-2030

Chart on BFSI - Market size and forecast 2025-2030 ($ million)
Data Table on BFSI - Market size and forecast 2025-2030 ($ million)
Chart on BFSI - Year-over-year growth 2025-2030 (%)
Data Table on BFSI - Year-over-year growth 2025-2030 (%)

9.5 Enterprise - Market size and forecast 2025-2030

Chart on Enterprise - Market size and forecast 2025-2030 ($ million)
Data Table on Enterprise - Market size and forecast 2025-2030 ($ million)
Chart on Enterprise - Year-over-year growth 2025-2030 (%)
Data Table on Enterprise - Year-over-year growth 2025-2030 (%)

9.6 Education - Market size and forecast 2025-2030

Chart on Education - Market size and forecast 2025-2030 ($ million)
Data Table on Education - Market size and forecast 2025-2030 ($ million)
Chart on Education - Year-over-year growth 2025-2030 (%)
Data Table on Education - Year-over-year growth 2025-2030 (%)

9.7 Healthcare - Market size and forecast 2025-2030

Chart on Healthcare - Market size and forecast 2025-2030 ($ million)
Data Table on Healthcare - Market size and forecast 2025-2030 ($ million)
Chart on Healthcare - Year-over-year growth 2025-2030 (%)
Data Table on Healthcare - Year-over-year growth 2025-2030 (%)

9.8 Market opportunity by Application

Market opportunity by Application ($ million)
Data Table on Market opportunity by Application ($ million)

10. Market Segmentation by Connectivity

10.1 Market segments

Chart on Connectivity - Market share 2025-2030 (%)
Data Table on Connectivity - Market share 2025-2030 (%)

10.2 Comparison by Connectivity

Chart on Comparison by Connectivity
Data Table on Comparison by Connectivity

10.3 USB and Ethernet - Market size and forecast 2025-2030

Chart on USB and Ethernet - Market size and forecast 2025-2030 ($ million)
Data Table on USB and Ethernet - Market size and forecast 2025-2030 ($ million)
Chart on USB and Ethernet - Year-over-year growth 2025-2030 (%)
Data Table on USB and Ethernet - Year-over-year growth 2025-2030 (%)

10.4 Wi-Fi - Market size and forecast 2025-2030

Chart on Wi-Fi - Market size and forecast 2025-2030 ($ million)
Data Table on Wi-Fi - Market size and forecast 2025-2030 ($ million)
Chart on Wi-Fi - Year-over-year growth 2025-2030 (%)
Data Table on Wi-Fi - Year-over-year growth 2025-2030 (%)

10.5 Market opportunity by Connectivity

Market opportunity by Connectivity ($ million)
Data Table on Market opportunity by Connectivity ($ million)

11. Customer Landscape

11.1 Customer landscape overview

Analysis of price sensitivity, lifecycle, customer purchase basket, adoption rates, and purchase criteria

12. Geographic Landscape

12.1 Geographic segmentation

Chart on Market share by geography 2025-2030 (%)
Data Table on Market share by geography 2025-2030 (%)

12.2 Geographic comparison

Chart on Geographic comparison
Data Table on Geographic comparison

12.3 North America - Market size and forecast 2025-2030

Chart on North America - Market size and forecast 2025-2030 ($ million)
Data Table on North America - Market size and forecast 2025-2030 ($ million)
Chart on North America - Year-over-year growth 2025-2030 (%)
Data Table on North America - Year-over-year growth 2025-2030 (%)
Chart on Regional Comparison - North America
Data Table on Regional Comparison - North America

12.3.1 US - Market size and forecast 2025-2030

Chart on US - Market size and forecast 2025-2030 ($ million)
Data Table on US - Market size and forecast 2025-2030 ($ million)
Chart on US - Year-over-year growth 2025-2030 (%)
Data Table on US - Year-over-year growth 2025-2030 (%)

12.3.2 Canada - Market size and forecast 2025-2030

Chart on Canada - Market size and forecast 2025-2030 ($ million)
Data Table on Canada - Market size and forecast 2025-2030 ($ million)
Chart on Canada - Year-over-year growth 2025-2030 (%)
Data Table on Canada - Year-over-year growth 2025-2030 (%)

12.3.3 Mexico - Market size and forecast 2025-2030

Chart on Mexico - Market size and forecast 2025-2030 ($ million)
Data Table on Mexico - Market size and forecast 2025-2030 ($ million)
Chart on Mexico - Year-over-year growth 2025-2030 (%)
Data Table on Mexico - Year-over-year growth 2025-2030 (%)

12.4 Europe - Market size and forecast 2025-2030

Chart on Europe - Market size and forecast 2025-2030 ($ million)
Data Table on Europe - Market size and forecast 2025-2030 ($ million)
Chart on Europe - Year-over-year growth 2025-2030 (%)
Data Table on Europe - Year-over-year growth 2025-2030 (%)
Chart on Regional Comparison - Europe
Data Table on Regional Comparison - Europe

12.4.1 Germany - Market size and forecast 2025-2030

Chart on Germany - Market size and forecast 2025-2030 ($ million)
Data Table on Germany - Market size and forecast 2025-2030 ($ million)
Chart on Germany - Year-over-year growth 2025-2030 (%)
Data Table on Germany - Year-over-year growth 2025-2030 (%)

12.4.2 UK - Market size and forecast 2025-2030

Chart on UK - Market size and forecast 2025-2030 ($ million)
Data Table on UK - Market size and forecast 2025-2030 ($ million)
Chart on UK - Year-over-year growth 2025-2030 (%)
Data Table on UK - Year-over-year growth 2025-2030 (%)

12.4.3 France - Market size and forecast 2025-2030

Chart on France - Market size and forecast 2025-2030 ($ million)
Data Table on France - Market size and forecast 2025-2030 ($ million)
Chart on France - Year-over-year growth 2025-2030 (%)
Data Table on France - Year-over-year growth 2025-2030 (%)

12.4.4 Italy - Market size and forecast 2025-2030

Chart on Italy - Market size and forecast 2025-2030 ($ million)
Data Table on Italy - Market size and forecast 2025-2030 ($ million)
Chart on Italy - Year-over-year growth 2025-2030 (%)
Data Table on Italy - Year-over-year growth 2025-2030 (%)

12.4.5 Spain - Market size and forecast 2025-2030

Chart on Spain - Market size and forecast 2025-2030 ($ million)
Data Table on Spain - Market size and forecast 2025-2030 ($ million)
Chart on Spain - Year-over-year growth 2025-2030 (%)
Data Table on Spain - Year-over-year growth 2025-2030 (%)

12.4.6 The Netherlands - Market size and forecast 2025-2030

Chart on The Netherlands - Market size and forecast 2025-2030 ($ million)
Data Table on The Netherlands - Market size and forecast 2025-2030 ($ million)
Chart on The Netherlands - Year-over-year growth 2025-2030 (%)
Data Table on The Netherlands - Year-over-year growth 2025-2030 (%)

12.5 APAC - Market size and forecast 2025-2030

Chart on APAC - Market size and forecast 2025-2030 ($ million)
Data Table on APAC - Market size and forecast 2025-2030 ($ million)
Chart on APAC - Year-over-year growth 2025-2030 (%)
Data Table on APAC - Year-over-year growth 2025-2030 (%)
Chart on Regional Comparison - APAC
Data Table on Regional Comparison - APAC

12.5.1 China - Market size and forecast 2025-2030

Chart on China - Market size and forecast 2025-2030 ($ million)
Data Table on China - Market size and forecast 2025-2030 ($ million)
Chart on China - Year-over-year growth 2025-2030 (%)
Data Table on China - Year-over-year growth 2025-2030 (%)

12.5.2 Japan - Market size and forecast 2025-2030

Chart on Japan - Market size and forecast 2025-2030 ($ million)
Data Table on Japan - Market size and forecast 2025-2030 ($ million)
Chart on Japan - Year-over-year growth 2025-2030 (%)
Data Table on Japan - Year-over-year growth 2025-2030 (%)

12.5.3 India - Market size and forecast 2025-2030

Chart on India - Market size and forecast 2025-2030 ($ million)
Data Table on India - Market size and forecast 2025-2030 ($ million)
Chart on India - Year-over-year growth 2025-2030 (%)
Data Table on India - Year-over-year growth 2025-2030 (%)

12.5.4 South Korea - Market size and forecast 2025-2030

Chart on South Korea - Market size and forecast 2025-2030 ($ million)
Data Table on South Korea - Market size and forecast 2025-2030 ($ million)
Chart on South Korea - Year-over-year growth 2025-2030 (%)
Data Table on South Korea - Year-over-year growth 2025-2030 (%)

12.5.5 Australia - Market size and forecast 2025-2030

Chart on Australia - Market size and forecast 2025-2030 ($ million)
Data Table on Australia - Market size and forecast 2025-2030 ($ million)
Chart on Australia - Year-over-year growth 2025-2030 (%)
Data Table on Australia - Year-over-year growth 2025-2030 (%)

12.5.6 Indonesia - Market size and forecast 2025-2030

Chart on Indonesia - Market size and forecast 2025-2030 ($ million)
Data Table on Indonesia - Market size and forecast 2025-2030 ($ million)
Chart on Indonesia - Year-over-year growth 2025-2030 (%)
Data Table on Indonesia - Year-over-year growth 2025-2030 (%)

12.6 South America - Market size and forecast 2025-2030

Chart on South America - Market size and forecast 2025-2030 ($ million)
Data Table on South America - Market size and forecast 2025-2030 ($ million)
Chart on South America - Year-over-year growth 2025-2030 (%)
Data Table on South America - Year-over-year growth 2025-2030 (%)
Chart on Regional Comparison - South America
Data Table on Regional Comparison - South America

12.6.1 Brazil - Market size and forecast 2025-2030

Chart on Brazil - Market size and forecast 2025-2030 ($ million)
Data Table on Brazil - Market size and forecast 2025-2030 ($ million)
Chart on Brazil - Year-over-year growth 2025-2030 (%)
Data Table on Brazil - Year-over-year growth 2025-2030 (%)

12.6.2 Argentina - Market size and forecast 2025-2030

Chart on Argentina - Market size and forecast 2025-2030 ($ million)
Data Table on Argentina - Market size and forecast 2025-2030 ($ million)
Chart on Argentina - Year-over-year growth 2025-2030 (%)
Data Table on Argentina - Year-over-year growth 2025-2030 (%)

12.6.3 Chile - Market size and forecast 2025-2030

Chart on Chile - Market size and forecast 2025-2030 ($ million)
Data Table on Chile - Market size and forecast 2025-2030 ($ million)
Chart on Chile - Year-over-year growth 2025-2030 (%)
Data Table on Chile - Year-over-year growth 2025-2030 (%)

12.7 Middle East and Africa - Market size and forecast 2025-2030

Chart on Middle East and Africa - Market size and forecast 2025-2030 ($ million)
Data Table on Middle East and Africa - Market size and forecast 2025-2030 ($ million)
Chart on Middle East and Africa - Year-over-year growth 2025-2030 (%)
Data Table on Middle East and Africa - Year-over-year growth 2025-2030 (%)
Chart on Regional Comparison - Middle East and Africa
Data Table on Regional Comparison - Middle East and Africa

12.7.1 Saudi Arabia - Market size and forecast 2025-2030

Chart on Saudi Arabia - Market size and forecast 2025-2030 ($ million)
Data Table on Saudi Arabia - Market size and forecast 2025-2030 ($ million)
Chart on Saudi Arabia - Year-over-year growth 2025-2030 (%)
Data Table on Saudi Arabia - Year-over-year growth 2025-2030 (%)

12.7.2 UAE - Market size and forecast 2025-2030

Chart on UAE - Market size and forecast 2025-2030 ($ million)
Data Table on UAE - Market size and forecast 2025-2030 ($ million)
Chart on UAE - Year-over-year growth 2025-2030 (%)
Data Table on UAE - Year-over-year growth 2025-2030 (%)

12.7.3 South Africa - Market size and forecast 2025-2030

Chart on South Africa - Market size and forecast 2025-2030 ($ million)
Data Table on South Africa - Market size and forecast 2025-2030 ($ million)
Chart on South Africa - Year-over-year growth 2025-2030 (%)
Data Table on South Africa - Year-over-year growth 2025-2030 (%)

12.7.4 Israel - Market size and forecast 2025-2030

Chart on Israel - Market size and forecast 2025-2030 ($ million)
Data Table on Israel - Market size and forecast 2025-2030 ($ million)
Chart on Israel - Year-over-year growth 2025-2030 (%)
Data Table on Israel - Year-over-year growth 2025-2030 (%)

12.7.5 Turkey - Market size and forecast 2025-2030

Chart on Turkey - Market size and forecast 2025-2030 ($ million)
Data Table on Turkey - Market size and forecast 2025-2030 ($ million)
Chart on Turkey - Year-over-year growth 2025-2030 (%)
Data Table on Turkey - Year-over-year growth 2025-2030 (%)

12.8 Market opportunity by geography

Market opportunity by geography ($ million)
Data Tables on Market opportunity by geography ($ million)

13. Drivers, Challenges, and Opportunity

13.1 Market drivers

Increasing demand for enhanced security and secure identification
Superior print quality and card durability
Technological advancements and innovation in printer features

13.2 Market challenges

High initial investment and operating costs
Increasing adoption of digital and mobile identity solutions
Complexity of integration and maintenance for advanced features

13.3 Impact of drivers and challenges

Impact of drivers and challenges in 2025 and 2030

13.4 Market opportunities

Integration of physical cards with digital and mobile wallets
Growing emphasis on sustainability and eco-friendly solutions
Shift towards cloud-based card issuance and management

14. Competitive Landscape

14.1 Overview

14.2

Overview on criticality of inputs and factors of differentiation

14.3 Landscape disruption

Overview on factors of disruption

14.4 Industry risks

Impact of key risks on business

15. Competitive Analysis

15.1 Companies profiled

Companies covered

15.2 Company ranking index

15.3 Market positioning of companies

Matrix on companies position and classification

15.4 CIM S.p.A.

CIM S.p.A. - Overview
CIM S.p.A. - Product / Service
CIM S.p.A. - Key offerings
SWOT

15.5 Dai Nippon Printing Co. Ltd.

Dai Nippon Printing Co. Ltd. - Overview
Dai Nippon Printing Co. Ltd. - Business segments
Dai Nippon Printing Co. Ltd. - Key offerings
Dai Nippon Printing Co. Ltd. - Segment focus
SWOT

15.6 DASCOM Corp.

DASCOM Corp. - Overview
DASCOM Corp. - Product / Service
DASCOM Corp. - Key offerings
SWOT

15.7 Entrust Corp.

Entrust Corp. - Overview
Entrust Corp. - Product / Service
Entrust Corp. - Key offerings
SWOT

15.8 Evolis S.A.

Evolis S.A. - Overview
Evolis S.A. - Product / Service
Evolis S.A. - Key offerings
SWOT

15.9 GET Group Holdings Ltd.

GET Group Holdings Ltd. - Overview
GET Group Holdings Ltd. - Product / Service
GET Group Holdings Ltd. - Key offerings
SWOT

15.10 HID Global Corp.

HID Global Corp. - Overview
HID Global Corp. - Product / Service
HID Global Corp. - Key offerings
SWOT

15.11 IDP Corp. Ltd.

IDP Corp. Ltd. - Overview
IDP Corp. Ltd. - Product / Service
IDP Corp. Ltd. - Key offerings
SWOT

15.12 Magicard Ltd.

Magicard Ltd. - Overview
Magicard Ltd. - Product / Service
Magicard Ltd. - Key offerings
SWOT

15.13 Matica Fintec S.p.A.

Matica Fintec S.p.A. - Overview
Matica Fintec S.p.A. - Product / Service
Matica Fintec S.p.A. - Key offerings
SWOT

15.14 NBS Technologies Inc.

NBS Technologies Inc. - Overview
NBS Technologies Inc. - Product / Service
NBS Technologies Inc. - Key offerings
SWOT

15.15 Seaory Technology Co. Ltd.

Seaory Technology Co. Ltd. - Overview
Seaory Technology Co. Ltd. - Product / Service
Seaory Technology Co. Ltd. - Key offerings
SWOT

15.16 Swiftpro

Swiftpro - Overview
Swiftpro - Product / Service
Swiftpro - Key offerings
SWOT

15.17 Toppan Inc.

Toppan Inc. - Overview
Toppan Inc. - Business segments
Toppan Inc. - Key offerings
Toppan Inc. - Segment focus
SWOT

15.18 Zebra Technologies Corp.

Zebra Technologies Corp. - Overview
Zebra Technologies Corp. - Business segments
Zebra Technologies Corp. - Key news
Zebra Technologies Corp. - Key offerings
Zebra Technologies Corp. - Segment focus
SWOT

16. Appendix

16.1 Scope of the report

Market definition
Objectives
Notes and caveats

16.2 Inclusions and exclusions checklist

Inclusions checklist
Exclusions checklist

16.3 Currency conversion rates for US$

16.4 Research methodology

16.5 Data procurement

Information sources

16.6 Data validation

16.7 Validation techniques employed for market sizing

16.8 Data synthesis

16.9 360 degree market analysis

16.10 List of abbreviations

Research Methodology

Technavio presents a detailed picture of the market by way of study, synthesis, and summation of data from multiple sources. The analysts have presented the various facets of the market with a particular focus on identifying the key industry influencers. The data thus presented is comprehensive, reliable, and the result of extensive research, both primary and secondary.

INFORMATION SOURCES

Primary sources

  • Manufacturers and suppliers
  • Channel partners
  • Industry experts
  • Strategic decision makers

Secondary sources

  • Industry journals and periodicals
  • Government data
  • Financial reports of key industry players
  • Historical data
  • Press releases

DATA ANALYSIS

Data Synthesis

  • Collation of data
  • Estimation of key figures
  • Analysis of derived insights

Data Validation

  • Triangulation with data models
  • Reference against proprietary databases
  • Corroboration with industry experts

REPORT WRITING

Qualitative

  • Market drivers
  • Market challenges
  • Market trends
  • Five forces analysis

Quantitative

  • Market size and forecast
  • Market segmentation
  • Geographical insights
  • Competitive landscape

Interested in this report?

Get your sample now to see our research methodology and insights!

Download Now

Frequently Asked Questions

Retransfer Card Printers market growth will increase by USD 220.7 million during 2026-2030.

The Retransfer Card Printers market is expected to grow at a CAGR of 5.7% during 2026-2030.

Retransfer Card Printers market is segmented by Product (Single-sided printing, Double-sided printing) Application (Government, BFSI, Enterprise, Education, Healthcare) Connectivity (USB and Ethernet, Wi-Fi)

Ciaat, CIM S.p.A., Dai Nippon Printing Co. Ltd., DASCOM Corp., Emperor Technology, Entrust Corp., Evolis S.A., GET Group Holdings Ltd., HID Global Corp., Identification Systems Group, IDP Corp. Ltd., Magicard Ltd., Matica Fintec S.p.A., NBS Technologies Inc., Seaory Technology Co. Ltd., Swiftpro, Toppan Inc., Zebra Technologies Corp. are a few of the key vendors in the Retransfer Card Printers market.

North America will register the highest growth rate of 49.6% among the other regions. Therefore, the Retransfer Card Printers market in North America is expected to garner significant business opportunities for the vendors during the forecast period.

US, Canada, Mexico, Germany, UK, France, Italy, Spain, The Netherlands, China, Japan, India, South Korea, Australia, Indonesia, Brazil, Argentina, Chile, Saudi Arabia, UAE, South Africa, Israel, Turkey

  • Increasing demand for enhanced security and secure identification is the driving factor this market.

The Retransfer Card Printers market vendors should focus on grabbing business opportunities from the Product segment as it accounted for the largest market share in the base year.
RIA - Research AI Assistant
Ask RIA