Residential Solar Energy Storage Market Analysis, Size, and Forecast 2026-2030: APAC (China, India, and Australia), North America (US, Canada, and Mexico), Europe (Germany, UK, and France), South America (Brazil and Argentina), Middle East and Africa (South Africa, UAE, and Saudi Arabia), and Rest of World (ROW)

Residential Solar Energy Storage Market Analysis, Size, and Forecast 2026-2030:
APAC (China, India, and Australia), North America (US, Canada, and Mexico), Europe (Germany, UK, and France), South America (Brazil and Argentina), Middle East and Africa (South Africa, UAE, and Saudi Arabia), and Rest of World (ROW)

Published: Mar 2026 293 Pages SKU: IRTNTR41401

Market Overview at a Glance

$46.18 B
Market Opportunity
19.7%
CAGR 2025 - 2030
51.7%
APAC Growth
$15.81 B
Li-ion batteries segment 2024

Residential Solar Energy Storage Market Size 2026-2030

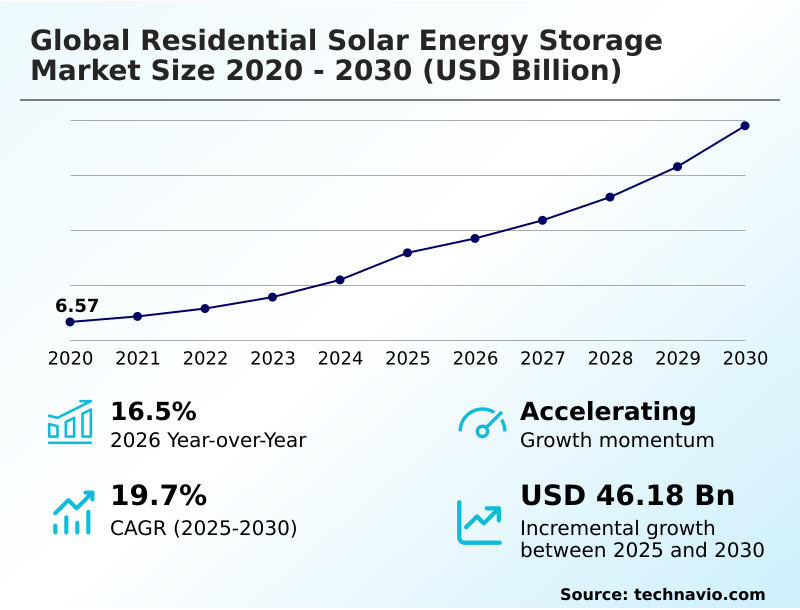
The residential solar energy storage market size is valued to increase by USD 46.18 billion, at a CAGR of 19.7% from 2025 to 2030. Reduction in PV and energy storage system costs will drive the residential solar energy storage market.

Major Market Trends & Insights

  • APAC dominated the market and accounted for a 51.7% growth during the forecast period.
  • By Technology - Li-ion batteries segment was valued at USD 15.81 billion in 2024
  • By Connectivity - On-grid segment accounted for the largest market revenue share in 2024

Market Size & Forecast

  • Market Opportunities: USD 71.32 billion
  • Market Future Opportunities: USD 46.18 billion
  • CAGR from 2025 to 2030 : 19.7%

Market Summary

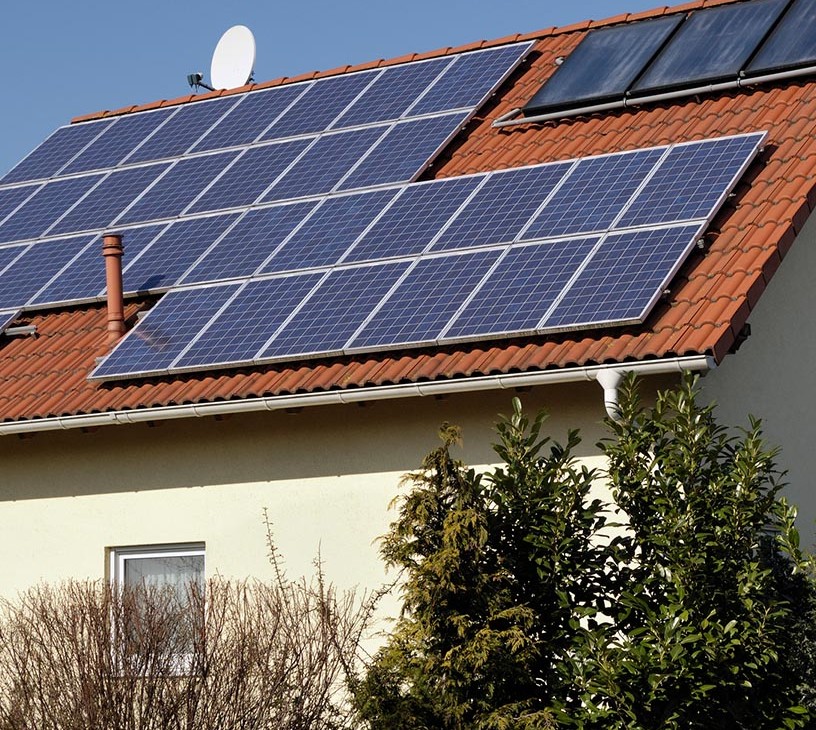
  • The residential solar energy storage market is undergoing significant transformation as households pursue greater energy independence and cost savings. This shift is driven by declining hardware costs, making integrated systems more accessible, and the phasing out of policies like feed-in tariff programs, which encourages storing excess power rather than selling it to the grid.
  • A key trend reshaping the industry is the aggregation of home batteries into a virtual power plant, allowing homeowners to participate in grid services. For instance, a utility can draw from thousands of connected homes to manage peak demand, which improves grid stability and provides a revenue stream for participants. This turns a passive backup system into an active asset.
  • However, the market is not without complexities. The high initial investment remains a barrier for many, and the emergence of competing solutions, such as vehicle-to-grid technology where an electric car can power a home, presents an alternative that may slow the adoption of dedicated stationary storage units. Navigating these dynamics is crucial for long-term growth.

What will be the Size of the Residential Solar Energy Storage Market during the forecast period?

Get Key Insights on Market Forecast (PDF) Request Free Sample

How is the Residential Solar Energy Storage Market Segmented?

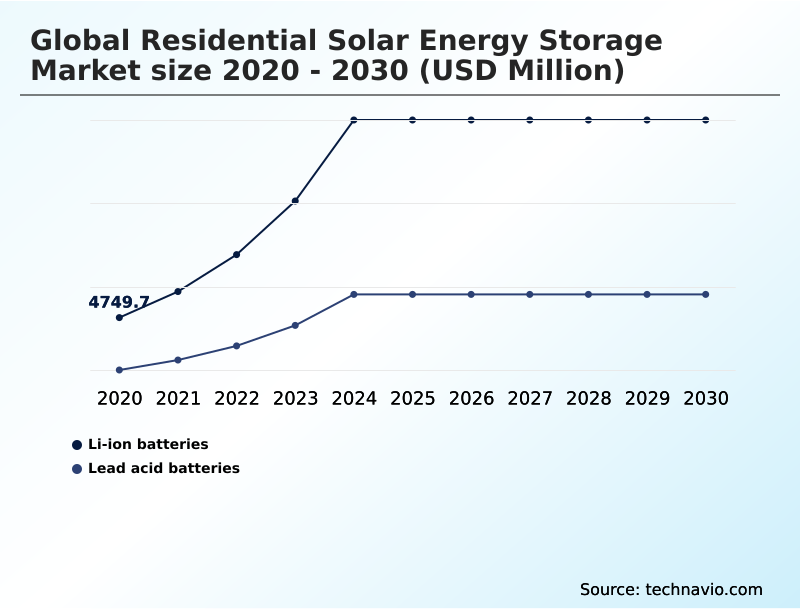
The residential solar energy storage industry research report provides comprehensive data (region-wise segment analysis), with forecasts and estimates in "USD million" for the period 2026-2030, as well as historical data from 2020-2024 for the following segments.

  • Technology
    • Li-ion batteries
    • Lead acid batteries
  • Connectivity
    • On-grid
    • Off-grid
  • Ownership
    • Customer-owned
    • Third-party owned
    • Utility-owned
  • Geography
    • APAC
      • China
      • India
      • Australia
    • North America
      • US
      • Canada
      • Mexico
    • Europe
      • Germany
      • UK
      • France
    • South America
      • Brazil
      • Argentina
    • Middle East and Africa
      • South Africa
      • UAE
      • Saudi Arabia
    • Rest of World (ROW)

By Technology Insights

The li-ion batteries segment is estimated to witness significant growth during the forecast period.

The residential solar energy storage market is increasingly defined by advancements in li-ion battery technology, which offers superior performance for homeowners seeking home energy independence.

Chemistries like lithium iron phosphate and nickel manganese cobalt are favored for their high energy density metrics and extended charge discharge cycles, supporting the shift toward total home electrification.

The integration of smart battery storage into smart home ecosystems enables a bidirectional flow of energy, turning passive homes into active prosumer electricity models.

Innovations are yielding tangible results, with some modular systems achieving a 20% increase in storage capacity within the same physical footprint, enhancing energy self consumption and bolstering energy resilience against grid disruptions, making them a cornerstone of modern, sustainable living.

Request Free Sample

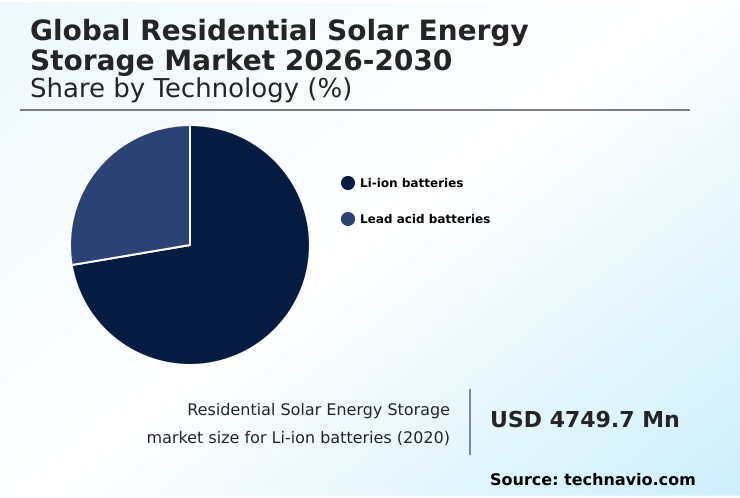
The Li-ion batteries segment was valued at USD 15.81 billion in 2024 and showed a gradual increase during the forecast period.

Request Free Sample

Regional Analysis

APAC is estimated to contribute 51.7% to the growth of the global market during the forecast period.Technavio’s analysts have elaborately explained the regional trends and drivers that shape the market during the forecast period.

See How Residential Solar Energy Storage Market Demand is Rising in APAC Request Free Sample

The geographic landscape is led by the APAC region, which is poised to contribute over 51% of the market's incremental expansion, driven by high rooftop photovoltaic penetration in countries like Australia and China.

This region's growth, which outpaces others by nearly 20% annually, stems from government support for decentralized power generation and consumer demand for peak price arbitrage. North America follows, with a focus on grid resilience and on-grid connectivity solutions.

Europe emphasizes achieving zero-energy home standards, driving the integration of storage into new constructions.

In developing regions within South America and Africa, the focus is on energy security through off-grid systems and smart microgrids, often utilizing cost-effective technologies like absorbent glass mat and valve-regulated lead-acid batteries to provide essential power and reduce carbon footprint.

Market Dynamics

Our researchers analyzed the data with 2025 as the base year, along with the key drivers, trends, and challenges. A holistic analysis of drivers will help companies refine their marketing strategies to gain a competitive advantage.

  • The Global Residential Solar Energy Storage Market is a complex ecosystem where homeowners navigate numerous technical and financial considerations. A primary concern is the total cost of residential battery modules and the long-term li-ion battery degradation over time, which directly affects the return on investment.
  • The role of AI in energy management is becoming critical for optimizing self-consumption with battery storage, especially as the impact of net metering changes alters grid-tied economics. Consumers are evaluating the benefits of virtual power plant participation against the utility of vehicle-to-grid as a storage alternative.
  • Making an informed decision involves comparing lead-acid vs li-ion for solar applications and understanding the safety standards for home battery installation. Financing options for home solar storage are diversifying, including customer-owned solar storage and third-party owned solar lease models, the latter of which can shorten payback periods by up to 30%.
  • The incentives for residential energy storage and the emergence of utility-owned residential battery programs further influence purchasing decisions. As technologies for long duration storage for homes advance and the solid-state vs liquid electrolyte batteries debate continues, the market is also adapting to residential storage for peak shaving and integration of smart battery storage for home automation.

What are the key market drivers leading to the rise in the adoption of Residential Solar Energy Storage Industry?

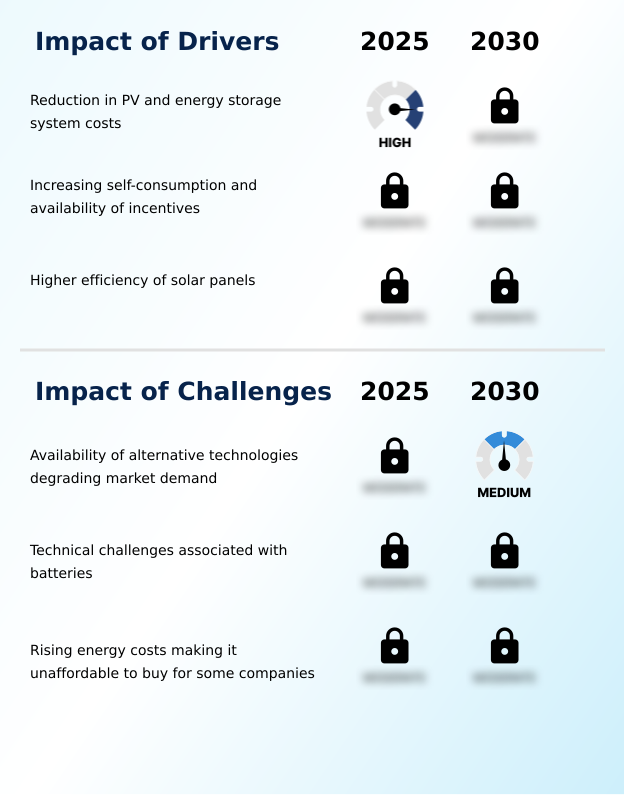
  • The reduction in costs for both photovoltaic (PV) systems and associated energy storage solutions serves as a primary driver for the expansion of the residential solar energy storage market.

  • The increasing renewable energy adoption is primarily driven by economic and technological factors. The phasing out of feed-in tariff programs incentivizes homeowners to maximize self-use through time-of-use shifting, bolstering energy price stability and household energy autonomy.
  • Concurrently, advancements in solar panel efficiency are significant; innovations in bifacial solar cells have achieved conversion efficiencies of 27% in lab settings, generating more power from limited space. This enhances the value of storage.
  • Manufacturing optimizations in power electronics like inverters and charge controllers have also been critical, with some producers reducing module costs by 15% through automation.
  • These factors collectively lower the barrier to entry for achieving energy self-sufficiency, making integrated systems viable for both grid-connected and off-grid living using robust microgrid configurations.

What are the market trends shaping the Residential Solar Energy Storage Industry?

  • Residential energy storage as virtual power plants represents a transformative trend that turns individual households into active participants in the global energy market. This model allows aggregated home batteries to provide grid services, enhancing stability and creating value for homeowners.

  • The evolution toward decentralized energy resources is a defining trend, with virtual power plant aggregations reshaping grid dynamics. These domestic virtual power plants, which can improve frequency response by over 25% compared to legacy systems, are enabled by customer-owned models and third-party owned agreements.
  • Concurrently, the push for net-zero homes and green building certifications is driving market integration, with some regional building codes now mandating solar-ready infrastructure in over 40% of new constructions. This creates a predictable demand pipeline for both standalone systems and utility-owned assets.
  • This shift encourages energy community sharing and transforms residential systems into active grid components, managed through sophisticated automated energy management platforms, embodying an energy as a service model.

What challenges does the Residential Solar Energy Storage Industry face during its growth?

  • A key challenge for the residential solar energy storage market is the growing availability of alternative technologies, which can potentially fragment consumer demand and slow adoption rates.

  • The market faces challenges from alternative technologies and inherent system limitations. The rise of vehicle-to-grid integration and experimental hydrogen fuel cells presents substitutes for dedicated whole-home backup solutions.
  • Technical issues with some battery chemistries, such as the need for robust thermal runaway prevention and capacity degradation where systems can lose up to 20% of capacity in the first 7 years, remain a concern for consumers.
  • While mature technologies like lead acid battery units offer a high recyclability rate of over 99%, aligning with circular economy goals, they lack the performance of modern systems. The high upfront cost also remains a barrier, complicating decisions for homeowners evaluating net energy metering benefits.
  • The long-term promise of solid-state batteries offers a path forward, but near-term competition from technologies like the solid oxide fuel cell fragments demand.

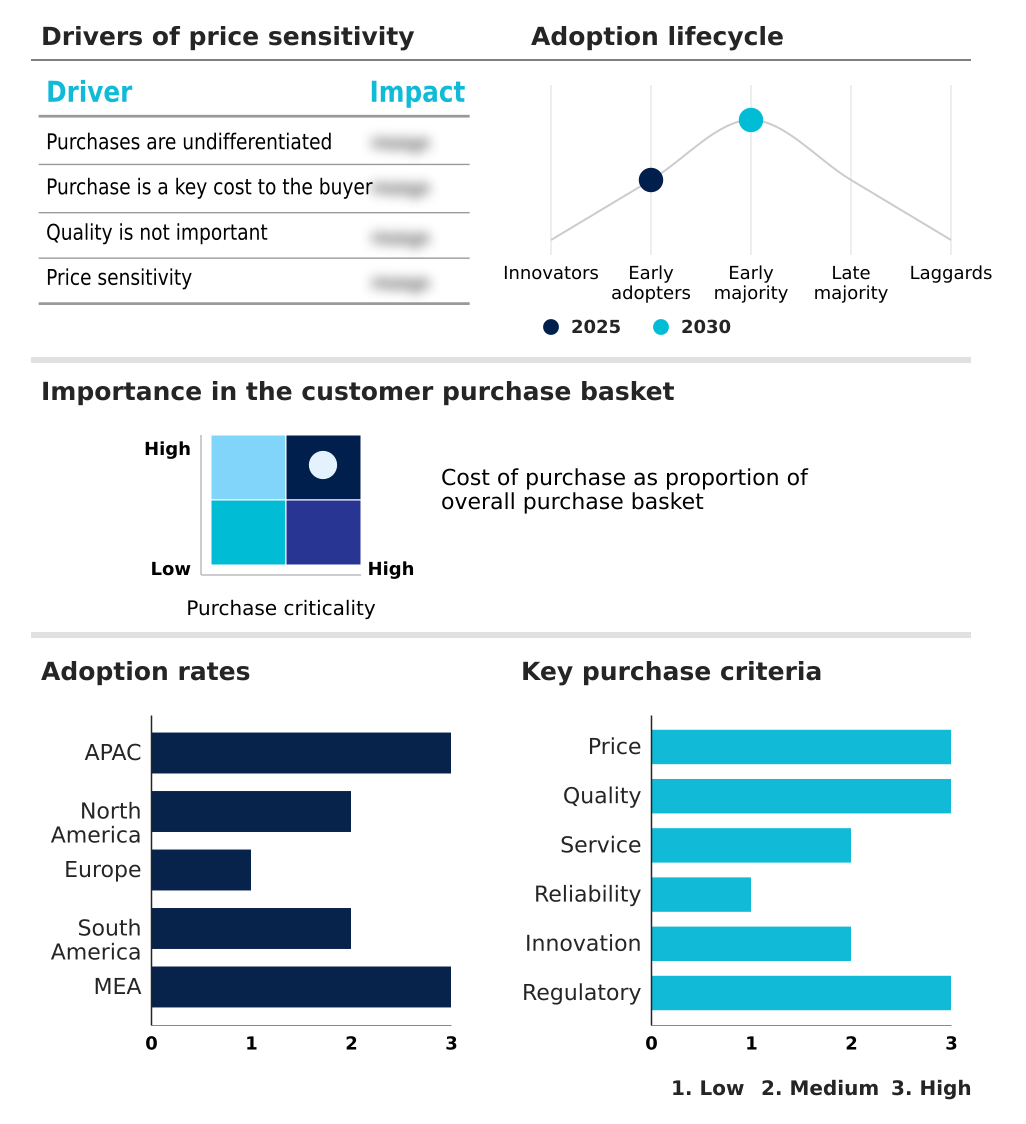
Exclusive Technavio Analysis on Customer Landscape

The residential solar energy storage market forecasting report includes the adoption lifecycle of the market, covering from the innovator’s stage to the laggard’s stage. It focuses on adoption rates in different regions based on penetration. Furthermore, the residential solar energy storage market report also includes key purchase criteria and drivers of price sensitivity to help companies evaluate and develop their market growth analysis strategies.

Customer Landscape of Residential Solar Energy Storage Industry

Competitive Landscape

Companies are implementing various strategies, such as strategic alliances, residential solar energy storage market forecast, partnerships, mergers and acquisitions, geographical expansion, and product/service launches, to enhance their presence in the industry.

Alpha ESS Co. Ltd. - Analysis of entities designing, developing, and selling integrated solar-plus-storage solutions, including microinverter technologies, for the residential photovoltaic sector.

The industry research and growth report includes detailed analyses of the competitive landscape of the market and information about key companies, including:

  • Alpha ESS Co. Ltd.
  • Bluetti Power Inc.
  • BYD Co. Ltd.
  • Dyness Digital Energy Co. Ltd.
  • Enphase Energy Inc.
  • Generac Power Systems Inc.
  • GoodWe Technologies Co. Ltd.
  • Hitachi Energy Ltd.
  • Huawei Technologies Co. Ltd.
  • LG Energy Solution Ltd.
  • Panasonic Holdings Corp.
  • Redback Operation Pty Ltd.
  • SolarEdge Technologies Inc.
  • sonnen GmbH
  • Tesla Inc.
  • Tigo Energy Inc.
  • VARTA AG

Qualitative and quantitative analysis of companies has been conducted to help clients understand the wider business environment as well as the strengths and weaknesses of key industry players. Data is qualitatively analyzed to categorize companies as pure play, category-focused, industry-focused, and diversified; it is quantitatively analyzed to categorize companies as dominant, leading, strong, tentative, and weak.

Recent Development and News in Residential solar energy storage market

  • In September 2025, BYD Co. Ltd. announced it reduced the production cost of its residential battery modules by fifteen percent by implementing a new automated assembly process in its latest gigafactory.
  • In April 2025, Enphase Energy Inc. expanded its partnership with local utilities to offer a new rebate program providing direct incentives for homeowners who install smart battery storage.
  • In May 2025, Samsung SDI introduced a new line of solid-state residential battery systems designed to offer superior safety and longer lifespans compared to traditional liquid electrolyte units.
  • In October 2025, Tesla Inc. inaugurated a large-scale residential virtual power plant program by connecting over fifty thousand Powerwall units to a regional grid to provide emergency frequency response services.

Dive into Technavio’s robust research methodology, blending expert interviews, extensive data synthesis, and validated models for unparalleled Residential Solar Energy Storage Market insights. See full methodology.

Market Scope
Page number 293
Base year 2025
Historic period 2020-2024
Forecast period 2026-2030
Growth momentum & CAGR Accelerate at a CAGR of 19.7%
Market growth 2026-2030 USD 46180.1 million
Market structure Fragmented
YoY growth 2025-2026(%) 16.5%
Key countries China, India, Australia, Japan, South Korea, Indonesia, US, Canada, Mexico, Germany, UK, France, Italy, Spain, The Netherlands, Brazil, Argentina, Chile, South Africa, UAE, Saudi Arabia, Turkey and Israel
Competitive landscape Leading Companies, Market Positioning of Companies, Competitive Strategies, and Industry Risks

Request Free Sample

Research Analyst Overview

  • The market's expansion is underpinned by key technological advancements across the entire system architecture. Core li-ion battery technology, including lithium iron phosphate and nickel manganese cobalt chemistries, continues to improve, offering better energy density metrics and more charge discharge cycles.
  • These systems rely on sophisticated battery management systems and power electronics, such as inverters and charge controllers, for efficient operation and thermal runaway prevention. The drive toward energy self-sufficiency is supported by increasing solar panel efficiency, with innovations like bifacial solar cells boosting generation. This makes on-grid connectivity with time-of-use shifting and off-grid systems with deep cycle batteries more viable.
  • Business models are evolving, with customer-owned models, third-party owned agreements, and utility-owned assets creating diverse market pathways. The rise of decentralized energy resources is enabling smart microgrids and virtual power plant concepts, further enhanced by vehicle-to-grid integration. While legacy technologies like lead acid battery units persist, the future points toward advanced flywheel systems and solid-state batteries.
  • Manufacturing efficiencies have enabled a 15% reduction in module costs, making the transition away from traditional feed-in tariff programs more attractive for homeowners aiming to create net-zero homes.

What are the Key Data Covered in this Residential Solar Energy Storage Market Research and Growth Report?

  • What is the expected growth of the Residential Solar Energy Storage Market between 2026 and 2030?

    • USD 46.18 billion, at a CAGR of 19.7%

  • What segmentation does the market report cover?

    • The report is segmented by Technology (Li-ion batteries, and Lead acid batteries), Connectivity (On-grid, and Off-grid), Ownership (Customer-owned, Third-party owned, and Utility-owned) and Geography (APAC, North America, Europe, South America, Middle East and Africa)

  • Which regions are analyzed in the report?

    • APAC, North America, Europe, South America and Middle East and Africa

  • What are the key growth drivers and market challenges?

    • Reduction in PV and energy storage system costs, Availability of alternative technologies degrading market demand

  • Who are the major players in the Residential Solar Energy Storage Market?

    • Alpha ESS Co. Ltd., Bluetti Power Inc., BYD Co. Ltd., Dyness Digital Energy Co. Ltd., Enphase Energy Inc., Generac Power Systems Inc., GoodWe Technologies Co. Ltd., Hitachi Energy Ltd., Huawei Technologies Co. Ltd., LG Energy Solution Ltd., Panasonic Holdings Corp., Redback Operation Pty Ltd., SolarEdge Technologies Inc., sonnen GmbH, Tesla Inc., Tigo Energy Inc. and VARTA AG

Market Research Insights

  • The market is shaped by a convergence of economic incentives and technological advancements fostering home energy independence. The drive for energy self consumption is supported by policies encouraging renewable energy adoption, while the pursuit of energy resilience is a response to increasing grid instability.
  • Innovations in automated energy management now allow systems to achieve cost reductions of 15% through optimized production. Furthermore, the goal of carbon footprint reduction is made more attainable as new solar panels reach 27% conversion efficiency, maximizing power generation.
  • This creates a compelling case for smart home ecosystems that integrate storage as a core component, enabling households to achieve greater control over their energy future and contribute to decentralized power generation.

We can help! Our analysts can customize this residential solar energy storage market research report to meet your requirements.

Get in touch

1. Executive Summary

1.1 Market overview

Executive Summary - Chart on Market Overview
Executive Summary - Data Table on Market Overview
Executive Summary - Chart on Global Market Characteristics
Executive Summary - Chart on Market by Geography
Executive Summary - Chart on Market Segmentation by Technology
Executive Summary - Chart on Market Segmentation by Connectivity
Executive Summary - Chart on Market Segmentation by Ownership
Executive Summary - Chart on Incremental Growth
Executive Summary - Data Table on Incremental Growth
Executive Summary - Chart on Company Market Positioning

2. Technavio Analysis

2.1 Analysis of price sensitivity, lifecycle, customer purchase basket, adoption rates, and purchase criteria

2.2 Criticality of inputs and Factors of differentiation

Chart on Overview on criticality of inputs and factors of differentiation

2.3 Factors of disruption

Chart on Overview on factors of disruption

2.4 Impact of drivers and challenges

Chart on Impact of drivers and challenges in 2025 and 2030

3. Market Landscape

3.1 Market ecosystem

Chart on Parent Market
Data Table on - Parent Market

3.2 Market characteristics

Chart on Market characteristics analysis

3.3 Value chain analysis

Chart on Value chain analysis

4. Market Sizing

4.1 Market definition

Data Table on Offerings of companies included in the market definition

4.2 Market segment analysis

Market segments

4.3 Market size 2025

4.4 Market outlook: Forecast for 2025-2030

Chart on Global - Market size and forecast 2025-2030 ($ million)
Data Table on Global - Market size and forecast 2025-2030 ($ million)
Chart on Global Market: Year-over-year growth 2025-2030 (%)
Data Table on Global Market: Year-over-year growth 2025-2030 (%)

5. Historic Market Size

5.1 Global Residential Solar Energy Storage Market 2020 - 2024

Historic Market Size - Data Table on Global Residential Solar Energy Storage Market 2020 - 2024 ($ million)

5.2 Technology segment analysis 2020 - 2024

Historic Market Size - Technology Segment 2020 - 2024 ($ million)

5.3 Connectivity segment analysis 2020 - 2024

Historic Market Size - Connectivity Segment 2020 - 2024 ($ million)

5.4 Ownership segment analysis 2020 - 2024

Historic Market Size - Ownership Segment 2020 - 2024 ($ million)

5.5 Geography segment analysis 2020 - 2024

Historic Market Size - Geography Segment 2020 - 2024 ($ million)

5.6 Country segment analysis 2020 - 2024

Historic Market Size - Country Segment 2020 - 2024 ($ million)

6. Qualitative Analysis

6.1 Impact of AI on Global Residential Solar Energy Storage Market

6.2 Impact of Geopolitical Conflicts on Global Residential Solar Energy Storage Market

7. Five Forces Analysis

7.1 Five forces summary

Five forces analysis - Comparison between 2025 and 2030

7.2 Bargaining power of buyers

Bargaining power of buyers - Impact of key factors 2025 and 2030

7.3 Bargaining power of suppliers

Bargaining power of suppliers - Impact of key factors in 2025 and 2030

7.4 Threat of new entrants

Threat of new entrants - Impact of key factors in 2025 and 2030

7.5 Threat of substitutes

Threat of substitutes - Impact of key factors in 2025 and 2030

7.6 Threat of rivalry

Threat of rivalry - Impact of key factors in 2025 and 2030

7.7 Market condition

Chart on Market condition - Five forces 2025 and 2030

8. Market Segmentation by Technology

8.1 Market segments

Chart on Technology - Market share 2025-2030 (%)
Data Table on Technology - Market share 2025-2030 (%)

8.2 Comparison by Technology

Chart on Comparison by Technology
Data Table on Comparison by Technology

8.3 Li-ion batteries - Market size and forecast 2025-2030

Chart on Li-ion batteries - Market size and forecast 2025-2030 ($ million)
Data Table on Li-ion batteries - Market size and forecast 2025-2030 ($ million)
Chart on Li-ion batteries - Year-over-year growth 2025-2030 (%)
Data Table on Li-ion batteries - Year-over-year growth 2025-2030 (%)

8.4 Lead acid batteries - Market size and forecast 2025-2030

Chart on Lead acid batteries - Market size and forecast 2025-2030 ($ million)
Data Table on Lead acid batteries - Market size and forecast 2025-2030 ($ million)
Chart on Lead acid batteries - Year-over-year growth 2025-2030 (%)
Data Table on Lead acid batteries - Year-over-year growth 2025-2030 (%)

8.5 Market opportunity by Technology

Market opportunity by Technology ($ million)
Data Table on Market opportunity by Technology ($ million)

9. Market Segmentation by Connectivity

9.1 Market segments

Chart on Connectivity - Market share 2025-2030 (%)
Data Table on Connectivity - Market share 2025-2030 (%)

9.2 Comparison by Connectivity

Chart on Comparison by Connectivity
Data Table on Comparison by Connectivity

9.3 On-grid - Market size and forecast 2025-2030

Chart on On-grid - Market size and forecast 2025-2030 ($ million)
Data Table on On-grid - Market size and forecast 2025-2030 ($ million)
Chart on On-grid - Year-over-year growth 2025-2030 (%)
Data Table on On-grid - Year-over-year growth 2025-2030 (%)

9.4 Off-grid - Market size and forecast 2025-2030

Chart on Off-grid - Market size and forecast 2025-2030 ($ million)
Data Table on Off-grid - Market size and forecast 2025-2030 ($ million)
Chart on Off-grid - Year-over-year growth 2025-2030 (%)
Data Table on Off-grid - Year-over-year growth 2025-2030 (%)

9.5 Market opportunity by Connectivity

Market opportunity by Connectivity ($ million)
Data Table on Market opportunity by Connectivity ($ million)

10. Market Segmentation by Ownership

10.1 Market segments

Chart on Ownership - Market share 2025-2030 (%)
Data Table on Ownership - Market share 2025-2030 (%)

10.2 Comparison by Ownership

Chart on Comparison by Ownership
Data Table on Comparison by Ownership

10.3 Customer-owned - Market size and forecast 2025-2030

Chart on Customer-owned - Market size and forecast 2025-2030 ($ million)
Data Table on Customer-owned - Market size and forecast 2025-2030 ($ million)
Chart on Customer-owned - Year-over-year growth 2025-2030 (%)
Data Table on Customer-owned - Year-over-year growth 2025-2030 (%)

10.4 Third-party owned - Market size and forecast 2025-2030

Chart on Third-party owned - Market size and forecast 2025-2030 ($ million)
Data Table on Third-party owned - Market size and forecast 2025-2030 ($ million)
Chart on Third-party owned - Year-over-year growth 2025-2030 (%)
Data Table on Third-party owned - Year-over-year growth 2025-2030 (%)

10.5 Utility-owned - Market size and forecast 2025-2030

Chart on Utility-owned - Market size and forecast 2025-2030 ($ million)
Data Table on Utility-owned - Market size and forecast 2025-2030 ($ million)
Chart on Utility-owned - Year-over-year growth 2025-2030 (%)
Data Table on Utility-owned - Year-over-year growth 2025-2030 (%)

10.6 Market opportunity by Ownership

Market opportunity by Ownership ($ million)
Data Table on Market opportunity by Ownership ($ million)

11. Customer Landscape

11.1 Customer landscape overview

Analysis of price sensitivity, lifecycle, customer purchase basket, adoption rates, and purchase criteria

12. Geographic Landscape

12.1 Geographic segmentation

Chart on Market share by geography 2025-2030 (%)
Data Table on Market share by geography 2025-2030 (%)

12.2 Geographic comparison

Chart on Geographic comparison
Data Table on Geographic comparison

12.3 APAC - Market size and forecast 2025-2030

Chart on APAC - Market size and forecast 2025-2030 ($ million)
Data Table on APAC - Market size and forecast 2025-2030 ($ million)
Chart on APAC - Year-over-year growth 2025-2030 (%)
Data Table on APAC - Year-over-year growth 2025-2030 (%)
Chart on Regional Comparison - APAC
Data Table on Regional Comparison - APAC

12.3.1 China - Market size and forecast 2025-2030

Chart on China - Market size and forecast 2025-2030 ($ million)
Data Table on China - Market size and forecast 2025-2030 ($ million)
Chart on China - Year-over-year growth 2025-2030 (%)
Data Table on China - Year-over-year growth 2025-2030 (%)

12.3.2 India - Market size and forecast 2025-2030

Chart on India - Market size and forecast 2025-2030 ($ million)
Data Table on India - Market size and forecast 2025-2030 ($ million)
Chart on India - Year-over-year growth 2025-2030 (%)
Data Table on India - Year-over-year growth 2025-2030 (%)

12.3.3 Australia - Market size and forecast 2025-2030

Chart on Australia - Market size and forecast 2025-2030 ($ million)
Data Table on Australia - Market size and forecast 2025-2030 ($ million)
Chart on Australia - Year-over-year growth 2025-2030 (%)
Data Table on Australia - Year-over-year growth 2025-2030 (%)

12.3.4 Japan - Market size and forecast 2025-2030

Chart on Japan - Market size and forecast 2025-2030 ($ million)
Data Table on Japan - Market size and forecast 2025-2030 ($ million)
Chart on Japan - Year-over-year growth 2025-2030 (%)
Data Table on Japan - Year-over-year growth 2025-2030 (%)

12.3.5 South Korea - Market size and forecast 2025-2030

Chart on South Korea - Market size and forecast 2025-2030 ($ million)
Data Table on South Korea - Market size and forecast 2025-2030 ($ million)
Chart on South Korea - Year-over-year growth 2025-2030 (%)
Data Table on South Korea - Year-over-year growth 2025-2030 (%)

12.3.6 Indonesia - Market size and forecast 2025-2030

Chart on Indonesia - Market size and forecast 2025-2030 ($ million)
Data Table on Indonesia - Market size and forecast 2025-2030 ($ million)
Chart on Indonesia - Year-over-year growth 2025-2030 (%)
Data Table on Indonesia - Year-over-year growth 2025-2030 (%)

12.4 North America - Market size and forecast 2025-2030

Chart on North America - Market size and forecast 2025-2030 ($ million)
Data Table on North America - Market size and forecast 2025-2030 ($ million)
Chart on North America - Year-over-year growth 2025-2030 (%)
Data Table on North America - Year-over-year growth 2025-2030 (%)
Chart on Regional Comparison - North America
Data Table on Regional Comparison - North America

12.4.1 US - Market size and forecast 2025-2030

Chart on US - Market size and forecast 2025-2030 ($ million)
Data Table on US - Market size and forecast 2025-2030 ($ million)
Chart on US - Year-over-year growth 2025-2030 (%)
Data Table on US - Year-over-year growth 2025-2030 (%)

12.4.2 Canada - Market size and forecast 2025-2030

Chart on Canada - Market size and forecast 2025-2030 ($ million)
Data Table on Canada - Market size and forecast 2025-2030 ($ million)
Chart on Canada - Year-over-year growth 2025-2030 (%)
Data Table on Canada - Year-over-year growth 2025-2030 (%)

12.4.3 Mexico - Market size and forecast 2025-2030

Chart on Mexico - Market size and forecast 2025-2030 ($ million)
Data Table on Mexico - Market size and forecast 2025-2030 ($ million)
Chart on Mexico - Year-over-year growth 2025-2030 (%)
Data Table on Mexico - Year-over-year growth 2025-2030 (%)

12.5 Europe - Market size and forecast 2025-2030

Chart on Europe - Market size and forecast 2025-2030 ($ million)
Data Table on Europe - Market size and forecast 2025-2030 ($ million)
Chart on Europe - Year-over-year growth 2025-2030 (%)
Data Table on Europe - Year-over-year growth 2025-2030 (%)
Chart on Regional Comparison - Europe
Data Table on Regional Comparison - Europe

12.5.1 Germany - Market size and forecast 2025-2030

Chart on Germany - Market size and forecast 2025-2030 ($ million)
Data Table on Germany - Market size and forecast 2025-2030 ($ million)
Chart on Germany - Year-over-year growth 2025-2030 (%)
Data Table on Germany - Year-over-year growth 2025-2030 (%)

12.5.2 UK - Market size and forecast 2025-2030

Chart on UK - Market size and forecast 2025-2030 ($ million)
Data Table on UK - Market size and forecast 2025-2030 ($ million)
Chart on UK - Year-over-year growth 2025-2030 (%)
Data Table on UK - Year-over-year growth 2025-2030 (%)

12.5.3 France - Market size and forecast 2025-2030

Chart on France - Market size and forecast 2025-2030 ($ million)
Data Table on France - Market size and forecast 2025-2030 ($ million)
Chart on France - Year-over-year growth 2025-2030 (%)
Data Table on France - Year-over-year growth 2025-2030 (%)

12.5.4 Italy - Market size and forecast 2025-2030

Chart on Italy - Market size and forecast 2025-2030 ($ million)
Data Table on Italy - Market size and forecast 2025-2030 ($ million)
Chart on Italy - Year-over-year growth 2025-2030 (%)
Data Table on Italy - Year-over-year growth 2025-2030 (%)

12.5.5 Spain - Market size and forecast 2025-2030

Chart on Spain - Market size and forecast 2025-2030 ($ million)
Data Table on Spain - Market size and forecast 2025-2030 ($ million)
Chart on Spain - Year-over-year growth 2025-2030 (%)
Data Table on Spain - Year-over-year growth 2025-2030 (%)

12.5.6 The Netherlands - Market size and forecast 2025-2030

Chart on The Netherlands - Market size and forecast 2025-2030 ($ million)
Data Table on The Netherlands - Market size and forecast 2025-2030 ($ million)
Chart on The Netherlands - Year-over-year growth 2025-2030 (%)
Data Table on The Netherlands - Year-over-year growth 2025-2030 (%)

12.6 South America - Market size and forecast 2025-2030

Chart on South America - Market size and forecast 2025-2030 ($ million)
Data Table on South America - Market size and forecast 2025-2030 ($ million)
Chart on South America - Year-over-year growth 2025-2030 (%)
Data Table on South America - Year-over-year growth 2025-2030 (%)
Chart on Regional Comparison - South America
Data Table on Regional Comparison - South America

12.6.1 Brazil - Market size and forecast 2025-2030

Chart on Brazil - Market size and forecast 2025-2030 ($ million)
Data Table on Brazil - Market size and forecast 2025-2030 ($ million)
Chart on Brazil - Year-over-year growth 2025-2030 (%)
Data Table on Brazil - Year-over-year growth 2025-2030 (%)

12.6.2 Argentina - Market size and forecast 2025-2030

Chart on Argentina - Market size and forecast 2025-2030 ($ million)
Data Table on Argentina - Market size and forecast 2025-2030 ($ million)
Chart on Argentina - Year-over-year growth 2025-2030 (%)
Data Table on Argentina - Year-over-year growth 2025-2030 (%)

12.6.3 Chile - Market size and forecast 2025-2030

Chart on Chile - Market size and forecast 2025-2030 ($ million)
Data Table on Chile - Market size and forecast 2025-2030 ($ million)
Chart on Chile - Year-over-year growth 2025-2030 (%)
Data Table on Chile - Year-over-year growth 2025-2030 (%)

12.7 Middle East and Africa - Market size and forecast 2025-2030

Chart on Middle East and Africa - Market size and forecast 2025-2030 ($ million)
Data Table on Middle East and Africa - Market size and forecast 2025-2030 ($ million)
Chart on Middle East and Africa - Year-over-year growth 2025-2030 (%)
Data Table on Middle East and Africa - Year-over-year growth 2025-2030 (%)
Chart on Regional Comparison - Middle East and Africa
Data Table on Regional Comparison - Middle East and Africa

12.7.1 South Africa - Market size and forecast 2025-2030

Chart on South Africa - Market size and forecast 2025-2030 ($ million)
Data Table on South Africa - Market size and forecast 2025-2030 ($ million)
Chart on South Africa - Year-over-year growth 2025-2030 (%)
Data Table on South Africa - Year-over-year growth 2025-2030 (%)

12.7.2 UAE - Market size and forecast 2025-2030

Chart on UAE - Market size and forecast 2025-2030 ($ million)
Data Table on UAE - Market size and forecast 2025-2030 ($ million)
Chart on UAE - Year-over-year growth 2025-2030 (%)
Data Table on UAE - Year-over-year growth 2025-2030 (%)

12.7.3 Saudi Arabia - Market size and forecast 2025-2030

Chart on Saudi Arabia - Market size and forecast 2025-2030 ($ million)
Data Table on Saudi Arabia - Market size and forecast 2025-2030 ($ million)
Chart on Saudi Arabia - Year-over-year growth 2025-2030 (%)
Data Table on Saudi Arabia - Year-over-year growth 2025-2030 (%)

12.7.4 Turkey - Market size and forecast 2025-2030

Chart on Turkey - Market size and forecast 2025-2030 ($ million)
Data Table on Turkey - Market size and forecast 2025-2030 ($ million)
Chart on Turkey - Year-over-year growth 2025-2030 (%)
Data Table on Turkey - Year-over-year growth 2025-2030 (%)

12.7.5 Israel - Market size and forecast 2025-2030

Chart on Israel - Market size and forecast 2025-2030 ($ million)
Data Table on Israel - Market size and forecast 2025-2030 ($ million)
Chart on Israel - Year-over-year growth 2025-2030 (%)
Data Table on Israel - Year-over-year growth 2025-2030 (%)

12.8 Market opportunity by geography

Market opportunity by geography ($ million)
Data Tables on Market opportunity by geography ($ million)

13. Drivers, Challenges, and Opportunity

13.1 Market drivers

Reduction in PV and energy storage system costs
Increasing self-consumption and availability of incentives
Higher efficiency of solar panels

13.2 Market challenges

Availability of alternative technologies degrading market demand
Technical challenges associated with batteries
Rising energy costs making it unaffordable to buy for some companies

13.3 Impact of drivers and challenges

Impact of drivers and challenges in 2025 and 2030

13.4 Market opportunities

Residential energy storage as virtual power plants
Market attracting new companies
Increased green construction spending and zero-energy homes

14. Competitive Landscape

14.1 Overview

14.2

Overview on criticality of inputs and factors of differentiation

14.3 Landscape disruption

Overview on factors of disruption

14.4 Industry risks

Impact of key risks on business

15. Competitive Analysis

15.1 Companies profiled

Companies covered

15.2 Company ranking index

15.3 Market positioning of companies

Matrix on companies position and classification

15.4 Alpha ESS Co. Ltd.

Alpha ESS Co. Ltd. - Overview
Alpha ESS Co. Ltd. - Product / Service
Alpha ESS Co. Ltd. - Key offerings
SWOT

15.5 BYD Co. Ltd.

BYD Co. Ltd. - Overview
BYD Co. Ltd. - Business segments
BYD Co. Ltd. - Key news
BYD Co. Ltd. - Key offerings
BYD Co. Ltd. - Segment focus
SWOT

15.6 Enphase Energy Inc.

Enphase Energy Inc. - Overview
Enphase Energy Inc. - Product / Service
Enphase Energy Inc. - Key news
Enphase Energy Inc. - Key offerings
SWOT

15.7 Generac Power Systems Inc.

Generac Power Systems Inc. - Overview
Generac Power Systems Inc. - Business segments
Generac Power Systems Inc. - Key news
Generac Power Systems Inc. - Key offerings
Generac Power Systems Inc. - Segment focus
SWOT

15.8 GoodWe Technologies Co. Ltd.

GoodWe Technologies Co. Ltd. - Overview
GoodWe Technologies Co. Ltd. - Product / Service
GoodWe Technologies Co. Ltd. - Key offerings
SWOT

15.9 Hitachi Energy Ltd.

Hitachi Energy Ltd. - Overview
Hitachi Energy Ltd. - Product / Service
Hitachi Energy Ltd. - Key offerings
SWOT

15.10 Huawei Technologies Co. Ltd.

Huawei Technologies Co. Ltd. - Overview
Huawei Technologies Co. Ltd. - Business segments
Huawei Technologies Co. Ltd. - Key news
Huawei Technologies Co. Ltd. - Key offerings
Huawei Technologies Co. Ltd. - Segment focus
SWOT

15.11 LG Energy Solution Ltd.

LG Energy Solution Ltd. - Overview
LG Energy Solution Ltd. - Product / Service
LG Energy Solution Ltd. - Key news
LG Energy Solution Ltd. - Key offerings
SWOT

15.12 Panasonic Holdings Corp.

Panasonic Holdings Corp. - Overview
Panasonic Holdings Corp. - Business segments
Panasonic Holdings Corp. - Key news
Panasonic Holdings Corp. - Key offerings
Panasonic Holdings Corp. - Segment focus
SWOT

15.13 Redback Operation Pty Ltd.

Redback Operation Pty Ltd. - Overview
Redback Operation Pty Ltd. - Product / Service
Redback Operation Pty Ltd. - Key offerings
SWOT

15.14 SolarEdge Technologies Inc.

SolarEdge Technologies Inc. - Overview
SolarEdge Technologies Inc. - Product / Service
SolarEdge Technologies Inc. - Key offerings
SWOT

15.15 sonnen GmbH

sonnen GmbH - Overview
sonnen GmbH - Product / Service
sonnen GmbH - Key offerings
SWOT

15.16 Tesla Inc.

Tesla Inc. - Overview
Tesla Inc. - Business segments
Tesla Inc. - Key news
Tesla Inc. - Key offerings
Tesla Inc. - Segment focus
SWOT

15.17 Tigo Energy Inc.

Tigo Energy Inc. - Overview
Tigo Energy Inc. - Product / Service
Tigo Energy Inc. - Key offerings
SWOT

15.18 VARTA AG

VARTA AG - Overview
VARTA AG - Business segments
VARTA AG - Key news
VARTA AG - Key offerings
VARTA AG - Segment focus
SWOT

16. Appendix

16.1 Scope of the report

Market definition
Objectives
Notes and caveats

16.2 Inclusions and exclusions checklist

Inclusions checklist
Exclusions checklist

16.3 Currency conversion rates for US$

16.4 Research methodology

16.5 Data procurement

Information sources

16.6 Data validation

16.7 Validation techniques employed for market sizing

16.8 Data synthesis

16.9 360 degree market analysis

16.10 List of abbreviations

Research Methodology

Technavio presents a detailed picture of the market by way of study, synthesis, and summation of data from multiple sources. The analysts have presented the various facets of the market with a particular focus on identifying the key industry influencers. The data thus presented is comprehensive, reliable, and the result of extensive research, both primary and secondary.

INFORMATION SOURCES

Primary sources

  • Manufacturers and suppliers
  • Channel partners
  • Industry experts
  • Strategic decision makers

Secondary sources

  • Industry journals and periodicals
  • Government data
  • Financial reports of key industry players
  • Historical data
  • Press releases

DATA ANALYSIS

Data Synthesis

  • Collation of data
  • Estimation of key figures
  • Analysis of derived insights

Data Validation

  • Triangulation with data models
  • Reference against proprietary databases
  • Corroboration with industry experts

REPORT WRITING

Qualitative

  • Market drivers
  • Market challenges
  • Market trends
  • Five forces analysis

Quantitative

  • Market size and forecast
  • Market segmentation
  • Geographical insights
  • Competitive landscape

Interested in this report?

Get your sample now to see our research methodology and insights!

Download Now

Frequently Asked Questions

Residential Solar Energy Storage market growth will increase by USD 46180.1 million during 2026-2030.

The Residential Solar Energy Storage market is expected to grow at a CAGR of 19.7% during 2026-2030.

Residential Solar Energy Storage market is segmented by Technology (Li-ion batteries, Lead acid batteries) Connectivity (On-grid, Off-grid) Ownership (Customer-owned, Third-party owned, Utility-owned)

Alpha ESS Co. Ltd., Bluetti Power Inc., BYD Co. Ltd., Dyness Digital Energy Co. Ltd., Enphase Energy Inc., Generac Power Systems Inc., GoodWe Technologies Co. Ltd., Hitachi Energy Ltd., Huawei Technologies Co. Ltd., LG Energy Solution Ltd., Panasonic Holdings Corp., Redback Operation Pty Ltd., SolarEdge Technologies Inc., sonnen GmbH, Tesla Inc., Tigo Energy Inc., VARTA AG are a few of the key vendors in the Residential Solar Energy Storage market.

APAC will register the highest growth rate of 51.7% among the other regions. Therefore, the Residential Solar Energy Storage market in APAC is expected to garner significant business opportunities for the vendors during the forecast period.

China, India, Australia, Japan, South Korea, Indonesia, US, Canada, Mexico, Germany, UK, France, Italy, Spain, The Netherlands, Brazil, Argentina, Chile, South Africa, UAE, Saudi Arabia, Turkey, Israel

  • Reduction in PV and energy storage system costs is the driving factor this market.

The Residential Solar Energy Storage market vendors should focus on grabbing business opportunities from the Technology segment as it accounted for the largest market share in the base year.
RIA - Research AI Assistant
Ask RIA