Refrigerated Cabinet Market Analysis, Size, and Forecast 2026-2030: APAC (China, Japan, and South Korea), Europe (Germany, UK, and France), North America (US, Canada, and Mexico), South America (Brazil, Argentina, and Colombia), Middle East and Africa (Saudi Arabia, South Africa, and UAE), and Rest of World (ROW)

Refrigerated Cabinet Market Analysis, Size, and Forecast 2026-2030:
APAC (China, Japan, and South Korea), Europe (Germany, UK, and France), North America (US, Canada, and Mexico), South America (Brazil, Argentina, and Colombia), Middle East and Africa (Saudi Arabia, South Africa, and UAE), and Rest of World (ROW)

Published: Dec 2025 304 Pages SKU: IRTNTR44074

Market Overview at a Glance

$7.17 B
Market Opportunity
3.4%
CAGR 2025 - 2030
41%
APAC Growth
$31.95 B
Storage cabinet segment 2024

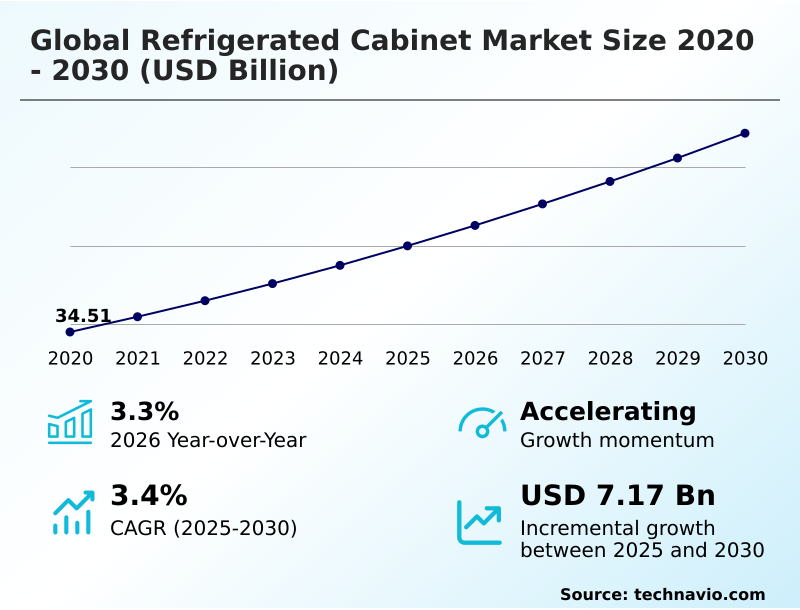
Refrigerated Cabinet Market Size 2026-2030

The refrigerated cabinet market size is valued to increase by USD 7.17 billion, at a CAGR of 3.4% from 2025 to 2030. Rising demand from food and beverage industry will drive the refrigerated cabinet market.

Major Market Trends & Insights

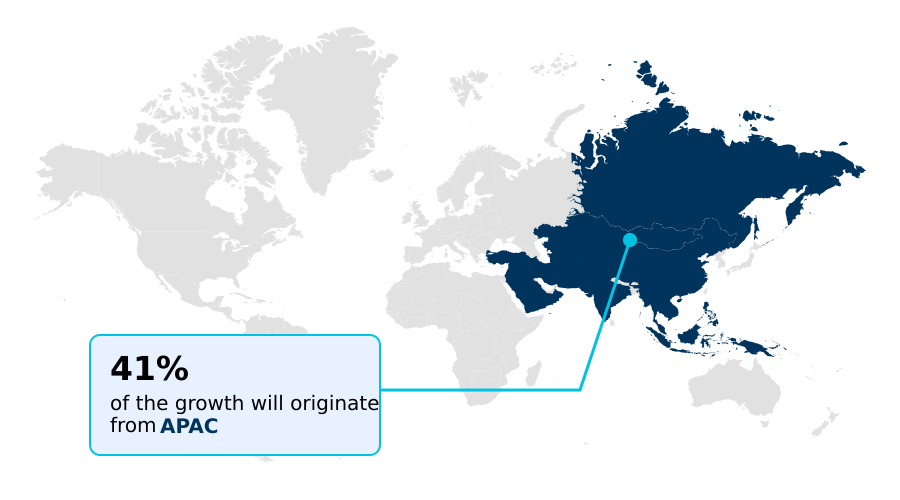
  • APAC dominated the market and accounted for a 41% growth during the forecast period.
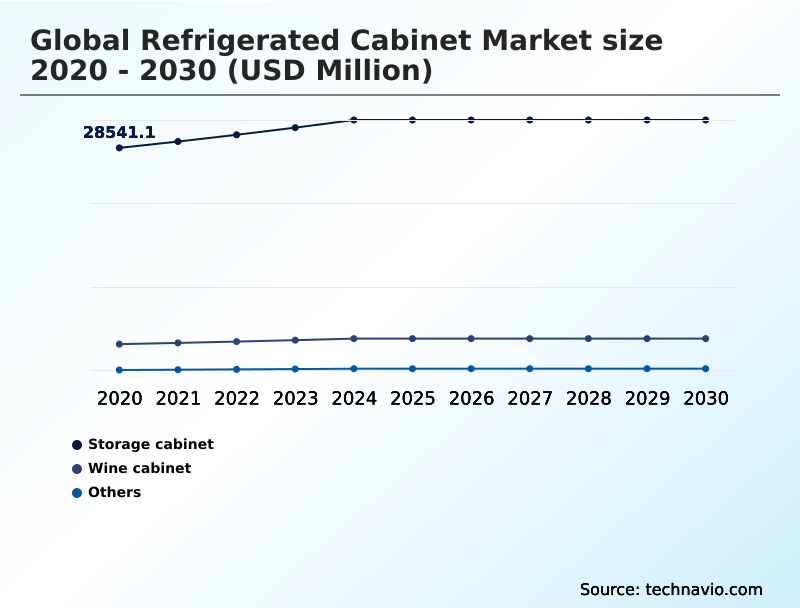
  • By Product - Storage cabinet segment was valued at USD 31.95 billion in 2024
  • By End-user - Retail and e-commerce segment accounted for the largest market revenue share in 2024

Market Size & Forecast

  • Market Opportunities: USD 12.64 billion
  • Market Future Opportunities: USD 7.17 billion
  • CAGR from 2025 to 2030 : 3.4%

Market Summary

  • The refrigerated cabinet market is undergoing a significant transformation, driven by stringent energy efficiency regulations and a growing demand for sustainable operations. The industry is moving away from traditional hydrofluorocarbon (HFC) refrigerants toward natural alternatives like CO2 and propane, a shift that presents both opportunities and challenges.
  • While these eco-friendly options reduce environmental impact, their adoption necessitates higher upfront investment in compatible equipment and specialized technician training. A key area of innovation is the integration of IoT and smart technologies. For instance, a large supermarket chain can deploy a network of connected refrigerated display cases that provide real-time temperature data and predictive maintenance alerts.
  • This capability allows facility managers to prevent equipment failures, reduce food spoilage, and optimize energy consumption across hundreds of stores from a central dashboard. This convergence of hardware and data analytics is redefining operational efficiency.
  • However, the initial cost of these advanced systems and the complexity of regulatory compliance remain significant hurdles, particularly for small and medium-sized businesses trying to modernize their cold chain infrastructure while managing tight budgets. The market's trajectory will be defined by how effectively manufacturers can balance performance, cost, and sustainability.

What will be the Size of the Refrigerated Cabinet Market during the forecast period?

Get Key Insights on Market Forecast (PDF) Request Free Sample

How is the Refrigerated Cabinet Market Segmented?

The refrigerated cabinet industry research report provides comprehensive data (region-wise segment analysis), with forecasts and estimates in "USD million" for the period 2026-2030, as well as historical data from 2020-2024 for the following segments.

  • Product
    • Storage cabinet
    • Wine cabinet
    • Others
  • End-user
    • Retail and e-commerce
    • Food and beverage industry
    • Pharmaceutical and life sciences sector
    • Others
  • Technology
    • Conventional refrigeration systems
    • Natural refrigerant-based systems
    • Smart and connected refrigeration systems
    • Hybrid and modular systems
  • Geography
    • APAC
      • China
      • Japan
      • South Korea
    • Europe
      • Germany
      • UK
      • France
    • North America
      • US
      • Canada
      • Mexico
    • South America
      • Brazil
      • Argentina
      • Colombia
    • Middle East and Africa
      • Saudi Arabia
      • South Africa
      • UAE
    • Rest of World (ROW)

By Product Insights

The storage cabinet segment is estimated to witness significant growth during the forecast period.

The refrigerated cabinet market is segmented by product, end-user, technology, and geography, reflecting its diverse applications. The storage cabinet segment is foundational, driven by the need for robust commercial refrigeration solutions in back-of-house operations across retail and foodservice.

These units prioritize capacity and consistent temperature control, employing technologies like the vapor-compression cycle and advanced vacuum insulation panels to ensure performance.

Innovations focus on enhancing energy efficiency, with some inverter technology compressor models achieving up to 15% reduction in energy use.

As the cold chain infrastructure expands, demand for specialized units using transcritical co2 systems and hydrocarbon refrigerants is growing, especially in sectors requiring stringent pharmaceutical storage refrigeration and energy-efficient display cases for perishable goods.

Request Free Sample

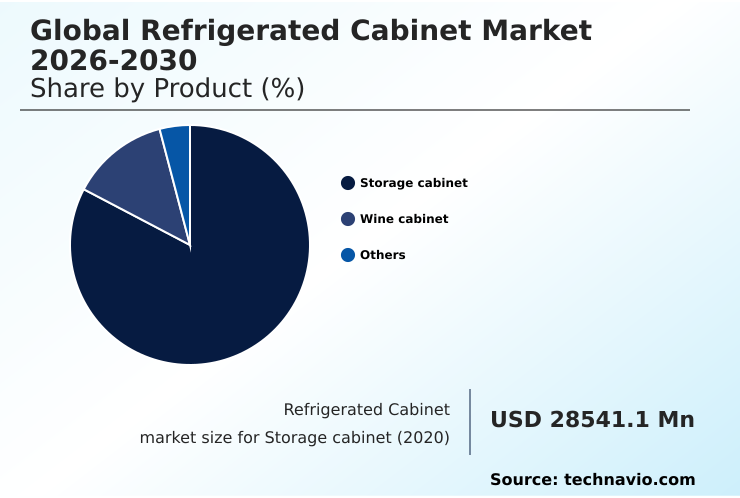
The Storage cabinet segment was valued at USD 31.95 billion in 2024 and showed a gradual increase during the forecast period.

Request Free Sample

Regional Analysis

APAC is estimated to contribute 41% to the growth of the global market during the forecast period.Technavio’s analysts have elaborately explained the regional trends and drivers that shape the market during the forecast period.

See How Refrigerated Cabinet Market Demand is Rising in APAC Request Free Sample

The geographic landscape of the refrigerated cabinet market is diverse, with APAC poised to contribute over 40% of incremental growth, driven by expanding retail infrastructure in countries like China and India.

In this region, the demand for modular cold rooms, blast chillers, and shock freezers is escalating to support the burgeoning food service refrigeration equipment sector.

Meanwhile, established markets in Europe and North America focus on technological upgrades, particularly in supermarket refrigeration systems and retail refrigeration displays.

Adoption of smart defrost systems in these regions has led to an 18% improvement in energy efficiency for some retailers.

The specialized segment for ultra-low temperature freezers also sees consistent demand from the pharmaceutical and life sciences industries globally, where maintaining precise temperature integrity is paramount.

These regional dynamics highlight a market that is both expanding and maturing, with growth fueled by new construction and modernization alike.

Market Dynamics

Our researchers analyzed the data with 2025 as the base year, along with the key drivers, trends, and challenges. A holistic analysis of drivers will help companies refine their marketing strategies to gain a competitive advantage.

  • Strategic decision-making in the global refrigerated cabinet market 2026-2030 is increasingly influenced by long-term operational efficiency and regulatory foresight. The trend toward refrigerated cabinet natural refrigerant adoption is no longer a niche consideration but a central pillar of capital expenditure planning, driven by the ongoing challenges in hfc refrigerant phase-down.
  • Businesses evaluating the benefits of variable speed compressors are finding that while initial costs are higher, the long-term energy savings create a compelling ROI. Similarly, investment in iot connectivity in commercial refrigerators is becoming a competitive differentiator. For instance, facilities with connected systems resolve maintenance tickets nearly twice as fast as those with traditional units.
  • The impact of ecodesign directive on cabinets has forced manufacturers to innovate, leading to better insulation and more efficient designs. End-users, especially in retail, are analyzing the total cost of ownership, from the energy consumption of refrigerated cabinets to the maintenance of transcritical co2 systems.
  • The selection of blast chillers for food safety compliance and the cost of installing modular cold rooms are now critical components of operational budgeting. Consequently, upgrading to energy efficient refrigeration is viewed not just as a cost but as a strategic investment in sustainability and resilience, with temperature control in pharmaceutical refrigerators remaining a non-negotiable standard of quality.

What are the key market drivers leading to the rise in the adoption of Refrigerated Cabinet Industry?

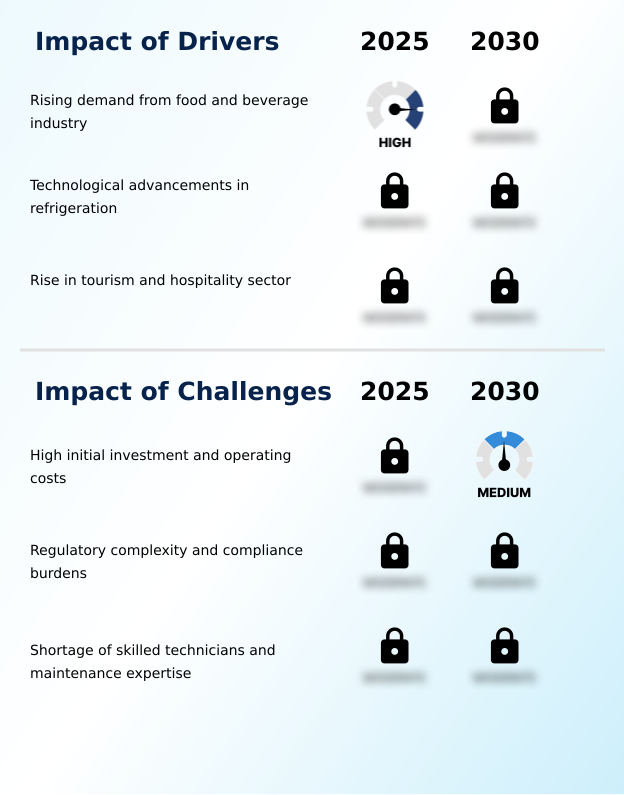
  • The rising demand from the food and beverage industry is a primary driver for the global refrigerated cabinet market.

  • The expansion of the refrigerated cabinet market is primarily driven by technological advancements and stringent regulatory frameworks. The mandatory hfc refrigerant phasedown is compelling investment in new cold storage technology, with a focus on refrigerant compliance management.
  • Innovations such as advanced polyurethane foams enhance insulation, improving thermal efficiency by up to 10% in some models. Furthermore, the integration of remote temperature monitoring and iot-enabled temperature monitoring is becoming essential for ecodesign directive compliance.
  • These smart systems provide real-time data, crucial for sectors like professional kitchen equipment and beverage cooling systems, where temperature integrity is non-negotiable.
  • This convergence of regulatory push and technological pull is creating a more efficient, compliant, and intelligent generation of refrigeration solutions.

What are the market trends shaping the Refrigerated Cabinet Industry?

  • The increasing adoption of natural refrigerants is a significant and transformative trend. This shift is reshaping the global refrigerated cabinet market towards more sustainable solutions.

  • The global refrigerated cabinet market 2026-2030 is increasingly shaped by the push for sustainability and operational intelligence. The adoption of natural refrigerant systems is accelerating, with models using low-gwp refrigerants like r290 propane refrigerant and r600a isobutane refrigerant becoming standard for smaller refrigerated merchandisers. This shift toward sustainable cooling solutions can reduce a unit's carbon footprint by over 95%.
  • Concurrently, the integration of variable speed compressors enhances refrigeration energy management, with some advanced units demonstrating a 15% reduction in electricity consumption compared to fixed-speed models. This focus on efficiency and eco-friendliness is redefining food preservation technology, aligning equipment performance with both regulatory pressures and corporate sustainability goals, making it a critical trend for all end-users.

What challenges does the Refrigerated Cabinet Industry face during its growth?

  • High initial investment and operating costs pose a significant challenge to the growth of the global refrigerated cabinet market.

  • Key challenges in the refrigerated cabinet market stem from high initial costs and the operational complexity of modern systems. The capital outlay for energy-efficient refrigerated display cases and specialized commercial kitchen refrigeration, such as upright reach-in refrigerators and undercounter refrigeration units, can be prohibitive for smaller businesses.
  • Furthermore, the specialized nature of refrigerated logistics solutions and medical-grade refrigeration demands significant investment in training and infrastructure. Systems offering predictive maintenance alerts, while reducing long-term costs, add to the initial purchase price.
  • For instance, deploying advanced refrigerated transport units for laboratory sample storage can increase fleet acquisition costs by up to 25%, creating a significant barrier to entry and slowing widespread adoption despite clear efficiency benefits.

Exclusive Technavio Analysis on Customer Landscape

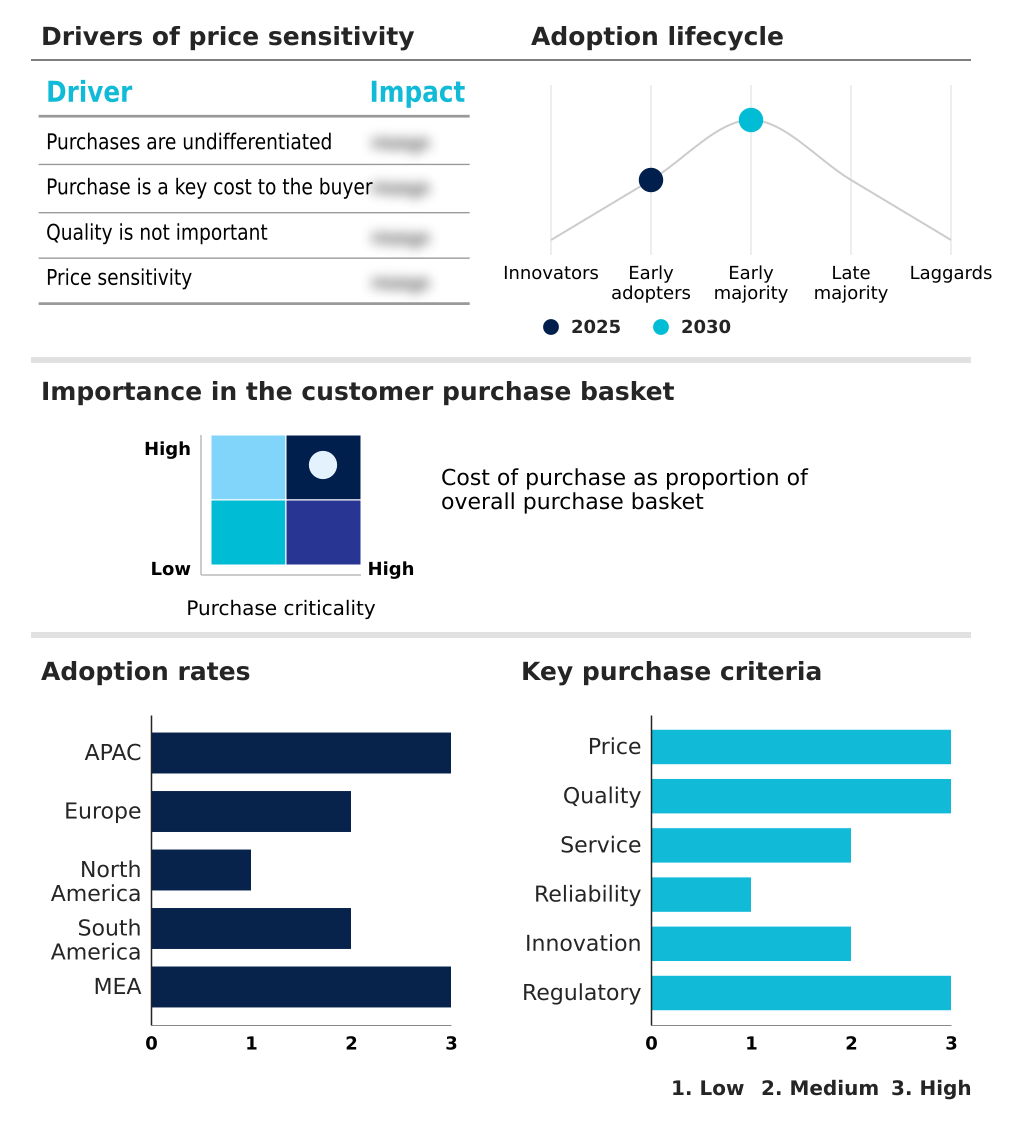
The refrigerated cabinet market forecasting report includes the adoption lifecycle of the market, covering from the innovator’s stage to the laggard’s stage. It focuses on adoption rates in different regions based on penetration. Furthermore, the refrigerated cabinet market report also includes key purchase criteria and drivers of price sensitivity to help companies evaluate and develop their market growth analysis strategies.

Customer Landscape of Refrigerated Cabinet Industry

Competitive Landscape

Companies are implementing various strategies, such as strategic alliances, refrigerated cabinet market forecast, partnerships, mergers and acquisitions, geographical expansion, and product/service launches, to enhance their presence in the industry.

AHT Cooling Systems GmbH - The vendor landscape features a mix of multinational corporations and specialized regional players, all competing on innovation, energy efficiency, and the adoption of sustainable technologies.

The industry research and growth report includes detailed analyses of the competitive landscape of the market and information about key companies, including:

  • AHT Cooling Systems GmbH
  • ARNEG SPA
  • Ceabis GmbH
  • Coldline S.r.l.
  • Dalucon Refrigeration Products
  • Epta Group
  • Foster Refrigerator
  • Frigoglass SAIC
  • Hengel Industrie
  • HOSHIZAKI Corp.
  • IRINOX Spa
  • ISA Spa
  • Liebherr International AG
  • Metalfrio Solutions S.A.
  • Procool
  • Suiling Group
  • True Manufacturing Co. Inc.
  • TURBO AIR Inc.
  • Ugur Cooling Systems
  • Vestfrost Solutions

Qualitative and quantitative analysis of companies has been conducted to help clients understand the wider business environment as well as the strengths and weaknesses of key industry players. Data is qualitatively analyzed to categorize companies as pure play, category-focused, industry-focused, and diversified; it is quantitatively analyzed to categorize companies as dominant, leading, strong, tentative, and weak.

Recent Development and News in Refrigerated cabinet market

  • In August, 2024, Liebherr International AG announced the launch of a new line of medical-grade ultra-low temperature freezers, featuring enhanced vacuum insulation and advanced connectivity for precise sample tracking in life sciences applications.
  • In November, 2024, Epta Group formed a strategic partnership with a leading European software company to integrate advanced AI-driven analytics into its commercial refrigeration systems, enabling predictive maintenance and energy optimization for retailers.
  • In January, 2025, True Manufacturing Co. Inc. completed its acquisition of a specialized Italian manufacturer of wine cabinets, a move designed to strengthen its product portfolio and expand its presence in the high-end hospitality market.
  • In April, 2025, HOSHIZAKI Corp. unveiled a new global initiative committing to a full transition to natural refrigerants across all its product lines by 2030, supported by a significant investment in R&D and technician training programs.

Dive into Technavio’s robust research methodology, blending expert interviews, extensive data synthesis, and validated models for unparalleled Refrigerated Cabinet Market insights. See full methodology.

Market Scope
Page number 304
Base year 2025
Historic period 2020-2024
Forecast period 2026-2030
Growth momentum & CAGR Accelerate at a CAGR of 3.4%
Market growth 2026-2030 USD 7165.2 million
Market structure Fragmented
YoY growth 2025-2026(%) 3.3%
Key countries China, Japan, South Korea, India, Australia, Indonesia, Germany, UK, France, Italy, Spain, The Netherlands, US, Canada, Mexico, Brazil, Argentina, Colombia, Saudi Arabia, South Africa, UAE, Egypt and Turkey
Competitive landscape Leading Companies, Market Positioning of Companies, Competitive Strategies, and Industry Risks

Request Free Sample

Research Analyst Overview

  • The refrigerated cabinet market is evolving beyond simple preservation, becoming a focal point of operational intelligence and sustainability. A key trend is the integration of iot-enabled temperature monitoring and advanced analytics, which allows for remote diagnostics and predictive maintenance alerts, significantly reducing product spoilage.
  • Boardroom decisions are now heavily influenced by the hfc refrigerant phasedown, compelling investment in natural refrigerant systems using r290 propane refrigerant or r600a isobutane refrigerant. Technologies like variable speed compressors and vacuum insulation panels are critical for achieving ecodesign directive compliance and lowering lifecycle costs. Innovations in advanced polyurethane foams and smart defrost systems are further enhancing thermal efficiency.
  • For food service, the deployment of blast chillers, shock freezers, and modular cold rooms is essential for safety and workflow optimization. The market also sees sustained demand for specialized commercial kitchen refrigeration, including upright reach-in refrigerators and undercounter refrigeration units.
  • Adoption of these advanced systems has enabled some operators to achieve a 20% reduction in energy waste, demonstrating a clear link between technological investment and bottom-line performance.

What are the Key Data Covered in this Refrigerated Cabinet Market Research and Growth Report?

  • What is the expected growth of the Refrigerated Cabinet Market between 2026 and 2030?

    • USD 7.17 billion, at a CAGR of 3.4%

  • What segmentation does the market report cover?

    • The report is segmented by Product (Storage cabinet, Wine cabinet, and Others), End-user (Retail and e-commerce, Food and beverage industry, Pharmaceutical and life sciences sector, and Others), Technology (Conventional refrigeration systems, Natural refrigerant-based systems, Smart and connected refrigeration systems, and Hybrid and modular systems) and Geography (APAC, Europe, North America, South America, Middle East and Africa)

  • Which regions are analyzed in the report?

    • APAC, Europe, North America, South America and Middle East and Africa

  • What are the key growth drivers and market challenges?

    • Rising demand from food and beverage industry, High initial investment and operating costs

  • Who are the major players in the Refrigerated Cabinet Market?

    • AHT Cooling Systems GmbH, ARNEG SPA, Ceabis GmbH, Coldline S.r.l., Dalucon Refrigeration Products, Epta Group, Foster Refrigerator, Frigoglass SAIC, Hengel Industrie, HOSHIZAKI Corp., IRINOX Spa, ISA Spa, Liebherr International AG, Metalfrio Solutions S.A., Procool, Suiling Group, True Manufacturing Co. Inc., TURBO AIR Inc., Ugur Cooling Systems and Vestfrost Solutions

Market Research Insights

  • The refrigerated cabinet market is defined by a dynamic interplay of technological innovation and evolving end-user demands. The integration of smart refrigeration monitoring is becoming standard, with some systems demonstrating a 25% reduction in equipment downtime through early fault detection. This shift supports the broader expansion of cold chain infrastructure needed for food service refrigeration equipment and retail displays.
  • Demand for specialized professional kitchen equipment and beverage cooling systems continues to grow, driving innovation in both performance and design. Moreover, the adoption of sustainable cooling solutions is accelerating, as new models show energy consumption reductions of up to 20% compared to older units.
  • This efficiency is critical for businesses looking to lower operational costs and meet stricter environmental regulations, reinforcing the market's move toward more intelligent and eco-conscious commercial refrigeration solutions.

We can help! Our analysts can customize this refrigerated cabinet market research report to meet your requirements.

Get in touch

1. Executive Summary

1.1 Market overview

Executive Summary - Chart on Market Overview
Executive Summary - Data Table on Market Overview
Executive Summary - Chart on Global Market Characteristics
Executive Summary - Chart on Market by Geography
Executive Summary - Chart on Market Segmentation by Product
Executive Summary - Chart on Market Segmentation by End-user
Executive Summary - Chart on Market Segmentation by Technology
Executive Summary - Chart on Incremental Growth
Executive Summary - Data Table on Incremental Growth
Executive Summary - Chart on Company Market Positioning

2. Technavio Analysis

2.1 Analysis of price sensitivity, lifecycle, customer purchase basket, adoption rates, and purchase criteria

2.2 Criticality of inputs and Factors of differentiation

Chart on Overview on criticality of inputs and factors of differentiation

2.3 Factors of disruption

Chart on Overview on factors of disruption

2.4 Impact of drivers and challenges

Chart on Impact of drivers and challenges in 2025 and 2030

3. Market Landscape

3.1 Market ecosystem

Chart on Parent Market
Data Table on - Parent Market

3.2 Market characteristics

Chart on Market characteristics analysis

3.3 Value chain analysis

Chart on Value chain analysis

4. Market Sizing

4.1 Market definition

Data Table on Offerings of companies included in the market definition

4.2 Market segment analysis

Market segments

4.3 Market size 2025

4.4 Market outlook: Forecast for 2025-2030

Chart on Global - Market size and forecast 2025-2030 ($ million)
Data Table on Global - Market size and forecast 2025-2030 ($ million)
Chart on Global Market: Year-over-year growth 2025-2030 (%)
Data Table on Global Market: Year-over-year growth 2025-2030 (%)

5. Historic Market Size

5.1 Global Refrigerated Cabinet Market 2020 - 2024

Historic Market Size - Data Table on Global Refrigerated Cabinet Market 2020 - 2024 ($ million)

5.2 Product segment analysis 2020 - 2024

Historic Market Size - Product Segment 2020 - 2024 ($ million)

5.3 End-user segment analysis 2020 - 2024

Historic Market Size - End-user Segment 2020 - 2024 ($ million)

5.4 Technology segment analysis 2020 - 2024

Historic Market Size - Technology Segment 2020 - 2024 ($ million)

5.5 Geography segment analysis 2020 - 2024

Historic Market Size - Geography Segment 2020 - 2024 ($ million)

5.6 Country segment analysis 2020 - 2024

Historic Market Size - Country Segment 2020 - 2024 ($ million)

6. Qualitative Analysis

6.1 Impact of AI on global refrigerated cabinet market

7. Five Forces Analysis

7.1 Five forces summary

Five forces analysis - Comparison between 2025 and 2030

7.2 Bargaining power of buyers

Bargaining power of buyers - Impact of key factors 2025 and 2030

7.3 Bargaining power of suppliers

Bargaining power of suppliers - Impact of key factors in 2025 and 2030

7.4 Threat of new entrants

Threat of new entrants - Impact of key factors in 2025 and 2030

7.5 Threat of substitutes

Threat of substitutes - Impact of key factors in 2025 and 2030

7.6 Threat of rivalry

Threat of rivalry - Impact of key factors in 2025 and 2030

7.7 Market condition

Chart on Market condition - Five forces 2025 and 2030

8. Market Segmentation by Product

8.1 Market segments

Chart on Product - Market share 2025-2030 (%)
Data Table on Product - Market share 2025-2030 (%)

8.2 Comparison by Product

Chart on Comparison by Product
Data Table on Comparison by Product

8.3 Storage cabinet - Market size and forecast 2025-2030

Chart on Storage cabinet - Market size and forecast 2025-2030 ($ million)
Data Table on Storage cabinet - Market size and forecast 2025-2030 ($ million)
Chart on Storage cabinet - Year-over-year growth 2025-2030 (%)
Data Table on Storage cabinet - Year-over-year growth 2025-2030 (%)

8.4 Wine cabinet - Market size and forecast 2025-2030

Chart on Wine cabinet - Market size and forecast 2025-2030 ($ million)
Data Table on Wine cabinet - Market size and forecast 2025-2030 ($ million)
Chart on Wine cabinet - Year-over-year growth 2025-2030 (%)
Data Table on Wine cabinet - Year-over-year growth 2025-2030 (%)

8.5 Others - Market size and forecast 2025-2030

Chart on Others - Market size and forecast 2025-2030 ($ million)
Data Table on Others - Market size and forecast 2025-2030 ($ million)
Chart on Others - Year-over-year growth 2025-2030 (%)
Data Table on Others - Year-over-year growth 2025-2030 (%)

8.6 Market opportunity by Product

Market opportunity by Product ($ million)
Data Table on Market opportunity by Product ($ million)

9. Market Segmentation by End-user

9.1 Market segments

Chart on End-user - Market share 2025-2030 (%)
Data Table on End-user - Market share 2025-2030 (%)

9.2 Comparison by End-user

Chart on Comparison by End-user
Data Table on Comparison by End-user

9.3 Retail and e-commerce - Market size and forecast 2025-2030

Chart on Retail and e-commerce - Market size and forecast 2025-2030 ($ million)
Data Table on Retail and e-commerce - Market size and forecast 2025-2030 ($ million)
Chart on Retail and e-commerce - Year-over-year growth 2025-2030 (%)
Data Table on Retail and e-commerce - Year-over-year growth 2025-2030 (%)

9.4 Food and beverage industry - Market size and forecast 2025-2030

Chart on Food and beverage industry - Market size and forecast 2025-2030 ($ million)
Data Table on Food and beverage industry - Market size and forecast 2025-2030 ($ million)
Chart on Food and beverage industry - Year-over-year growth 2025-2030 (%)
Data Table on Food and beverage industry - Year-over-year growth 2025-2030 (%)

9.5 Pharmaceutical and life sciences sector - Market size and forecast 2025-2030

Chart on Pharmaceutical and life sciences sector - Market size and forecast 2025-2030 ($ million)
Data Table on Pharmaceutical and life sciences sector - Market size and forecast 2025-2030 ($ million)
Chart on Pharmaceutical and life sciences sector - Year-over-year growth 2025-2030 (%)
Data Table on Pharmaceutical and life sciences sector - Year-over-year growth 2025-2030 (%)

9.6 Others - Market size and forecast 2025-2030

Chart on Others - Market size and forecast 2025-2030 ($ million)
Data Table on Others - Market size and forecast 2025-2030 ($ million)
Chart on Others - Year-over-year growth 2025-2030 (%)
Data Table on Others - Year-over-year growth 2025-2030 (%)

9.7 Market opportunity by End-user

Market opportunity by End-user ($ million)
Data Table on Market opportunity by End-user ($ million)

10. Market Segmentation by Technology

10.1 Market segments

Chart on Technology - Market share 2025-2030 (%)
Data Table on Technology - Market share 2025-2030 (%)

10.2 Comparison by Technology

Chart on Comparison by Technology
Data Table on Comparison by Technology

10.3 Conventional refrigeration systems - Market size and forecast 2025-2030

Chart on Conventional refrigeration systems - Market size and forecast 2025-2030 ($ million)
Data Table on Conventional refrigeration systems - Market size and forecast 2025-2030 ($ million)
Chart on Conventional refrigeration systems - Year-over-year growth 2025-2030 (%)
Data Table on Conventional refrigeration systems - Year-over-year growth 2025-2030 (%)

10.4 Natural refrigerant-based systems - Market size and forecast 2025-2030

Chart on Natural refrigerant-based systems - Market size and forecast 2025-2030 ($ million)
Data Table on Natural refrigerant-based systems - Market size and forecast 2025-2030 ($ million)
Chart on Natural refrigerant-based systems - Year-over-year growth 2025-2030 (%)
Data Table on Natural refrigerant-based systems - Year-over-year growth 2025-2030 (%)

10.5 Smart and connected refrigeration systems - Market size and forecast 2025-2030

Chart on Smart and connected refrigeration systems - Market size and forecast 2025-2030 ($ million)
Data Table on Smart and connected refrigeration systems - Market size and forecast 2025-2030 ($ million)
Chart on Smart and connected refrigeration systems - Year-over-year growth 2025-2030 (%)
Data Table on Smart and connected refrigeration systems - Year-over-year growth 2025-2030 (%)

10.6 Hybrid and modular systems - Market size and forecast 2025-2030

Chart on Hybrid and modular systems - Market size and forecast 2025-2030 ($ million)
Data Table on Hybrid and modular systems - Market size and forecast 2025-2030 ($ million)
Chart on Hybrid and modular systems - Year-over-year growth 2025-2030 (%)
Data Table on Hybrid and modular systems - Year-over-year growth 2025-2030 (%)

10.7 Market opportunity by Technology

Market opportunity by Technology ($ million)
Data Table on Market opportunity by Technology ($ million)

11. Customer Landscape

11.1 Customer landscape overview

Analysis of price sensitivity, lifecycle, customer purchase basket, adoption rates, and purchase criteria

12. Geographic Landscape

12.1 Geographic segmentation

Chart on Market share by geography 2025-2030 (%)
Data Table on Market share by geography 2025-2030 (%)

12.2 Geographic comparison

Chart on Geographic comparison
Data Table on Geographic comparison

12.3 APAC - Market size and forecast 2025-2030

Chart on APAC - Market size and forecast 2025-2030 ($ million)
Data Table on APAC - Market size and forecast 2025-2030 ($ million)
Chart on APAC - Year-over-year growth 2025-2030 (%)
Data Table on APAC - Year-over-year growth 2025-2030 (%)
Chart on Regional Comparison - APAC
Data Table on Regional Comparison - APAC

12.3.1 China - Market size and forecast 2025-2030

Chart on China - Market size and forecast 2025-2030 ($ million)
Data Table on China - Market size and forecast 2025-2030 ($ million)
Chart on China - Year-over-year growth 2025-2030 (%)
Data Table on China - Year-over-year growth 2025-2030 (%)

12.3.2 Japan - Market size and forecast 2025-2030

Chart on Japan - Market size and forecast 2025-2030 ($ million)
Data Table on Japan - Market size and forecast 2025-2030 ($ million)
Chart on Japan - Year-over-year growth 2025-2030 (%)
Data Table on Japan - Year-over-year growth 2025-2030 (%)

12.3.3 South Korea - Market size and forecast 2025-2030

Chart on South Korea - Market size and forecast 2025-2030 ($ million)
Data Table on South Korea - Market size and forecast 2025-2030 ($ million)
Chart on South Korea - Year-over-year growth 2025-2030 (%)
Data Table on South Korea - Year-over-year growth 2025-2030 (%)

12.3.4 India - Market size and forecast 2025-2030

Chart on India - Market size and forecast 2025-2030 ($ million)
Data Table on India - Market size and forecast 2025-2030 ($ million)
Chart on India - Year-over-year growth 2025-2030 (%)
Data Table on India - Year-over-year growth 2025-2030 (%)

12.3.5 Australia - Market size and forecast 2025-2030

Chart on Australia - Market size and forecast 2025-2030 ($ million)
Data Table on Australia - Market size and forecast 2025-2030 ($ million)
Chart on Australia - Year-over-year growth 2025-2030 (%)
Data Table on Australia - Year-over-year growth 2025-2030 (%)

12.3.6 Indonesia - Market size and forecast 2025-2030

Chart on Indonesia - Market size and forecast 2025-2030 ($ million)
Data Table on Indonesia - Market size and forecast 2025-2030 ($ million)
Chart on Indonesia - Year-over-year growth 2025-2030 (%)
Data Table on Indonesia - Year-over-year growth 2025-2030 (%)

12.4 Europe - Market size and forecast 2025-2030

Chart on Europe - Market size and forecast 2025-2030 ($ million)
Data Table on Europe - Market size and forecast 2025-2030 ($ million)
Chart on Europe - Year-over-year growth 2025-2030 (%)
Data Table on Europe - Year-over-year growth 2025-2030 (%)
Chart on Regional Comparison - Europe
Data Table on Regional Comparison - Europe

12.4.1 Germany - Market size and forecast 2025-2030

Chart on Germany - Market size and forecast 2025-2030 ($ million)
Data Table on Germany - Market size and forecast 2025-2030 ($ million)
Chart on Germany - Year-over-year growth 2025-2030 (%)
Data Table on Germany - Year-over-year growth 2025-2030 (%)

12.4.2 UK - Market size and forecast 2025-2030

Chart on UK - Market size and forecast 2025-2030 ($ million)
Data Table on UK - Market size and forecast 2025-2030 ($ million)
Chart on UK - Year-over-year growth 2025-2030 (%)
Data Table on UK - Year-over-year growth 2025-2030 (%)

12.4.3 France - Market size and forecast 2025-2030

Chart on France - Market size and forecast 2025-2030 ($ million)
Data Table on France - Market size and forecast 2025-2030 ($ million)
Chart on France - Year-over-year growth 2025-2030 (%)
Data Table on France - Year-over-year growth 2025-2030 (%)

12.4.4 Italy - Market size and forecast 2025-2030

Chart on Italy - Market size and forecast 2025-2030 ($ million)
Data Table on Italy - Market size and forecast 2025-2030 ($ million)
Chart on Italy - Year-over-year growth 2025-2030 (%)
Data Table on Italy - Year-over-year growth 2025-2030 (%)

12.4.5 Spain - Market size and forecast 2025-2030

Chart on Spain - Market size and forecast 2025-2030 ($ million)
Data Table on Spain - Market size and forecast 2025-2030 ($ million)
Chart on Spain - Year-over-year growth 2025-2030 (%)
Data Table on Spain - Year-over-year growth 2025-2030 (%)

12.4.6 The Netherlands - Market size and forecast 2025-2030

Chart on The Netherlands - Market size and forecast 2025-2030 ($ million)
Data Table on The Netherlands - Market size and forecast 2025-2030 ($ million)
Chart on The Netherlands - Year-over-year growth 2025-2030 (%)
Data Table on The Netherlands - Year-over-year growth 2025-2030 (%)

12.5 North America - Market size and forecast 2025-2030

Chart on North America - Market size and forecast 2025-2030 ($ million)
Data Table on North America - Market size and forecast 2025-2030 ($ million)
Chart on North America - Year-over-year growth 2025-2030 (%)
Data Table on North America - Year-over-year growth 2025-2030 (%)
Chart on Regional Comparison - North America
Data Table on Regional Comparison - North America

12.5.1 US - Market size and forecast 2025-2030

Chart on US - Market size and forecast 2025-2030 ($ million)
Data Table on US - Market size and forecast 2025-2030 ($ million)
Chart on US - Year-over-year growth 2025-2030 (%)
Data Table on US - Year-over-year growth 2025-2030 (%)

12.5.2 Canada - Market size and forecast 2025-2030

Chart on Canada - Market size and forecast 2025-2030 ($ million)
Data Table on Canada - Market size and forecast 2025-2030 ($ million)
Chart on Canada - Year-over-year growth 2025-2030 (%)
Data Table on Canada - Year-over-year growth 2025-2030 (%)

12.5.3 Mexico - Market size and forecast 2025-2030

Chart on Mexico - Market size and forecast 2025-2030 ($ million)
Data Table on Mexico - Market size and forecast 2025-2030 ($ million)
Chart on Mexico - Year-over-year growth 2025-2030 (%)
Data Table on Mexico - Year-over-year growth 2025-2030 (%)

12.6 South America - Market size and forecast 2025-2030

Chart on South America - Market size and forecast 2025-2030 ($ million)
Data Table on South America - Market size and forecast 2025-2030 ($ million)
Chart on South America - Year-over-year growth 2025-2030 (%)
Data Table on South America - Year-over-year growth 2025-2030 (%)
Chart on Regional Comparison - South America
Data Table on Regional Comparison - South America

12.6.1 Brazil - Market size and forecast 2025-2030

Chart on Brazil - Market size and forecast 2025-2030 ($ million)
Data Table on Brazil - Market size and forecast 2025-2030 ($ million)
Chart on Brazil - Year-over-year growth 2025-2030 (%)
Data Table on Brazil - Year-over-year growth 2025-2030 (%)

12.6.2 Argentina - Market size and forecast 2025-2030

Chart on Argentina - Market size and forecast 2025-2030 ($ million)
Data Table on Argentina - Market size and forecast 2025-2030 ($ million)
Chart on Argentina - Year-over-year growth 2025-2030 (%)
Data Table on Argentina - Year-over-year growth 2025-2030 (%)

12.6.3 Colombia - Market size and forecast 2025-2030

Chart on Colombia - Market size and forecast 2025-2030 ($ million)
Data Table on Colombia - Market size and forecast 2025-2030 ($ million)
Chart on Colombia - Year-over-year growth 2025-2030 (%)
Data Table on Colombia - Year-over-year growth 2025-2030 (%)

12.7 Middle East and Africa - Market size and forecast 2025-2030

Chart on Middle East and Africa - Market size and forecast 2025-2030 ($ million)
Data Table on Middle East and Africa - Market size and forecast 2025-2030 ($ million)
Chart on Middle East and Africa - Year-over-year growth 2025-2030 (%)
Data Table on Middle East and Africa - Year-over-year growth 2025-2030 (%)
Chart on Regional Comparison - Middle East and Africa
Data Table on Regional Comparison - Middle East and Africa

12.7.1 Saudi Arabia - Market size and forecast 2025-2030

Chart on Saudi Arabia - Market size and forecast 2025-2030 ($ million)
Data Table on Saudi Arabia - Market size and forecast 2025-2030 ($ million)
Chart on Saudi Arabia - Year-over-year growth 2025-2030 (%)
Data Table on Saudi Arabia - Year-over-year growth 2025-2030 (%)

12.7.2 South Africa - Market size and forecast 2025-2030

Chart on South Africa - Market size and forecast 2025-2030 ($ million)
Data Table on South Africa - Market size and forecast 2025-2030 ($ million)
Chart on South Africa - Year-over-year growth 2025-2030 (%)
Data Table on South Africa - Year-over-year growth 2025-2030 (%)

12.7.3 UAE - Market size and forecast 2025-2030

Chart on UAE - Market size and forecast 2025-2030 ($ million)
Data Table on UAE - Market size and forecast 2025-2030 ($ million)
Chart on UAE - Year-over-year growth 2025-2030 (%)
Data Table on UAE - Year-over-year growth 2025-2030 (%)

12.7.4 Egypt - Market size and forecast 2025-2030

Chart on Egypt - Market size and forecast 2025-2030 ($ million)
Data Table on Egypt - Market size and forecast 2025-2030 ($ million)
Chart on Egypt - Year-over-year growth 2025-2030 (%)
Data Table on Egypt - Year-over-year growth 2025-2030 (%)

12.7.5 Turkey - Market size and forecast 2025-2030

Chart on Turkey - Market size and forecast 2025-2030 ($ million)
Data Table on Turkey - Market size and forecast 2025-2030 ($ million)
Chart on Turkey - Year-over-year growth 2025-2030 (%)
Data Table on Turkey - Year-over-year growth 2025-2030 (%)

12.8 Market opportunity by geography

Market opportunity by geography ($ million)
Data Tables on Market opportunity by geography ($ million)

13. Drivers, Challenges, and Opportunity

13.1 Market drivers

Rising demand from food and beverage industry
Technological advancements in refrigeration
Rise in tourism and hospitality sector

13.2 Market challenges

High initial investment and operating costs
Regulatory complexity and compliance burdens
Shortage of skilled technicians and maintenance expertise

13.3 Impact of drivers and challenges

Impact of drivers and challenges in 2025 and 2030

13.4 Market opportunities

Increasing adoption of natural refrigerants
Integration of smart technologies and IoT connectivity
Emphasis on aesthetically pleasing and customizable designs

14. Competitive Landscape

14.1 Overview

14.2

Overview on criticality of inputs and factors of differentiation

14.3 Landscape disruption

Overview on factors of disruption

14.4 Industry risks

Impact of key risks on business

15. Competitive Analysis

15.1 Companies profiled

Companies covered

15.2 Company ranking index

15.3 Market positioning of companies

Matrix on companies position and classification

15.4 AHT Cooling Systems GmbH

AHT Cooling Systems GmbH - Overview
AHT Cooling Systems GmbH - Product / Service
AHT Cooling Systems GmbH - Key offerings
SWOT

15.5 ARNEG SPA

ARNEG SPA - Overview
ARNEG SPA - Product / Service
ARNEG SPA - Key offerings
SWOT

15.6 Coldline S.r.l.

Coldline S.r.l. - Overview
Coldline S.r.l. - Product / Service
Coldline S.r.l. - Key offerings
SWOT

15.7 Epta Group

Epta Group - Overview
Epta Group - Product / Service
Epta Group - Key offerings
SWOT

15.8 Foster Refrigerator

Foster Refrigerator - Overview
Foster Refrigerator - Product / Service
Foster Refrigerator - Key offerings
SWOT

15.9 Frigoglass SAIC

Frigoglass SAIC - Overview
Frigoglass SAIC - Product / Service
Frigoglass SAIC - Key offerings
SWOT

15.10 HOSHIZAKI Corp.

HOSHIZAKI Corp. - Overview
HOSHIZAKI Corp. - Business segments
HOSHIZAKI Corp. - Key offerings
HOSHIZAKI Corp. - Segment focus
SWOT

15.11 IRINOX Spa

IRINOX Spa - Overview
IRINOX Spa - Product / Service
IRINOX Spa - Key offerings
SWOT

15.12 ISA Spa

ISA Spa - Overview
ISA Spa - Product / Service
ISA Spa - Key offerings
SWOT

15.13 Liebherr International AG

Liebherr International AG - Overview
Liebherr International AG - Product / Service
Liebherr International AG - Key offerings
SWOT

15.14 Metalfrio Solutions S.A.

Metalfrio Solutions S.A. - Overview
Metalfrio Solutions S.A. - Product / Service
Metalfrio Solutions S.A. - Key offerings
SWOT

15.15 True Manufacturing Co. Inc.

True Manufacturing Co. Inc. - Overview
True Manufacturing Co. Inc. - Product / Service
True Manufacturing Co. Inc. - Key offerings
SWOT

15.16 TURBO AIR Inc.

TURBO AIR Inc. - Overview
TURBO AIR Inc. - Product / Service
TURBO AIR Inc. - Key offerings
SWOT

15.17 Ugur Cooling Systems

Ugur Cooling Systems - Overview
Ugur Cooling Systems - Product / Service
Ugur Cooling Systems - Key offerings
SWOT

15.18 Vestfrost Solutions

Vestfrost Solutions - Overview
Vestfrost Solutions - Product / Service
Vestfrost Solutions - Key offerings
SWOT

16. Appendix

16.1 Scope of the report

Market definition
Objectives
Notes and caveats

16.2 Inclusions and exclusions checklist

Inclusions checklist
Exclusions checklist

16.3 Currency conversion rates for US$

16.4 Research methodology

16.5 Data procurement

Information sources

16.6 Data validation

16.7 Validation techniques employed for market sizing

16.8 Data synthesis

16.9 360 degree market analysis

16.10 List of abbreviations

Research Methodology

Technavio presents a detailed picture of the market by way of study, synthesis, and summation of data from multiple sources. The analysts have presented the various facets of the market with a particular focus on identifying the key industry influencers. The data thus presented is comprehensive, reliable, and the result of extensive research, both primary and secondary.

INFORMATION SOURCES

Primary sources

  • Manufacturers and suppliers
  • Channel partners
  • Industry experts
  • Strategic decision makers

Secondary sources

  • Industry journals and periodicals
  • Government data
  • Financial reports of key industry players
  • Historical data
  • Press releases

DATA ANALYSIS

Data Synthesis

  • Collation of data
  • Estimation of key figures
  • Analysis of derived insights

Data Validation

  • Triangulation with data models
  • Reference against proprietary databases
  • Corroboration with industry experts

REPORT WRITING

Qualitative

  • Market drivers
  • Market challenges
  • Market trends
  • Five forces analysis

Quantitative

  • Market size and forecast
  • Market segmentation
  • Geographical insights
  • Competitive landscape

Interested in this report?

Get your sample now to see our research methodology and insights!

Download Now

Frequently Asked Questions

Refrigerated Cabinet market growth will increase by USD 7165.2 million during 2026-2030.

The Refrigerated Cabinet market is expected to grow at a CAGR of 3.4% during 2026-2030.

Refrigerated Cabinet market is segmented by Product (Storage cabinet, Wine cabinet, Others) End-user (Retail and e-commerce, Food and beverage industry, Pharmaceutical and life sciences sector, Others) Technology (Conventional refrigeration systems, Natural refrigerant-based systems, Smart and connected refrigeration systems, Hybrid and modular systems)

AHT Cooling Systems GmbH, ARNEG SPA, Ceabis GmbH, Coldline S.r.l., Dalucon Refrigeration Products, Epta Group, Foster Refrigerator, Frigoglass SAIC, Hengel Industrie, HOSHIZAKI Corp., IRINOX Spa, ISA Spa, Liebherr International AG, Metalfrio Solutions S.A., Procool, Suiling Group, True Manufacturing Co. Inc., TURBO AIR Inc., Ugur Cooling Systems, Vestfrost Solutions are a few of the key vendors in the Refrigerated Cabinet market.

APAC will register the highest growth rate of 41% among the other regions. Therefore, the Refrigerated Cabinet market in APAC is expected to garner significant business opportunities for the vendors during the forecast period.

China, Japan, South Korea, India, Australia, Indonesia, Germany, UK, France, Italy, Spain, The Netherlands, US, Canada, Mexico, Brazil, Argentina, Colombia, Saudi Arabia, South Africa, UAE, Egypt, Turkey

  • Rising demand from food and beverage industry is the driving factor this market.

The Refrigerated Cabinet market vendors should focus on grabbing business opportunities from the Product segment as it accounted for the largest market share in the base year.