RAID Controller Card Market Analysis, Size, and Forecast 2026-2030: APAC (China, India, and Japan), North America (US, Canada, and Mexico), Europe (Germany, UK, and France), Middle East and Africa (UAE, Saudi Arabia, and South Africa), South America (Brazil and Argentina), and Rest of World (ROW)

RAID Controller Card Market Analysis, Size, and Forecast 2026-2030:
APAC (China, India, and Japan), North America (US, Canada, and Mexico), Europe (Germany, UK, and France), Middle East and Africa (UAE, Saudi Arabia, and South Africa), South America (Brazil and Argentina), and Rest of World (ROW)

Published: Mar 2026 315 Pages SKU: IRTNTR43440

Market Overview at a Glance

$1.09 B
Market Opportunity
4.5%
CAGR 2025 - 2030
38.9%
APAC Growth
$2.61 B
Small enterprises segment 2024

RAID Controller Card Market Size 2026-2030

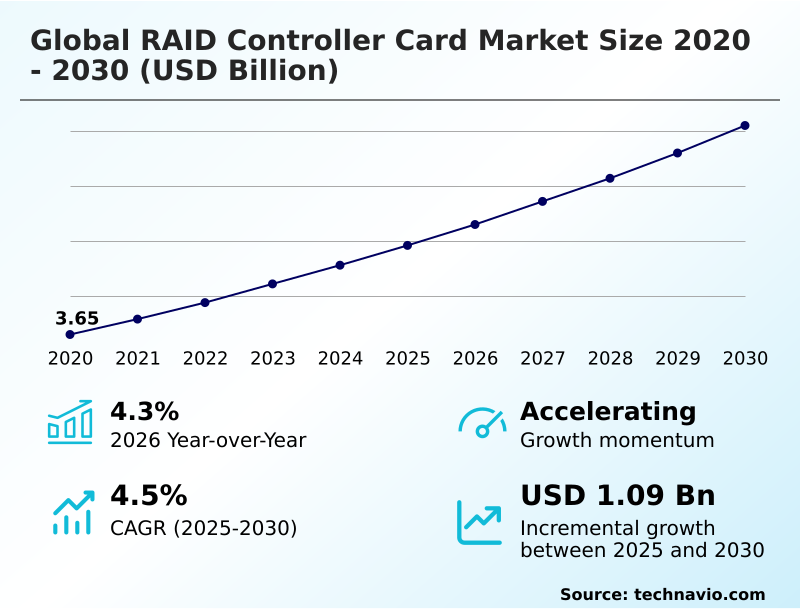
The raid controller card market size is valued to increase by USD 1.09 billion, at a CAGR of 4.5% from 2025 to 2030. Proliferation of NVMe storage will drive the raid controller card market.

Major Market Trends & Insights

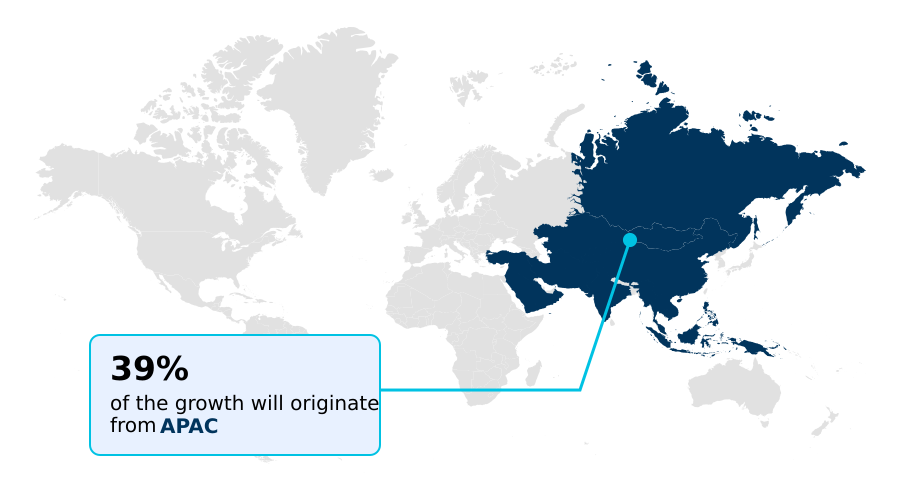
  • APAC dominated the market and accounted for a 38.9% growth during the forecast period.
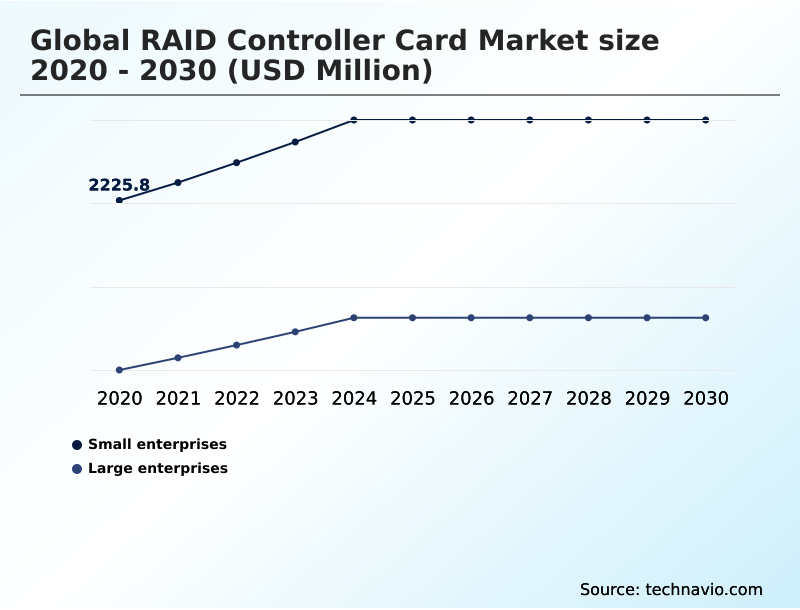
  • By End-user - Small enterprises segment was valued at USD 2.61 billion in 2024
  • By Product - Hardware RAID segment accounted for the largest market revenue share in 2024

Market Size & Forecast

  • Market Opportunities: USD 1.90 billion
  • Market Future Opportunities: USD 1.09 billion
  • CAGR from 2025 to 2030 : 4.5%

Market Summary

  • The RAID Controller Card Market is central to modern digital infrastructure, tasked with managing data integrity and performance as data volumes expand exponentially. The core function of a hardware RAID controller is to provide fault tolerance and accelerate storage, which remains critical even with the advent of high-speed NVMe drives.
  • A key dynamic is the transition toward architectures that can eliminate storage bottlenecks in data-intensive applications like AI and machine learning. For instance, a financial services firm running real-time fraud detection analytics relies on the low latency and high IOPS of an NVMe array, managed by a powerful controller, to process transactions without delay.
  • This scenario highlights the ongoing need for advanced hardware solutions. While software defined storage offers flexibility and scalability, dedicated controllers maintain an edge in mission-critical deployments where guaranteed performance and offloading RAID processing from the host CPU are paramount. The market's evolution is shaped by this balance between hardware-centric performance and software-defined agility.

What will be the Size of the RAID Controller Card Market during the forecast period?

Get Key Insights on Market Forecast (PDF) Request Free Sample

How is the RAID Controller Card Market Segmented?

The raid controller card industry research report provides comprehensive data (region-wise segment analysis), with forecasts and estimates in "USD million" for the period 2026-2030, as well as historical data from 2020-2024 for the following segments.

  • End-user
    • Small enterprises
    • Large enterprises
  • Product
    • Hardware RAID
    • Software RAID
  • Application
    • Data centers
    • Cloud computing
    • Enterprise storage
    • SMEs
    • Personal computers
  • Geography
    • APAC
      • China
      • India
      • Japan
    • North America
      • US
      • Canada
      • Mexico
    • Europe
      • Germany
      • UK
      • France
    • Middle East and Africa
      • UAE
      • Saudi Arabia
      • South Africa
    • South America
      • Brazil
      • Argentina
    • Rest of World (ROW)

By End-user Insights

The small enterprises segment is estimated to witness significant growth during the forecast period.

The small enterprises segment is driven by the need for dependable data protection and improved storage performance in cost-sensitive environments.

These businesses require fault tolerance to ensure business continuity, making hardware RAID controller adoption crucial for mitigating data loss from drive failures.

A typical setup involves a RAID 1 mirror for operating system data integrity and a RAID 6 configuration for application data.

For these organizations, a dedicated RAID-on-Chip processor is essential, as it handles all parity calculations without impacting the host server's CPU.

This approach offers a significant advantage over integrated solutions, improving operational efficiency by ensuring that primary business applications are not slowed down by storage I/O bottlenecks, with some firms reporting a 15% improvement in application responsiveness.

Request Free Sample

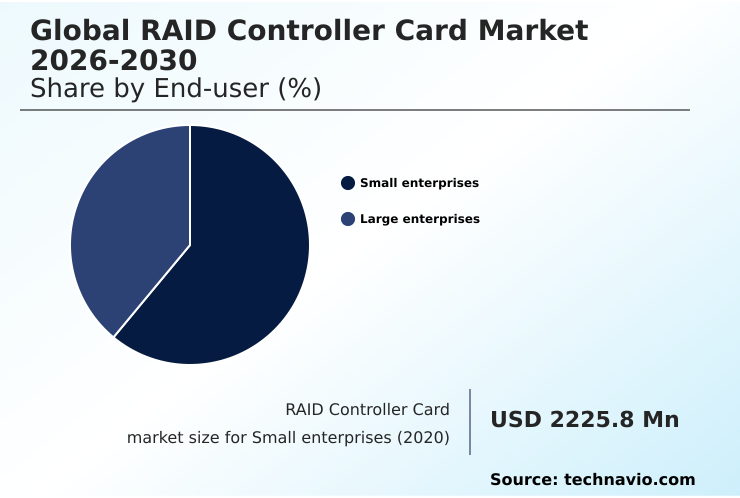
The Small enterprises segment was valued at USD 2.61 billion in 2024 and showed a gradual increase during the forecast period.

Request Free Sample

Regional Analysis

APAC is estimated to contribute 38.9% to the growth of the global market during the forecast period.Technavio’s analysts have elaborately explained the regional trends and drivers that shape the market during the forecast period.

See How RAID Controller Card Market Demand is Rising in APAC Request Free Sample

The geographic landscape is led by North America, which accounts for over 24% of the market opportunity, driven by its high concentration of hyperscale data centers requiring advanced storage virtualization and data management solutions.

APAC is the fastest-growing region, with a 5.9% growth rate, fueled by rapid digitalization and investment in new storage area networks and network attached storage.

In Europe, stringent regulations emphasize the need for robust data mirroring and data striping solutions for compliance.

Across all regions, the core need for storage performance acceleration and disaster recovery remains a constant, with direct attached storage configurations using techniques like parity generation and write-back caching with a battery backup unit being essential for RAID 0 striping and serial attached SCSI setups.

Market Dynamics

Our researchers analyzed the data with 2025 as the base year, along with the key drivers, trends, and challenges. A holistic analysis of drivers will help companies refine their marketing strategies to gain a competitive advantage.

  • The evolution of the global raid controller card market 2026-2030 is defined by a significant architectural pivot away from legacy storage interfaces toward next-generation technologies. The transition is not merely about speed but about building a more efficient and flexible storage ecosystem.
  • Tri-Mode controllers featuring robust SerDes technology have emerged as a critical bridge, allowing enterprises to manage existing SAS and SATA investments while progressively integrating high-performance NVMe drives. This future-proofs infrastructure and reduces total cost of ownership.
  • Concurrently, the industry is moving toward the widespread adoption of the PCIe 5.0 standard, a necessary step to prevent the interconnect from becoming a bottleneck for arrays of ultra-fast SSDs. This shift also sets the stage for the next major trend: computational storage.
  • By integrating processing capabilities directly onto the controller, these devices can offload tasks like compression and encryption, reducing host CPU load and data movement. For example, modern controllers can accelerate RAID rebuild times by more than 50% compared to previous generations, significantly minimizing the vulnerability window after a drive failure and enhancing overall data resilience.
  • This transforms the controller from a simple I/O device into an active participant in the compute infrastructure, creating new value for data-intensive workloads.

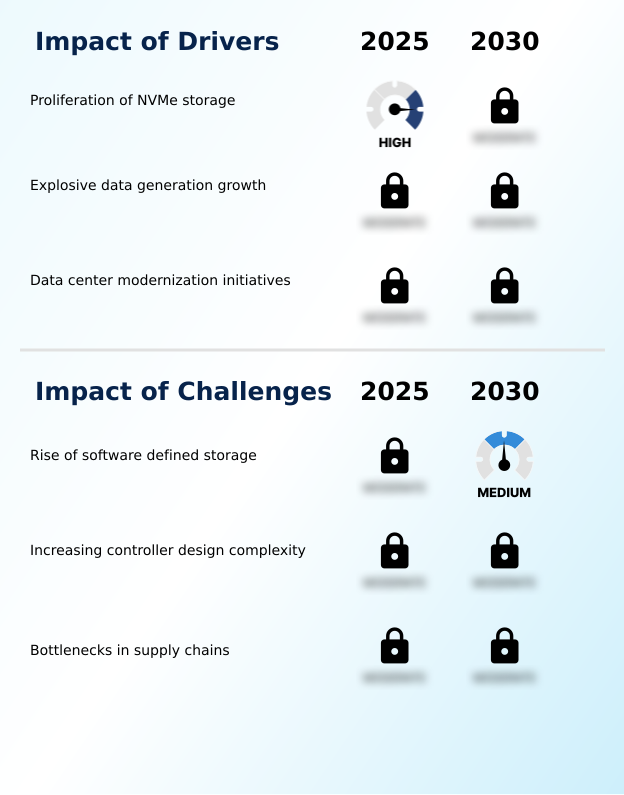
What are the key market drivers leading to the rise in the adoption of RAID Controller Card Industry?

  • The global RAID controller card market is being fundamentally driven by the rapid and widespread proliferation of NVMe-based solid-state storage, rooted in the demand for higher performance and lower latency.

  • Key market drivers center on data center modernization and the explosive growth in data generation, which mandate scalable enterprise storage solutions.
  • The proliferation of high-speed PCIe 4.0 NVMe SSD technology is compelling organizations to upgrade their storage array infrastructure to maximize I/O performance and achieve higher data availability.
  • Modern PCIe 5.0 RAID controllers are instrumental in this transition, providing the necessary throughput for mission-critical applications and supporting advanced architectures like NVMe over Fabrics.
  • The focus on performance is yielding tangible results, with deployments leveraging these technologies reporting over 2x improvement in input/output operations and a significant reduction in IOPS and latency, which is critical for high-performance computing.

What are the market trends shaping the RAID Controller Card Industry?

  • The widespread adoption of Tri-Mode SerDes technology in next-generation controllers represents a significant and transformative market trend. This evolution in storage interface flexibility unifies connectivity for SAS, SATA, and NVMe drives from a single port.

  • The market is rapidly evolving with the adoption of Tri-Mode SerDes technology, which unifies connectivity for SAS and SATA protocols and NVMe-based solid state storage within a single storage subsystem. This trend simplifies storage infrastructure and is foundational for creating a versatile tiered storage solution.
  • Simultaneously, the emergence of computational storage integration is shifting processing tasks closer to data, enhancing workload optimization. The standardization of the PCIe Gen 5.0 interface is another key development, doubling bandwidth to support data-intensive workloads and prevent bottlenecks, enabling some users to achieve a 40% reduction in data transfer times for real-time data analytics and improving overall system reliability.

What challenges does the RAID Controller Card Industry face during its growth?

  • The market faces a significant challenge from the rise of software-defined storage solutions, which represent a fundamental architectural shift in how storage is managed.

  • A primary challenge is the increasing adoption of software defined storage, which handles data redundancy through methods like erasure coding and replication across multiple nodes, often using a simple host bus adapter instead of a full-featured controller. This architectural shift can cap the market for advanced cards in certain hyperscale environments.
  • Concurrently, the increasing complexity of designing controllers with hot-swapping capability and data-at-rest encryption presents significant R&D hurdles. Supply chain volatility for components like universal flash storage and chips for advanced host controller interface creates further constraints, affecting system uptime and complicating efforts to ensure data loss prevention and data security without impacting cost structures negatively.

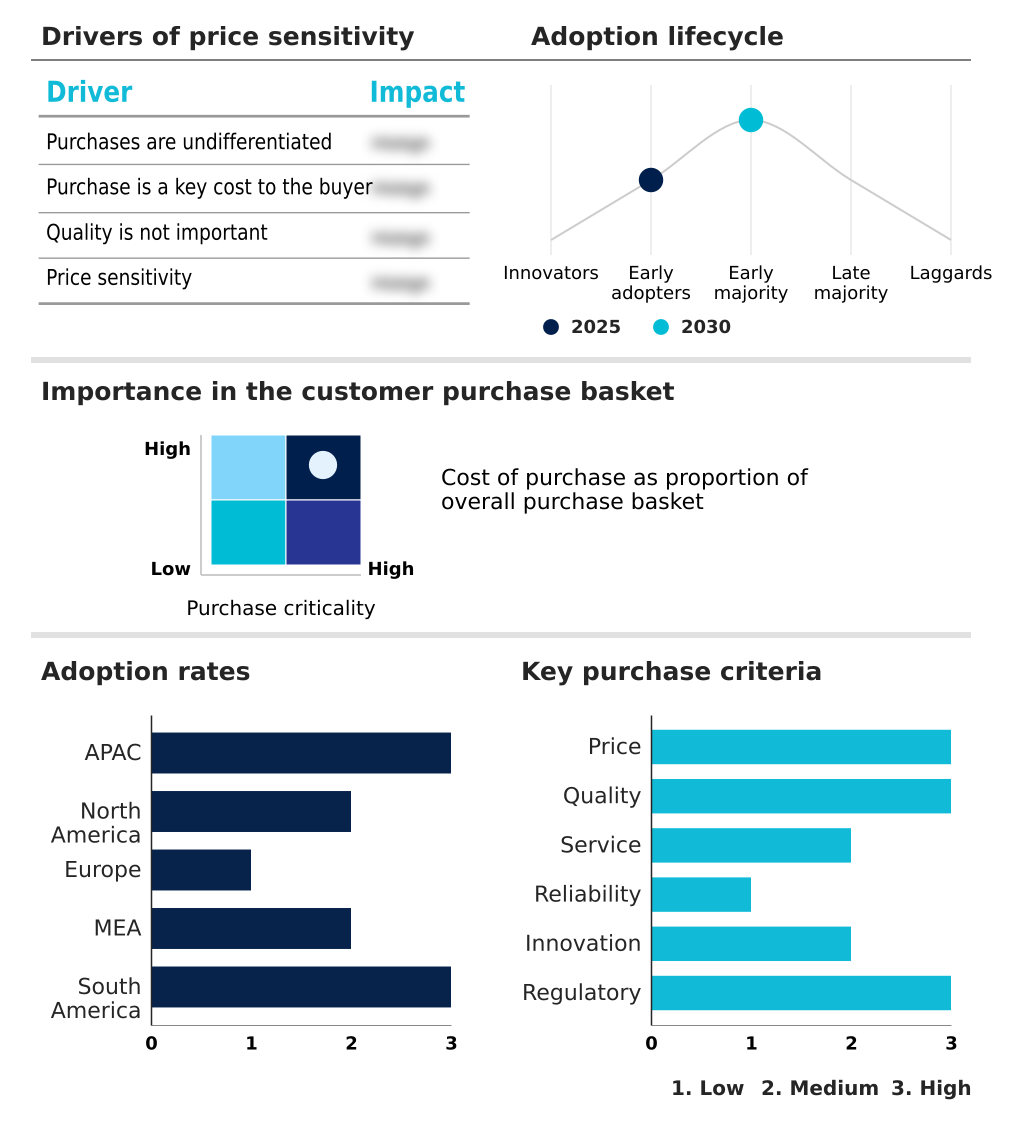
Exclusive Technavio Analysis on Customer Landscape

The raid controller card market forecasting report includes the adoption lifecycle of the market, covering from the innovator’s stage to the laggard’s stage. It focuses on adoption rates in different regions based on penetration. Furthermore, the raid controller card market report also includes key purchase criteria and drivers of price sensitivity to help companies evaluate and develop their market growth analysis strategies.

Customer Landscape of RAID Controller Card Industry

Competitive Landscape

Companies are implementing various strategies, such as strategic alliances, raid controller card market forecast, partnerships, mergers and acquisitions, geographical expansion, and product/service launches, to enhance their presence in the industry.

Advanced HPC Inc. - Provides specialized storage connectivity and infrastructure solutions, enabling high-performance data management and delivery for enterprise IT.

The industry research and growth report includes detailed analyses of the competitive landscape of the market and information about key companies, including:

  • Advanced HPC Inc.
  • Advantech Co. Ltd.
  • Areca Technology Corp.
  • ATTO Technology Inc.
  • Broadcom Inc.
  • Dell Technologies Inc.
  • Fujitsu Ltd.
  • Hewlett Packard Enterprise Co.
  • HighPoint Inc.
  • Huawei Technologies Co. Ltd.
  • IBM Corp.
  • Intel Corp.
  • Lenovo Group Ltd.
  • Silicon Motion Technology Corp.
  • Marvell Technology Inc.
  • Microchip Technology Inc.
  • NEC Corp.
  • StarTech.com Ltd.
  • Super Micro Computer Inc.
  • Vantec Thermal Technologies Inc

Qualitative and quantitative analysis of companies has been conducted to help clients understand the wider business environment as well as the strengths and weaknesses of key industry players. Data is qualitatively analyzed to categorize companies as pure play, category-focused, industry-focused, and diversified; it is quantitatively analyzed to categorize companies as dominant, leading, strong, tentative, and weak.

Recent Development and News in Raid controller card market

  • In August, 2024, Scala Data Centers initiated a partnership with Serena to source renewable energy for its hyperscale data centers in Brazil, beginning in January 2025.
  • In January, 2025, CloudHQ and ESR announced a partnership to develop a $2 billion data center campus in Japan to meet the increasing demand for high-quality data capacity in the region.
  • In January, 2025, Microsoft announced an ambitious plan to invest approximately $80 billion in the construction of new data centers to address the escalating demand for data processing and storage capabilities.
  • In February, 2025, Brookfield Infrastructure Partners and Data4 announced a landmark investment of over $20.7 billion to develop artificial intelligence infrastructure in France, aiming to enhance the region's data infrastructure.

Dive into Technavio’s robust research methodology, blending expert interviews, extensive data synthesis, and validated models for unparalleled RAID Controller Card Market insights. See full methodology.

Market Scope
Page number 315
Base year 2025
Historic period 2020-2024
Forecast period 2026-2030
Growth momentum & CAGR Accelerate at a CAGR of 4.5%
Market growth 2026-2030 USD 1091.8 million
Market structure Fragmented
YoY growth 2025-2026(%) 4.3%
Key countries China, India, Japan, South Korea, Singapore, Indonesia, US, Canada, Mexico, Germany, UK, France, The Netherlands, Italy, Spain, UAE, Saudi Arabia, South Africa, Israel, Egypt, Brazil, Argentina and Chile
Competitive landscape Leading Companies, Market Positioning of Companies, Competitive Strategies, and Industry Risks

Request Free Sample

Research Analyst Overview

  • The RAID controller card market is undergoing a fundamental transformation, driven by the dual needs for extreme performance and architectural flexibility. In boardroom-level strategy discussions, the selection of a hardware RAID controller is no longer a simple procurement decision but a strategic choice impacting overall data center efficiency and readiness for future workloads.
  • The industry is rapidly advancing with the adoption of the PCIe Gen 5.0 interface and the integration of Tri-Mode SerDes technology, which allows a single card to manage a heterogeneous environment of SAS and SATA protocols alongside NVMe-based solid state storage. This is crucial for creating a tiered storage solution.
  • Advanced features like data striping, data mirroring, data-at-rest encryption, and support for RAID 0 striping and RAID 6 configuration are now standard. The evolution includes the emergence of computational storage integration, where the RAID-on-Chip processor, supported by a battery backup unit for its write-back caching, handles not just parity generation and parity calculations but also application-specific tasks.
  • While software defined storage and simple host bus adapters using erasure coding are prevalent in some scale-out scenarios, the need for high-availability storage with guaranteed I/O performance and fault tolerance in direct attached storage, storage area networks, and network attached storage ensures continued demand.
  • The latest PCIe 5.0 RAID controllers are engineered to manage PCIe 4.0 NVMe SSDs and future drives, supporting innovations like universal flash storage, hot-swapping capability, and architectures like NVMe over Fabrics, all built on standards like serial attached SCSI and the advanced host controller interface to provide robust data redundancy.

What are the Key Data Covered in this RAID Controller Card Market Research and Growth Report?

  • What is the expected growth of the RAID Controller Card Market between 2026 and 2030?

    • USD 1.09 billion, at a CAGR of 4.5%

  • What segmentation does the market report cover?

    • The report is segmented by End-user (Small enterprises, and Large enterprises), Product (Hardware RAID, and Software RAID), Application (Data centers, Cloud computing, Enterprise storage, SMEs, and Personal computers) and Geography (APAC, North America, Europe, Middle East and Africa, South America)

  • Which regions are analyzed in the report?

    • APAC, North America, Europe, Middle East and Africa and South America

  • What are the key growth drivers and market challenges?

    • Proliferation of NVMe storage, Rise of software defined storage

  • Who are the major players in the RAID Controller Card Market?

    • Advanced HPC Inc., Advantech Co. Ltd., Areca Technology Corp., ATTO Technology Inc., Broadcom Inc., Dell Technologies Inc., Fujitsu Ltd., Hewlett Packard Enterprise Co., HighPoint Inc., Huawei Technologies Co. Ltd., IBM Corp., Intel Corp., Lenovo Group Ltd., Silicon Motion Technology Corp., Marvell Technology Inc., Microchip Technology Inc., NEC Corp., StarTech.com Ltd., Super Micro Computer Inc. and Vantec Thermal Technologies Inc

Market Research Insights

  • Market dynamics are increasingly shaped by the need for enhanced storage performance acceleration and workload optimization in data-intensive environments. The shift to advanced storage infrastructure is evident, with organizations that adopt all-flash NVMe storage for mission-critical applications reporting performance improvements of over 300%.
  • This is coupled with a more than 50% reduction in application response times, a critical factor for maintaining system reliability and business continuity. Such gains are driving technology refresh cycles focused on eliminating storage I/O bottlenecks.
  • Effective data management and robust data protection strategies are integral to this modernization, ensuring that the benefits of speed do not compromise data security or availability, thereby improving overall operational efficiency.

We can help! Our analysts can customize this raid controller card market research report to meet your requirements.

Get in touch

1. Executive Summary

1.1 Market overview

Executive Summary - Chart on Market Overview
Executive Summary - Data Table on Market Overview
Executive Summary - Chart on Global Market Characteristics
Executive Summary - Chart on Market by Geography
Executive Summary - Chart on Market Segmentation by End-user
Executive Summary - Chart on Market Segmentation by Product
Executive Summary - Chart on Market Segmentation by Application
Executive Summary - Chart on Incremental Growth
Executive Summary - Data Table on Incremental Growth
Executive Summary - Chart on Company Market Positioning

2. Technavio Analysis

2.1 Analysis of price sensitivity, lifecycle, customer purchase basket, adoption rates, and purchase criteria

2.2 Criticality of inputs and Factors of differentiation

Chart on Overview on criticality of inputs and factors of differentiation

2.3 Factors of disruption

Chart on Overview on factors of disruption

2.4 Impact of drivers and challenges

Chart on Impact of drivers and challenges in 2025 and 2030

3. Market Landscape

3.1 Market ecosystem

Chart on Parent Market
Data Table on - Parent Market

3.2 Market characteristics

Chart on Market characteristics analysis

3.3 Value chain analysis

Chart on Value chain analysis

4. Market Sizing

4.1 Market definition

Data Table on Offerings of companies included in the market definition

4.2 Market segment analysis

Market segments

4.3 Market size 2025

4.4 Market outlook: Forecast for 2025-2030

Chart on Global - Market size and forecast 2025-2030 ($ million)
Data Table on Global - Market size and forecast 2025-2030 ($ million)
Chart on Global Market: Year-over-year growth 2025-2030 (%)
Data Table on Global Market: Year-over-year growth 2025-2030 (%)

5. Historic Market Size

5.1 Global RAID Controller Card Market 2020 - 2024

Historic Market Size - Data Table on Global RAID Controller Card Market 2020 - 2024 ($ million)

5.2 End-user segment analysis 2020 - 2024

Historic Market Size - End-user Segment 2020 - 2024 ($ million)

5.3 Product segment analysis 2020 - 2024

Historic Market Size - Product Segment 2020 - 2024 ($ million)

5.4 Application segment analysis 2020 - 2024

Historic Market Size - Application Segment 2020 - 2024 ($ million)

5.5 Geography segment analysis 2020 - 2024

Historic Market Size - Geography Segment 2020 - 2024 ($ million)

5.6 Country segment analysis 2020 - 2024

Historic Market Size - Country Segment 2020 - 2024 ($ million)

6. Qualitative Analysis

6.1 Impact of AI on global RAID controller card market

6.2 Impact of geopolitical conflicts on global RAID controller card market

7. Five Forces Analysis

7.1 Five forces summary

Five forces analysis - Comparison between 2025 and 2030

7.2 Bargaining power of buyers

Bargaining power of buyers - Impact of key factors 2025 and 2030

7.3 Bargaining power of suppliers

Bargaining power of suppliers - Impact of key factors in 2025 and 2030

7.4 Threat of new entrants

Threat of new entrants - Impact of key factors in 2025 and 2030

7.5 Threat of substitutes

Threat of substitutes - Impact of key factors in 2025 and 2030

7.6 Threat of rivalry

Threat of rivalry - Impact of key factors in 2025 and 2030

7.7 Market condition

Chart on Market condition - Five forces 2025 and 2030

8. Market Segmentation by End-user

8.1 Market segments

Chart on End-user - Market share 2025-2030 (%)
Data Table on End-user - Market share 2025-2030 (%)

8.2 Comparison by End-user

Chart on Comparison by End-user
Data Table on Comparison by End-user

8.3 Small enterprises - Market size and forecast 2025-2030

Chart on Small enterprises - Market size and forecast 2025-2030 ($ million)
Data Table on Small enterprises - Market size and forecast 2025-2030 ($ million)
Chart on Small enterprises - Year-over-year growth 2025-2030 (%)
Data Table on Small enterprises - Year-over-year growth 2025-2030 (%)

8.4 Large enterprises - Market size and forecast 2025-2030

Chart on Large enterprises - Market size and forecast 2025-2030 ($ million)
Data Table on Large enterprises - Market size and forecast 2025-2030 ($ million)
Chart on Large enterprises - Year-over-year growth 2025-2030 (%)
Data Table on Large enterprises - Year-over-year growth 2025-2030 (%)

8.5 Market opportunity by End-user

Market opportunity by End-user ($ million)
Data Table on Market opportunity by End-user ($ million)

9. Market Segmentation by Product

9.1 Market segments

Chart on Product - Market share 2025-2030 (%)
Data Table on Product - Market share 2025-2030 (%)

9.2 Comparison by Product

Chart on Comparison by Product
Data Table on Comparison by Product

9.3 Hardware RAID - Market size and forecast 2025-2030

Chart on Hardware RAID - Market size and forecast 2025-2030 ($ million)
Data Table on Hardware RAID - Market size and forecast 2025-2030 ($ million)
Chart on Hardware RAID - Year-over-year growth 2025-2030 (%)
Data Table on Hardware RAID - Year-over-year growth 2025-2030 (%)

9.4 Software RAID - Market size and forecast 2025-2030

Chart on Software RAID - Market size and forecast 2025-2030 ($ million)
Data Table on Software RAID - Market size and forecast 2025-2030 ($ million)
Chart on Software RAID - Year-over-year growth 2025-2030 (%)
Data Table on Software RAID - Year-over-year growth 2025-2030 (%)

9.5 Market opportunity by Product

Market opportunity by Product ($ million)
Data Table on Market opportunity by Product ($ million)

10. Market Segmentation by Application

10.1 Market segments

Chart on Application - Market share 2025-2030 (%)
Data Table on Application - Market share 2025-2030 (%)

10.2 Comparison by Application

Chart on Comparison by Application
Data Table on Comparison by Application

10.3 Data centers - Market size and forecast 2025-2030

Chart on Data centers - Market size and forecast 2025-2030 ($ million)
Data Table on Data centers - Market size and forecast 2025-2030 ($ million)
Chart on Data centers - Year-over-year growth 2025-2030 (%)
Data Table on Data centers - Year-over-year growth 2025-2030 (%)

10.4 Cloud computing - Market size and forecast 2025-2030

Chart on Cloud computing - Market size and forecast 2025-2030 ($ million)
Data Table on Cloud computing - Market size and forecast 2025-2030 ($ million)
Chart on Cloud computing - Year-over-year growth 2025-2030 (%)
Data Table on Cloud computing - Year-over-year growth 2025-2030 (%)

10.5 Enterprise storage - Market size and forecast 2025-2030

Chart on Enterprise storage - Market size and forecast 2025-2030 ($ million)
Data Table on Enterprise storage - Market size and forecast 2025-2030 ($ million)
Chart on Enterprise storage - Year-over-year growth 2025-2030 (%)
Data Table on Enterprise storage - Year-over-year growth 2025-2030 (%)

10.6 SMEs - Market size and forecast 2025-2030

Chart on SMEs - Market size and forecast 2025-2030 ($ million)
Data Table on SMEs - Market size and forecast 2025-2030 ($ million)
Chart on SMEs - Year-over-year growth 2025-2030 (%)
Data Table on SMEs - Year-over-year growth 2025-2030 (%)

10.7 Personal computers - Market size and forecast 2025-2030

Chart on Personal computers - Market size and forecast 2025-2030 ($ million)
Data Table on Personal computers - Market size and forecast 2025-2030 ($ million)
Chart on Personal computers - Year-over-year growth 2025-2030 (%)
Data Table on Personal computers - Year-over-year growth 2025-2030 (%)

10.8 Market opportunity by Application

Market opportunity by Application ($ million)
Data Table on Market opportunity by Application ($ million)

11. Customer Landscape

11.1 Customer landscape overview

Analysis of price sensitivity, lifecycle, customer purchase basket, adoption rates, and purchase criteria

12. Geographic Landscape

12.1 Geographic segmentation

Chart on Market share by geography 2025-2030 (%)
Data Table on Market share by geography 2025-2030 (%)

12.2 Geographic comparison

Chart on Geographic comparison
Data Table on Geographic comparison

12.3 APAC - Market size and forecast 2025-2030

Chart on APAC - Market size and forecast 2025-2030 ($ million)
Data Table on APAC - Market size and forecast 2025-2030 ($ million)
Chart on APAC - Year-over-year growth 2025-2030 (%)
Data Table on APAC - Year-over-year growth 2025-2030 (%)
Chart on Regional Comparison - APAC
Data Table on Regional Comparison - APAC

12.3.1 China - Market size and forecast 2025-2030

Chart on China - Market size and forecast 2025-2030 ($ million)
Data Table on China - Market size and forecast 2025-2030 ($ million)
Chart on China - Year-over-year growth 2025-2030 (%)
Data Table on China - Year-over-year growth 2025-2030 (%)

12.3.2 India - Market size and forecast 2025-2030

Chart on India - Market size and forecast 2025-2030 ($ million)
Data Table on India - Market size and forecast 2025-2030 ($ million)
Chart on India - Year-over-year growth 2025-2030 (%)
Data Table on India - Year-over-year growth 2025-2030 (%)

12.3.3 Japan - Market size and forecast 2025-2030

Chart on Japan - Market size and forecast 2025-2030 ($ million)
Data Table on Japan - Market size and forecast 2025-2030 ($ million)
Chart on Japan - Year-over-year growth 2025-2030 (%)
Data Table on Japan - Year-over-year growth 2025-2030 (%)

12.3.4 South Korea - Market size and forecast 2025-2030

Chart on South Korea - Market size and forecast 2025-2030 ($ million)
Data Table on South Korea - Market size and forecast 2025-2030 ($ million)
Chart on South Korea - Year-over-year growth 2025-2030 (%)
Data Table on South Korea - Year-over-year growth 2025-2030 (%)

12.3.5 Singapore - Market size and forecast 2025-2030

Chart on Singapore - Market size and forecast 2025-2030 ($ million)
Data Table on Singapore - Market size and forecast 2025-2030 ($ million)
Chart on Singapore - Year-over-year growth 2025-2030 (%)
Data Table on Singapore - Year-over-year growth 2025-2030 (%)

12.3.6 Indonesia - Market size and forecast 2025-2030

Chart on Indonesia - Market size and forecast 2025-2030 ($ million)
Data Table on Indonesia - Market size and forecast 2025-2030 ($ million)
Chart on Indonesia - Year-over-year growth 2025-2030 (%)
Data Table on Indonesia - Year-over-year growth 2025-2030 (%)

12.4 North America - Market size and forecast 2025-2030

Chart on North America - Market size and forecast 2025-2030 ($ million)
Data Table on North America - Market size and forecast 2025-2030 ($ million)
Chart on North America - Year-over-year growth 2025-2030 (%)
Data Table on North America - Year-over-year growth 2025-2030 (%)
Chart on Regional Comparison - North America
Data Table on Regional Comparison - North America

12.4.1 US - Market size and forecast 2025-2030

Chart on US - Market size and forecast 2025-2030 ($ million)
Data Table on US - Market size and forecast 2025-2030 ($ million)
Chart on US - Year-over-year growth 2025-2030 (%)
Data Table on US - Year-over-year growth 2025-2030 (%)

12.4.2 Canada - Market size and forecast 2025-2030

Chart on Canada - Market size and forecast 2025-2030 ($ million)
Data Table on Canada - Market size and forecast 2025-2030 ($ million)
Chart on Canada - Year-over-year growth 2025-2030 (%)
Data Table on Canada - Year-over-year growth 2025-2030 (%)

12.4.3 Mexico - Market size and forecast 2025-2030

Chart on Mexico - Market size and forecast 2025-2030 ($ million)
Data Table on Mexico - Market size and forecast 2025-2030 ($ million)
Chart on Mexico - Year-over-year growth 2025-2030 (%)
Data Table on Mexico - Year-over-year growth 2025-2030 (%)

12.5 Europe - Market size and forecast 2025-2030

Chart on Europe - Market size and forecast 2025-2030 ($ million)
Data Table on Europe - Market size and forecast 2025-2030 ($ million)
Chart on Europe - Year-over-year growth 2025-2030 (%)
Data Table on Europe - Year-over-year growth 2025-2030 (%)
Chart on Regional Comparison - Europe
Data Table on Regional Comparison - Europe

12.5.1 Germany - Market size and forecast 2025-2030

Chart on Germany - Market size and forecast 2025-2030 ($ million)
Data Table on Germany - Market size and forecast 2025-2030 ($ million)
Chart on Germany - Year-over-year growth 2025-2030 (%)
Data Table on Germany - Year-over-year growth 2025-2030 (%)

12.5.2 UK - Market size and forecast 2025-2030

Chart on UK - Market size and forecast 2025-2030 ($ million)
Data Table on UK - Market size and forecast 2025-2030 ($ million)
Chart on UK - Year-over-year growth 2025-2030 (%)
Data Table on UK - Year-over-year growth 2025-2030 (%)

12.5.3 France - Market size and forecast 2025-2030

Chart on France - Market size and forecast 2025-2030 ($ million)
Data Table on France - Market size and forecast 2025-2030 ($ million)
Chart on France - Year-over-year growth 2025-2030 (%)
Data Table on France - Year-over-year growth 2025-2030 (%)

12.5.4 The Netherlands - Market size and forecast 2025-2030

Chart on The Netherlands - Market size and forecast 2025-2030 ($ million)
Data Table on The Netherlands - Market size and forecast 2025-2030 ($ million)
Chart on The Netherlands - Year-over-year growth 2025-2030 (%)
Data Table on The Netherlands - Year-over-year growth 2025-2030 (%)

12.5.5 Italy - Market size and forecast 2025-2030

Chart on Italy - Market size and forecast 2025-2030 ($ million)
Data Table on Italy - Market size and forecast 2025-2030 ($ million)
Chart on Italy - Year-over-year growth 2025-2030 (%)
Data Table on Italy - Year-over-year growth 2025-2030 (%)

12.5.6 Spain - Market size and forecast 2025-2030

Chart on Spain - Market size and forecast 2025-2030 ($ million)
Data Table on Spain - Market size and forecast 2025-2030 ($ million)
Chart on Spain - Year-over-year growth 2025-2030 (%)
Data Table on Spain - Year-over-year growth 2025-2030 (%)

12.6 Middle East and Africa - Market size and forecast 2025-2030

Chart on Middle East and Africa - Market size and forecast 2025-2030 ($ million)
Data Table on Middle East and Africa - Market size and forecast 2025-2030 ($ million)
Chart on Middle East and Africa - Year-over-year growth 2025-2030 (%)
Data Table on Middle East and Africa - Year-over-year growth 2025-2030 (%)
Chart on Regional Comparison - Middle East and Africa
Data Table on Regional Comparison - Middle East and Africa

12.6.1 UAE - Market size and forecast 2025-2030

Chart on UAE - Market size and forecast 2025-2030 ($ million)
Data Table on UAE - Market size and forecast 2025-2030 ($ million)
Chart on UAE - Year-over-year growth 2025-2030 (%)
Data Table on UAE - Year-over-year growth 2025-2030 (%)

12.6.2 Saudi Arabia - Market size and forecast 2025-2030

Chart on Saudi Arabia - Market size and forecast 2025-2030 ($ million)
Data Table on Saudi Arabia - Market size and forecast 2025-2030 ($ million)
Chart on Saudi Arabia - Year-over-year growth 2025-2030 (%)
Data Table on Saudi Arabia - Year-over-year growth 2025-2030 (%)

12.6.3 South Africa - Market size and forecast 2025-2030

Chart on South Africa - Market size and forecast 2025-2030 ($ million)
Data Table on South Africa - Market size and forecast 2025-2030 ($ million)
Chart on South Africa - Year-over-year growth 2025-2030 (%)
Data Table on South Africa - Year-over-year growth 2025-2030 (%)

12.6.4 Israel - Market size and forecast 2025-2030

Chart on Israel - Market size and forecast 2025-2030 ($ million)
Data Table on Israel - Market size and forecast 2025-2030 ($ million)
Chart on Israel - Year-over-year growth 2025-2030 (%)
Data Table on Israel - Year-over-year growth 2025-2030 (%)

12.6.5 Egypt - Market size and forecast 2025-2030

Chart on Egypt - Market size and forecast 2025-2030 ($ million)
Data Table on Egypt - Market size and forecast 2025-2030 ($ million)
Chart on Egypt - Year-over-year growth 2025-2030 (%)
Data Table on Egypt - Year-over-year growth 2025-2030 (%)

12.7 South America - Market size and forecast 2025-2030

Chart on South America - Market size and forecast 2025-2030 ($ million)
Data Table on South America - Market size and forecast 2025-2030 ($ million)
Chart on South America - Year-over-year growth 2025-2030 (%)
Data Table on South America - Year-over-year growth 2025-2030 (%)
Chart on Regional Comparison - South America
Data Table on Regional Comparison - South America

12.7.1 Brazil - Market size and forecast 2025-2030

Chart on Brazil - Market size and forecast 2025-2030 ($ million)
Data Table on Brazil - Market size and forecast 2025-2030 ($ million)
Chart on Brazil - Year-over-year growth 2025-2030 (%)
Data Table on Brazil - Year-over-year growth 2025-2030 (%)

12.7.2 Argentina - Market size and forecast 2025-2030

Chart on Argentina - Market size and forecast 2025-2030 ($ million)
Data Table on Argentina - Market size and forecast 2025-2030 ($ million)
Chart on Argentina - Year-over-year growth 2025-2030 (%)
Data Table on Argentina - Year-over-year growth 2025-2030 (%)

12.7.3 Chile - Market size and forecast 2025-2030

Chart on Chile - Market size and forecast 2025-2030 ($ million)
Data Table on Chile - Market size and forecast 2025-2030 ($ million)
Chart on Chile - Year-over-year growth 2025-2030 (%)
Data Table on Chile - Year-over-year growth 2025-2030 (%)

12.8 Market opportunity by geography

Market opportunity by geography ($ million)
Data Tables on Market opportunity by geography ($ million)

13. Drivers, Challenges, and Opportunity

13.1 Market drivers

Proliferation of NVMe storage
Explosive data generation growth
Data center modernization initiatives

13.2 Market challenges

Rise of software defined storage
Increasing controller design complexity
Bottlenecks in supply chains

13.3 Impact of drivers and challenges

Impact of drivers and challenges in 2025 and 2030

13.4 Market opportunities

Tri Mode SerDes technology adoption
Computational storage integration emerges
PCIe Gen 5.0 standardization

14. Competitive Landscape

14.1 Overview

14.2

Overview on criticality of inputs and factors of differentiation

14.3 Landscape disruption

Overview on factors of disruption

14.4 Industry risks

Impact of key risks on business

15. Competitive Analysis

15.1 Companies profiled

Companies covered

15.2 Company ranking index

15.3 Market positioning of companies

Matrix on companies position and classification

15.4 Advanced HPC Inc.

Advanced HPC Inc. - Overview
Advanced HPC Inc. - Product / Service
Advanced HPC Inc. - Key offerings
SWOT

15.5 Advantech Co. Ltd.

Advantech Co. Ltd. - Overview
Advantech Co. Ltd. - Business segments
Advantech Co. Ltd. - Key offerings
Advantech Co. Ltd. - Segment focus
SWOT

15.6 Broadcom Inc.

Broadcom Inc. - Overview
Broadcom Inc. - Business segments
Broadcom Inc. - Key news
Broadcom Inc. - Key offerings
Broadcom Inc. - Segment focus
SWOT

15.7 Dell Technologies Inc.

Dell Technologies Inc. - Overview
Dell Technologies Inc. - Business segments
Dell Technologies Inc. - Key offerings
Dell Technologies Inc. - Segment focus
SWOT

15.8 Fujitsu Ltd.

Fujitsu Ltd. - Overview
Fujitsu Ltd. - Business segments
Fujitsu Ltd. - Key offerings
Fujitsu Ltd. - Segment focus
SWOT

15.9 Hewlett Packard Enterprise Co.

Hewlett Packard Enterprise Co. - Overview
Hewlett Packard Enterprise Co. - Business segments
Hewlett Packard Enterprise Co. - Key offerings
Hewlett Packard Enterprise Co. - Segment focus
SWOT

15.10 Huawei Technologies Co. Ltd.

Huawei Technologies Co. Ltd. - Overview
Huawei Technologies Co. Ltd. - Business segments
Huawei Technologies Co. Ltd. - Key news
Huawei Technologies Co. Ltd. - Key offerings
Huawei Technologies Co. Ltd. - Segment focus
SWOT

15.11 IBM Corp.

IBM Corp. - Overview
IBM Corp. - Business segments
IBM Corp. - Key offerings
IBM Corp. - Segment focus
SWOT

15.12 Intel Corp.

Intel Corp. - Overview
Intel Corp. - Business segments
Intel Corp. - Key offerings
Intel Corp. - Segment focus
SWOT

15.13 Lenovo Group Ltd.

Lenovo Group Ltd. - Overview
Lenovo Group Ltd. - Business segments
Lenovo Group Ltd. - Key offerings
Lenovo Group Ltd. - Segment focus
SWOT

15.14 Silicon Motion Technology Corp.

Silicon Motion Technology Corp. - Overview
Silicon Motion Technology Corp. - Product / Service
Silicon Motion Technology Corp. - Key offerings
SWOT

15.15 Marvell Technology Inc.

Marvell Technology Inc. - Overview
Marvell Technology Inc. - Product / Service
Marvell Technology Inc. - Key news
Marvell Technology Inc. - Key offerings
SWOT

15.16 Microchip Technology Inc.

Microchip Technology Inc. - Overview
Microchip Technology Inc. - Business segments
Microchip Technology Inc. - Key offerings
Microchip Technology Inc. - Segment focus
SWOT

15.17 NEC Corp.

NEC Corp. - Overview
NEC Corp. - Business segments
NEC Corp. - Key offerings
NEC Corp. - Segment focus
SWOT

15.18 Super Micro Computer Inc.

Super Micro Computer Inc. - Overview
Super Micro Computer Inc. - Business segments
Super Micro Computer Inc. - Key offerings
Super Micro Computer Inc. - Segment focus
SWOT

16. Appendix

16.1 Scope of the report

Market definition
Objectives
Notes and caveats

16.2 Inclusions and exclusions checklist

Inclusions checklist
Exclusions checklist

16.3 Currency conversion rates for US$

16.4 Research methodology

16.5 Data procurement

Information sources

16.6 Data validation

16.7 Validation techniques employed for market sizing

16.8 Data synthesis

16.9 360 degree market analysis

16.10 List of abbreviations

Research Methodology

Technavio presents a detailed picture of the market by way of study, synthesis, and summation of data from multiple sources. The analysts have presented the various facets of the market with a particular focus on identifying the key industry influencers. The data thus presented is comprehensive, reliable, and the result of extensive research, both primary and secondary.

INFORMATION SOURCES

Primary sources

  • Manufacturers and suppliers
  • Channel partners
  • Industry experts
  • Strategic decision makers

Secondary sources

  • Industry journals and periodicals
  • Government data
  • Financial reports of key industry players
  • Historical data
  • Press releases

DATA ANALYSIS

Data Synthesis

  • Collation of data
  • Estimation of key figures
  • Analysis of derived insights

Data Validation

  • Triangulation with data models
  • Reference against proprietary databases
  • Corroboration with industry experts

REPORT WRITING

Qualitative

  • Market drivers
  • Market challenges
  • Market trends
  • Five forces analysis

Quantitative

  • Market size and forecast
  • Market segmentation
  • Geographical insights
  • Competitive landscape

Interested in this report?

Get your sample now to see our research methodology and insights!

Download Now

Frequently Asked Questions

RAID Controller Card market growth will increase by USD 1091.8 million during 2026-2030.

The RAID Controller Card market is expected to grow at a CAGR of 4.5% during 2026-2030.

RAID Controller Card market is segmented by End-user (Small enterprises, Large enterprises) Product (Hardware RAID, Software RAID) Application (Data centers, Cloud computing, Enterprise storage, SMEs, Personal computers)

Advanced HPC Inc., Advantech Co. Ltd., Areca Technology Corp., ATTO Technology Inc., Broadcom Inc., Dell Technologies Inc., Fujitsu Ltd., Hewlett Packard Enterprise Co., HighPoint Inc., Huawei Technologies Co. Ltd., IBM Corp., Intel Corp., Lenovo Group Ltd., Silicon Motion Technology Corp., Marvell Technology Inc., Microchip Technology Inc., NEC Corp., StarTech.com Ltd., Super Micro Computer Inc., Vantec Thermal Technologies Inc are a few of the key vendors in the RAID Controller Card market.

APAC will register the highest growth rate of 38.9% among the other regions. Therefore, the RAID Controller Card market in APAC is expected to garner significant business opportunities for the vendors during the forecast period.

China, India, Japan, South Korea, Singapore, Indonesia, US, Canada, Mexico, Germany, UK, France, The Netherlands, Italy, Spain, UAE, Saudi Arabia, South Africa, Israel, Egypt, Brazil, Argentina, Chile

  • Proliferation of NVMe storage is the driving factor this market.

The RAID Controller Card market vendors should focus on grabbing business opportunities from the End-user segment as it accounted for the largest market share in the base year.
RIA - Research AI Assistant
Ask RIA