Property Management Market Analysis, Size, and Forecast 2026-2030: North America (US, Canada, and Mexico), Europe (Germany, UK, and France), APAC (China, Japan, and India), South America (Brazil and Argentina), Middle East and Africa (Saudi Arabia, UAE, and South Africa), and Rest of World (ROW)

Property Management Market Analysis, Size, and Forecast 2026-2030:
North America (US, Canada, and Mexico), Europe (Germany, UK, and France), APAC (China, Japan, and India), South America (Brazil and Argentina), Middle East and Africa (Saudi Arabia, UAE, and South Africa), and Rest of World (ROW)

Published: Mar 2026 290 Pages SKU: IRTNTR74814

Market Overview at a Glance

$14.47 B
Market Opportunity
8.5%
CAGR 2025 - 2030
31%
APAC Growth
$9.42 B
Commercial segment 2024

Property Management Market Size 2026-2030

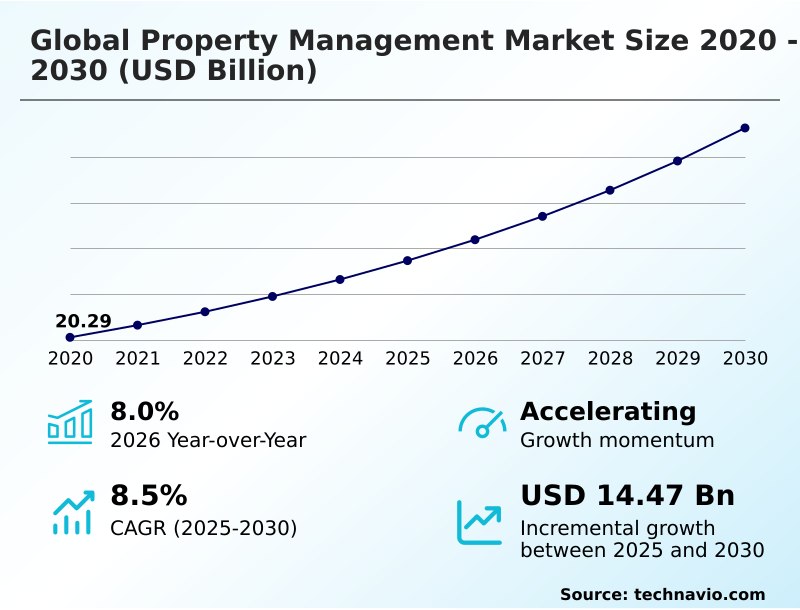
The property management market size is valued to increase by USD 14.47 billion, at a CAGR of 8.5% from 2025 to 2030. Growing institutional investment and professionalization of residential sector will drive the property management market.

Major Market Trends & Insights

  • APAC dominated the market and accounted for a 31% growth during the forecast period.
  • By Application - Commercial segment was valued at USD 9.42 billion in 2024
  • By Component - Solutions segment accounted for the largest market revenue share in 2024

Market Size & Forecast

  • Market Opportunities: USD 22.84 billion
  • Market Future Opportunities: USD 14.47 billion
  • CAGR from 2025 to 2030 : 8.5%

Market Summary

  • The property management market is undergoing a significant transformation, driven by the need for greater operational efficiency and enhanced tenant satisfaction. This evolution is marked by a widespread shift toward cloud-based platforms that centralize core functions like tenant management, lease management, and financial reporting.
  • A key driver is the growing institutional investment in real estate, which demands sophisticated tools for asset optimization and detailed performance tracking. Concurrently, the proliferation of smart building technologies and IoT connectivity is redefining property operations, enabling predictive maintenance and real-time energy consumption monitoring.
  • For instance, a large residential portfolio manager can leverage AI-driven analytics to automate lease renewals and maintenance schedules, reducing administrative overhead by up to 25% and improving tenant retention. However, this increased reliance on interconnected software ecosystems introduces significant challenges, particularly concerning cybersecurity vulnerabilities and data privacy compliance.
  • Navigating the complex landscape of regulatory compliance while protecting sensitive tenant data remains a critical focus for firms aiming to capitalize on technological advancements and maintain a competitive edge in an increasingly digital-first industry. The integration of digital payment systems and mobile-first property management applications further streamlines operations, enhancing both manager productivity and the overall tenant experience.

What will be the Size of the Property Management Market during the forecast period?

Get Key Insights on Market Forecast (PDF) Request Free Sample

How is the Property Management Market Segmented?

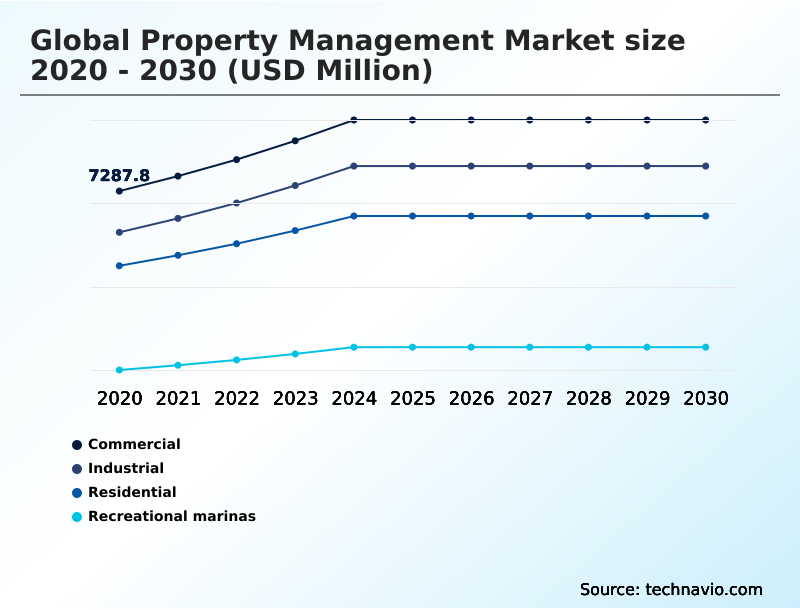
The property management industry research report provides comprehensive data (region-wise segment analysis), with forecasts and estimates in "USD million" for the period 2026-2030, as well as historical data from 2020-2024 for the following segments.

  • Application
    • Commercial
    • Industrial
    • Residential
    • Recreational marinas
  • Component
    • Solutions
    • Services
  • Deployment
    • Cloud-based
    • On-premises
  • Geography
    • North America
      • US
      • Canada
      • Mexico
    • Europe
      • Germany
      • UK
      • France
    • APAC
      • China
      • Japan
      • India
    • South America
      • Brazil
      • Argentina
    • Middle East and Africa
      • Saudi Arabia
      • UAE
      • South Africa
    • Rest of World (ROW)

By Application Insights

The commercial segment is estimated to witness significant growth during the forecast period.

The commercial application segment is defined by a strategic pivot toward high-performance workspaces that emphasize tenant experience and operational sustainability. The adoption of unified platforms is accelerating to manage complex systems and meet stringent ESG compliance standards.

Property managers now provide strategic commercial property advisory, using predictive analytics to optimize asset performance and deliver automated financial reporting. This evolution reflects a shift from basic facility management solutions to creating integrated ecosystems that support hybrid work models.

The demand for flexible and hybrid spaces and robust digital infrastructure has increased tenant satisfaction by over 15%, transforming traditional offices into connected environments aligned with smart city infrastructure goals, thereby enhancing operational transparency and digital engagement.

Request Free Sample

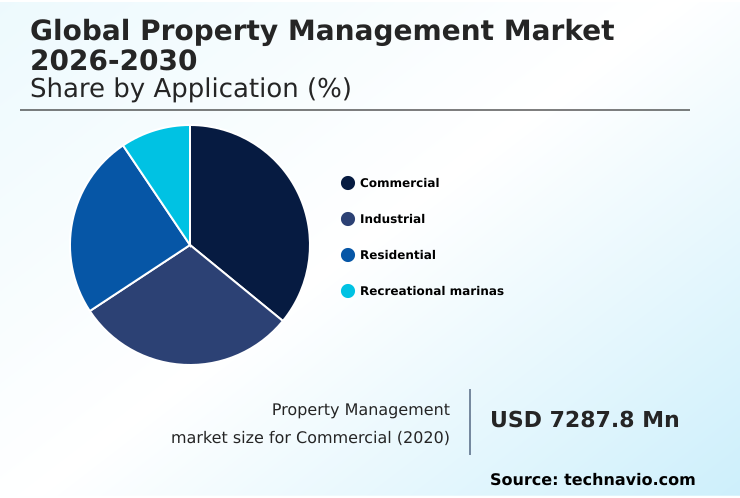
The Commercial segment was valued at USD 9.42 billion in 2024 and showed a gradual increase during the forecast period.

Request Free Sample

Regional Analysis

APAC is estimated to contribute 31% to the growth of the global market during the forecast period.Technavio’s analysts have elaborately explained the regional trends and drivers that shape the market during the forecast period.

See How Property Management Market Demand is Rising in APAC Request Free Sample

The geographic landscape reveals distinct regional adoption rates for advanced property management technologies.

North America leads in the deployment of centralized management systems for the multifamily housing market and single-family rental portfolios, where automated workflows have increased leasing efficiency by 20%.

In APAC, rapid urbanization is driving demand for solutions supporting logistics property management and smart city integration. European markets are focusing on real-time energy optimization, with IoT connectivity in commercial buildings reducing utility costs by over 15%.

The use of cloud-native platforms provides remote accessibility and facilitates asset optimization across global portfolios. These interconnected software ecosystems create data-driven building ecosystems, enabling predictive maintenance and transforming property leasing and management worldwide.

Market Dynamics

Our researchers analyzed the data with 2025 as the base year, along with the key drivers, trends, and challenges. A holistic analysis of drivers will help companies refine their marketing strategies to gain a competitive advantage.

  • The strategic implementation of modern technologies is reshaping the property management market. Firms are leveraging ai-driven analytics in property management for deeper insights into operational patterns and tenant behaviors. The practice of integrating iot in commercial real estate is becoming standard, creating smarter, more responsive environments.
  • A primary focus is addressing cybersecurity for property management software, as the digital shift expands potential threat vectors. In the residential sector, saas solutions for residential property management offer scalability and cost-efficiency, while tenant experience and digital engagement platforms are crucial for retention. The backbone of this transformation is cloud-based platforms for portfolio management, which centralize data and streamline oversight.
  • Predictive maintenance for smart buildings is a key value proposition, reducing downtime and operational costs; one analysis showed it can lower unforeseen repair expenditures by up to 30% compared to reactive models. This is supported by automated workflows for lease administration, which minimize manual errors.
  • Adherence to regulations is managed through a focus on data privacy compliance in real estate and specific tools for regulatory compliance for property managers. Security is enhanced through technologies like biometric access controls in residential properties. Sustainability goals are met via energy consumption monitoring for sustainability and comprehensive esg reporting for institutional investors.
  • The shift is also toward mobile-first property management applications, providing flexibility for staff. Unified platforms for mixed-use properties and centralized systems for multifamily housing ensure consistent service delivery. Ultimately, the goal is to use real-time data for asset performance, thereby improving operational efficiency with ai and optimizing asset optimization through technology integration and digital payment systems for rent collection.

What are the key market drivers leading to the rise in the adoption of Property Management Industry?

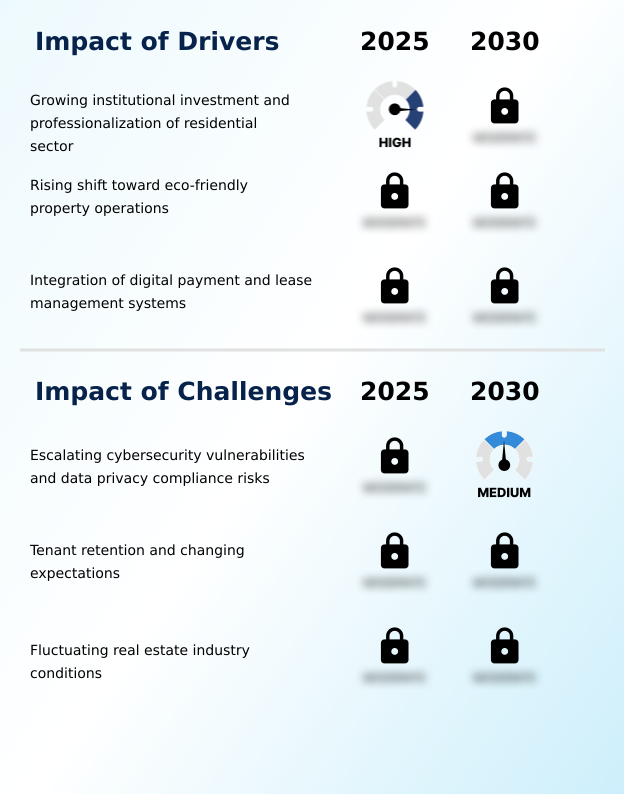
  • The growing institutional investment in real estate and the concurrent professionalization of the residential sector are key drivers fueling market expansion.

  • A primary driver is the rise of institutional investment in real estate, particularly in the multifamily housing market and single-family rental portfolios. This shift necessitates sophisticated property portfolio management to ensure regulatory compliance and asset optimization.
  • The adoption of cloud-based platforms and specialized property management software is critical for achieving operational efficiency in lease management and lease administration, with some firms reporting a 30% reduction in processing times.
  • This professionalization of real estate asset management is also fueling growth in integrated, contractual-based outsourcing. The focus on data-driven decision-making supports investment sales by providing clear performance metrics, driving further market expansion.

What are the market trends shaping the Property Management Industry?

  • The integration of smart city infrastructure and the proliferation of IoT connectivity are emerging as a pivotal trend. This development is reshaping property operations by enabling interconnected and data-driven building ecosystems.

  • A key trend is the integration of property management into broader smart city infrastructure, driven by ubiquitous IoT connectivity. This enables advanced tenant management through platforms offering biometric access controls and digital payment systems, enhancing convenience. The focus on environmental sustainability is leading to the adoption of intelligent document processing, which has reduced paper-based workflows by over 40%.
  • Mobile-first property management applications are becoming standard, supporting flexible and hybrid spaces and improving response times by 25%. In residential sectors, from HOA management to high-volume bookings for short-term rentals, the use of tenant communication portals and automated guest services is creating a more seamless experience, supported by comprehensive digital real estate solutions.

What challenges does the Property Management Industry face during its growth?

  • Escalating cybersecurity vulnerabilities and the increasing complexity of data privacy compliance risks present a significant challenge to the industry's growth trajectory.

  • The increasing reliance on interconnected software ecosystems creates significant cybersecurity vulnerabilities and challenges in data privacy compliance. Centralized management systems, while efficient, concentrate sensitive data from tenant screening service interactions and financial reporting, making data governance and security a top priority. A breach can disrupt facility operations and compromise property leasing data.
  • In industrial real estate services and the global logistics portfolio, securing data-driven building ecosystems is critical, with a single security incident leading to operational downtime losses exceeding 20% in some cases. Firms providing end-to-end facilities management must address the complexities of securing multiple integrated systems, such as those for maintenance request routing, to protect both digital and physical assets.

Exclusive Technavio Analysis on Customer Landscape

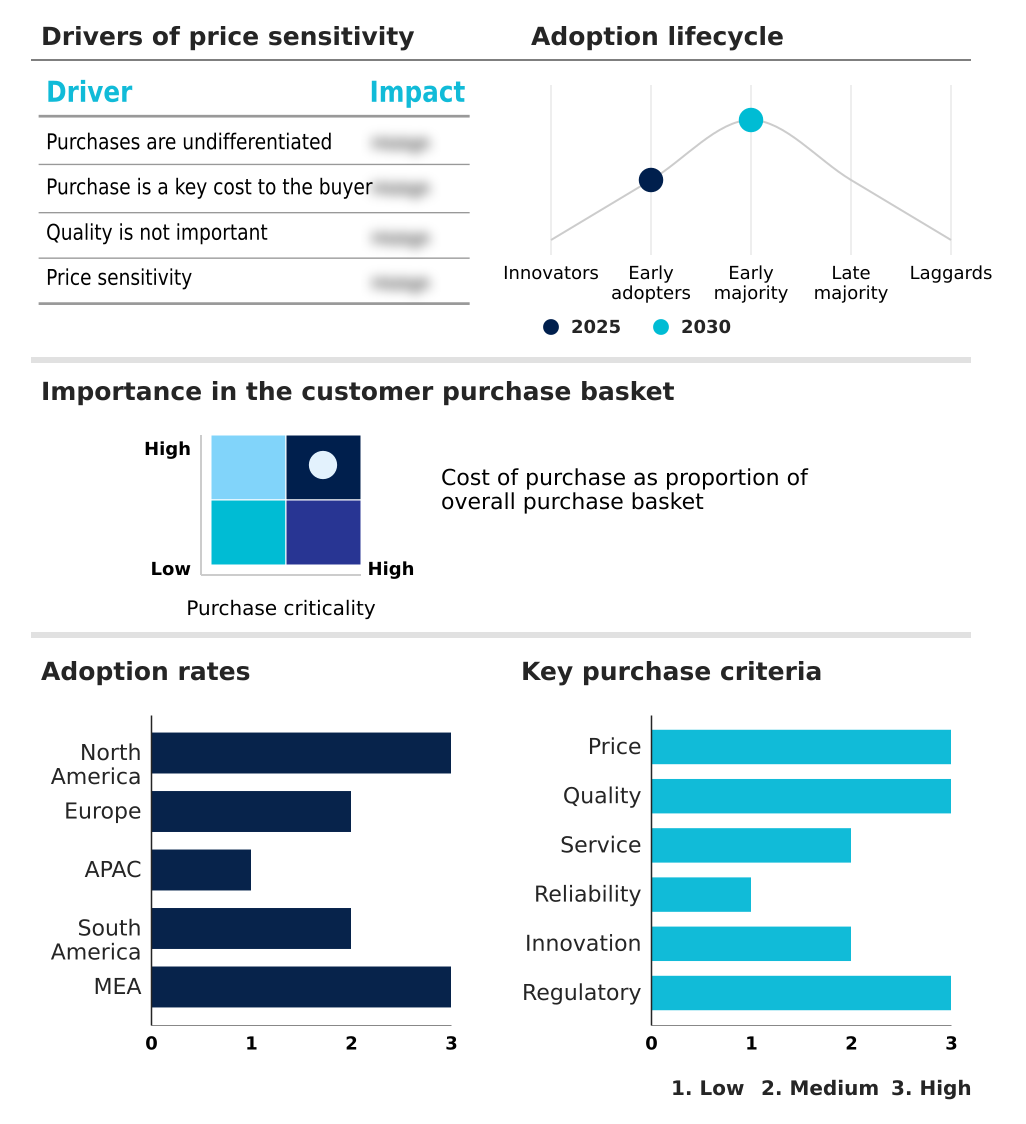
The property management market forecasting report includes the adoption lifecycle of the market, covering from the innovator’s stage to the laggard’s stage. It focuses on adoption rates in different regions based on penetration. Furthermore, the property management market report also includes key purchase criteria and drivers of price sensitivity to help companies evaluate and develop their market growth analysis strategies.

Customer Landscape of Property Management Industry

Competitive Landscape

Companies are implementing various strategies, such as strategic alliances, property management market forecast, partnerships, mergers and acquisitions, geographical expansion, and product/service launches, to enhance their presence in the industry.

Aareon AG - Delivering integrated property management software and digital real estate solutions designed to enhance asset administration and operational oversight.

The industry research and growth report includes detailed analyses of the competitive landscape of the market and information about key companies, including:

  • Aareon AG
  • Avison Young Inc.
  • CBRE Group Inc.
  • Colliers International Group
  • Cushman and Wakefield Plc
  • DMS Property Management
  • FirstService Residential
  • Greystar Worldwide LLC
  • Jones Lang LaSalle Inc.
  • Lincoln Property Co.
  • NAI Global
  • Newmark Group Inc.
  • NoBroker Technologies Pvt. Ltd.
  • Prologis Inc.
  • Propshell Business Solutions
  • RangeWater Real Estate
  • Savills plc
  • Stream Realty Partners LP
  • The Bozzuto Group
  • The RMR Group Inc.

Qualitative and quantitative analysis of companies has been conducted to help clients understand the wider business environment as well as the strengths and weaknesses of key industry players. Data is qualitatively analyzed to categorize companies as pure play, category-focused, industry-focused, and diversified; it is quantitatively analyzed to categorize companies as dominant, leading, strong, tentative, and weak.

Recent Development and News in Property management market

  • In September 2024, JLL launched a new AI-powered platform designed for predictive maintenance and energy optimization in commercial buildings, enhancing operational efficiency for clients.
  • In November 2024, CBRE Group announced the acquisition of a PropTech startup specializing in tenant experience and digital engagement solutions to expand its technology portfolio.
  • In February 2025, Greystar Real Estate Partners revealed a strategic partnership with a leading smart home technology provider to deploy IoT devices across its North American residential portfolio.
  • In April 2025, Cushman & Wakefield introduced a new global service line focused on providing ESG consulting and green building certification services for property owners and investors.

Dive into Technavio’s robust research methodology, blending expert interviews, extensive data synthesis, and validated models for unparalleled Property Management Market insights. See full methodology.

Market Scope
Page number 290
Base year 2025
Historic period 2020-2024
Forecast period 2026-2030
Growth momentum & CAGR Accelerate at a CAGR of 8.5%
Market growth 2026-2030 USD 14474.9 million
Market structure Fragmented
YoY growth 2025-2026(%) 8.0%
Key countries US, Canada, Mexico, Germany, UK, France, Italy, Spain, The Netherlands, China, Japan, India, South Korea, Australia, Indonesia, Brazil, Argentina, Chile, Saudi Arabia, UAE, South Africa, Turkey and Israel
Competitive landscape Leading Companies, Market Positioning of Companies, Competitive Strategies, and Industry Risks

Request Free Sample

Research Analyst Overview

  • The property management market is evolving into a technology-centric industry defined by a push for operational efficiency and superior tenant experience. The adoption of cloud-based platforms is foundational, enabling unified management platforms that integrate everything from tenant management to automated financial reporting. This digital shift facilitates deep AI-driven analytics, which in turn powers predictive maintenance and asset optimization strategies.
  • Boardroom decisions are increasingly influenced by data privacy compliance and the need to mitigate cybersecurity vulnerabilities inherent in interconnected software ecosystems. The integration of smart building technologies, including IoT connectivity and biometric access controls, is no longer a luxury but a competitive necessity to enhance digital engagement.
  • This technological weave supports automated workflows, from digital lease signing to interactions with a tenant screening service. For managers, achieving operational transparency and improving asset performance relies on robust financial reporting and centralized management systems. For tenants, the focus is on a seamless rental housing management experience, underscored by mobile-first property management and efficient digital payment systems.
  • The goal is creating data-driven building ecosystems that prioritize environmental sustainability through intelligent document processing and energy consumption monitoring, ensuring robust property portfolio management in a dynamic landscape.

What are the Key Data Covered in this Property Management Market Research and Growth Report?

  • What is the expected growth of the Property Management Market between 2026 and 2030?

    • USD 14.47 billion, at a CAGR of 8.5%

  • What segmentation does the market report cover?

    • The report is segmented by Application (Commercial, Industrial, Residential, and Recreational marinas), Component (Solutions, and Services), Deployment (Cloud-based, and On-premises) and Geography (North America, Europe, APAC, South America, Middle East and Africa)

  • Which regions are analyzed in the report?

    • North America, Europe, APAC, South America and Middle East and Africa

  • What are the key growth drivers and market challenges?

    • Growing institutional investment and professionalization of residential sector, Escalating cybersecurity vulnerabilities and data privacy compliance risks

  • Who are the major players in the Property Management Market?

    • Aareon AG, Avison Young Inc., CBRE Group Inc., Colliers International Group, Cushman and Wakefield Plc, DMS Property Management, FirstService Residential, Greystar Worldwide LLC, Jones Lang LaSalle Inc., Lincoln Property Co., NAI Global, Newmark Group Inc., NoBroker Technologies Pvt. Ltd., Prologis Inc., Propshell Business Solutions, RangeWater Real Estate, Savills plc, Stream Realty Partners LP, The Bozzuto Group and The RMR Group Inc.

Market Research Insights

  • Market dynamics are increasingly shaped by technological integration, where professional services are enhanced by digital platforms. For instance, the adoption of specialized tenant communication portals has been shown to improve resident satisfaction scores by up to 20%. In real estate asset management, leveraging data analytics has led to a 15% improvement in portfolio performance forecasting.
  • Firms offering commercial property advisory now focus on optimizing facility operations, achieving energy cost reductions of 10% through smart systems. Similarly, in residential community management, automated systems streamline administrative tasks, enhancing service delivery and operational workflows. This convergence of technology and service is pivotal for maintaining a competitive advantage.

We can help! Our analysts can customize this property management market research report to meet your requirements.

Get in touch

1. Executive Summary

1.1 Market overview

Executive Summary - Chart on Market Overview
Executive Summary - Data Table on Market Overview
Executive Summary - Chart on Global Market Characteristics
Executive Summary - Chart on Market by Geography
Executive Summary - Chart on Market Segmentation by Application
Executive Summary - Chart on Market Segmentation by Component
Executive Summary - Chart on Market Segmentation by Deployment
Executive Summary - Chart on Incremental Growth
Executive Summary - Data Table on Incremental Growth
Executive Summary - Chart on Company Market Positioning

2. Technavio Analysis

2.1 Analysis of price sensitivity, lifecycle, customer purchase basket, adoption rates, and purchase criteria

2.2 Criticality of inputs and Factors of differentiation

Chart on Overview on criticality of inputs and factors of differentiation

2.3 Factors of disruption

Chart on Overview on factors of disruption

2.4 Impact of drivers and challenges

Chart on Impact of drivers and challenges in 2025 and 2030

3. Market Landscape

3.1 Market ecosystem

Chart on Parent Market
Data Table on - Parent Market

3.2 Market characteristics

Chart on Market characteristics analysis

3.3 Value chain analysis

Chart on Value chain analysis

4. Market Sizing

4.1 Market definition

Data Table on Offerings of companies included in the market definition

4.2 Market segment analysis

Market segments

4.3 Market size 2025

4.4 Market outlook: Forecast for 2025-2030

Chart on Global - Market size and forecast 2025-2030 ($ million)
Data Table on Global - Market size and forecast 2025-2030 ($ million)
Chart on Global Market: Year-over-year growth 2025-2030 (%)
Data Table on Global Market: Year-over-year growth 2025-2030 (%)

5. Historic Market Size

5.1 Global Property Management Market 2020 - 2024

Historic Market Size - Data Table on Global Property Management Market 2020 - 2024 ($ million)

5.2 Application segment analysis 2020 - 2024

Historic Market Size - Application Segment 2020 - 2024 ($ million)

5.3 Component segment analysis 2020 - 2024

Historic Market Size - Component Segment 2020 - 2024 ($ million)

5.4 Deployment segment analysis 2020 - 2024

Historic Market Size - Deployment Segment 2020 - 2024 ($ million)

5.5 Geography segment analysis 2020 - 2024

Historic Market Size - Geography Segment 2020 - 2024 ($ million)

5.6 Country segment analysis 2020 - 2024

Historic Market Size - Country Segment 2020 - 2024 ($ million)

6. Qualitative Analysis

6.1 Impact of AI in Global Property Management Market

6.2 Impact of Geopolitical Conflict on Global Property Management Market

7. Five Forces Analysis

7.1 Five forces summary

Five forces analysis - Comparison between 2025 and 2030

7.2 Bargaining power of buyers

Bargaining power of buyers - Impact of key factors 2025 and 2030

7.3 Bargaining power of suppliers

Bargaining power of suppliers - Impact of key factors in 2025 and 2030

7.4 Threat of new entrants

Threat of new entrants - Impact of key factors in 2025 and 2030

7.5 Threat of substitutes

Threat of substitutes - Impact of key factors in 2025 and 2030

7.6 Threat of rivalry

Threat of rivalry - Impact of key factors in 2025 and 2030

7.7 Market condition

Chart on Market condition - Five forces 2025 and 2030

8. Market Segmentation by Application

8.1 Market segments

Chart on Application - Market share 2025-2030 (%)
Data Table on Application - Market share 2025-2030 (%)

8.2 Comparison by Application

Chart on Comparison by Application
Data Table on Comparison by Application

8.3 Commercial - Market size and forecast 2025-2030

Chart on Commercial - Market size and forecast 2025-2030 ($ million)
Data Table on Commercial - Market size and forecast 2025-2030 ($ million)
Chart on Commercial - Year-over-year growth 2025-2030 (%)
Data Table on Commercial - Year-over-year growth 2025-2030 (%)

8.4 Industrial - Market size and forecast 2025-2030

Chart on Industrial - Market size and forecast 2025-2030 ($ million)
Data Table on Industrial - Market size and forecast 2025-2030 ($ million)
Chart on Industrial - Year-over-year growth 2025-2030 (%)
Data Table on Industrial - Year-over-year growth 2025-2030 (%)

8.5 Residential - Market size and forecast 2025-2030

Chart on Residential - Market size and forecast 2025-2030 ($ million)
Data Table on Residential - Market size and forecast 2025-2030 ($ million)
Chart on Residential - Year-over-year growth 2025-2030 (%)
Data Table on Residential - Year-over-year growth 2025-2030 (%)

8.6 Recreational marinas - Market size and forecast 2025-2030

Chart on Recreational marinas - Market size and forecast 2025-2030 ($ million)
Data Table on Recreational marinas - Market size and forecast 2025-2030 ($ million)
Chart on Recreational marinas - Year-over-year growth 2025-2030 (%)
Data Table on Recreational marinas - Year-over-year growth 2025-2030 (%)

8.7 Market opportunity by Application

Market opportunity by Application ($ million)
Data Table on Market opportunity by Application ($ million)

9. Market Segmentation by Component

9.1 Market segments

Chart on Component - Market share 2025-2030 (%)
Data Table on Component - Market share 2025-2030 (%)

9.2 Comparison by Component

Chart on Comparison by Component
Data Table on Comparison by Component

9.3 Solutions - Market size and forecast 2025-2030

Chart on Solutions - Market size and forecast 2025-2030 ($ million)
Data Table on Solutions - Market size and forecast 2025-2030 ($ million)
Chart on Solutions - Year-over-year growth 2025-2030 (%)
Data Table on Solutions - Year-over-year growth 2025-2030 (%)

9.4 Services - Market size and forecast 2025-2030

Chart on Services - Market size and forecast 2025-2030 ($ million)
Data Table on Services - Market size and forecast 2025-2030 ($ million)
Chart on Services - Year-over-year growth 2025-2030 (%)
Data Table on Services - Year-over-year growth 2025-2030 (%)

9.5 Market opportunity by Component

Market opportunity by Component ($ million)
Data Table on Market opportunity by Component ($ million)

10. Market Segmentation by Deployment

10.1 Market segments

Chart on Deployment - Market share 2025-2030 (%)
Data Table on Deployment - Market share 2025-2030 (%)

10.2 Comparison by Deployment

Chart on Comparison by Deployment
Data Table on Comparison by Deployment

10.3 Cloud-based - Market size and forecast 2025-2030

Chart on Cloud-based - Market size and forecast 2025-2030 ($ million)
Data Table on Cloud-based - Market size and forecast 2025-2030 ($ million)
Chart on Cloud-based - Year-over-year growth 2025-2030 (%)
Data Table on Cloud-based - Year-over-year growth 2025-2030 (%)

10.4 On-premises - Market size and forecast 2025-2030

Chart on On-premises - Market size and forecast 2025-2030 ($ million)
Data Table on On-premises - Market size and forecast 2025-2030 ($ million)
Chart on On-premises - Year-over-year growth 2025-2030 (%)
Data Table on On-premises - Year-over-year growth 2025-2030 (%)

10.5 Market opportunity by Deployment

Market opportunity by Deployment ($ million)
Data Table on Market opportunity by Deployment ($ million)

11. Customer Landscape

11.1 Customer landscape overview

Analysis of price sensitivity, lifecycle, customer purchase basket, adoption rates, and purchase criteria

12. Geographic Landscape

12.1 Geographic segmentation

Chart on Market share by geography 2025-2030 (%)
Data Table on Market share by geography 2025-2030 (%)

12.2 Geographic comparison

Chart on Geographic comparison
Data Table on Geographic comparison

12.3 North America - Market size and forecast 2025-2030

Chart on North America - Market size and forecast 2025-2030 ($ million)
Data Table on North America - Market size and forecast 2025-2030 ($ million)
Chart on North America - Year-over-year growth 2025-2030 (%)
Data Table on North America - Year-over-year growth 2025-2030 (%)
Chart on Regional Comparison - North America
Data Table on Regional Comparison - North America

12.3.1 US - Market size and forecast 2025-2030

Chart on US - Market size and forecast 2025-2030 ($ million)
Data Table on US - Market size and forecast 2025-2030 ($ million)
Chart on US - Year-over-year growth 2025-2030 (%)
Data Table on US - Year-over-year growth 2025-2030 (%)

12.3.2 Canada - Market size and forecast 2025-2030

Chart on Canada - Market size and forecast 2025-2030 ($ million)
Data Table on Canada - Market size and forecast 2025-2030 ($ million)
Chart on Canada - Year-over-year growth 2025-2030 (%)
Data Table on Canada - Year-over-year growth 2025-2030 (%)

12.3.3 Mexico - Market size and forecast 2025-2030

Chart on Mexico - Market size and forecast 2025-2030 ($ million)
Data Table on Mexico - Market size and forecast 2025-2030 ($ million)
Chart on Mexico - Year-over-year growth 2025-2030 (%)
Data Table on Mexico - Year-over-year growth 2025-2030 (%)

12.4 Europe - Market size and forecast 2025-2030

Chart on Europe - Market size and forecast 2025-2030 ($ million)
Data Table on Europe - Market size and forecast 2025-2030 ($ million)
Chart on Europe - Year-over-year growth 2025-2030 (%)
Data Table on Europe - Year-over-year growth 2025-2030 (%)
Chart on Regional Comparison - Europe
Data Table on Regional Comparison - Europe

12.4.1 Germany - Market size and forecast 2025-2030

Chart on Germany - Market size and forecast 2025-2030 ($ million)
Data Table on Germany - Market size and forecast 2025-2030 ($ million)
Chart on Germany - Year-over-year growth 2025-2030 (%)
Data Table on Germany - Year-over-year growth 2025-2030 (%)

12.4.2 UK - Market size and forecast 2025-2030

Chart on UK - Market size and forecast 2025-2030 ($ million)
Data Table on UK - Market size and forecast 2025-2030 ($ million)
Chart on UK - Year-over-year growth 2025-2030 (%)
Data Table on UK - Year-over-year growth 2025-2030 (%)

12.4.3 France - Market size and forecast 2025-2030

Chart on France - Market size and forecast 2025-2030 ($ million)
Data Table on France - Market size and forecast 2025-2030 ($ million)
Chart on France - Year-over-year growth 2025-2030 (%)
Data Table on France - Year-over-year growth 2025-2030 (%)

12.4.4 Italy - Market size and forecast 2025-2030

Chart on Italy - Market size and forecast 2025-2030 ($ million)
Data Table on Italy - Market size and forecast 2025-2030 ($ million)
Chart on Italy - Year-over-year growth 2025-2030 (%)
Data Table on Italy - Year-over-year growth 2025-2030 (%)

12.4.5 Spain - Market size and forecast 2025-2030

Chart on Spain - Market size and forecast 2025-2030 ($ million)
Data Table on Spain - Market size and forecast 2025-2030 ($ million)
Chart on Spain - Year-over-year growth 2025-2030 (%)
Data Table on Spain - Year-over-year growth 2025-2030 (%)

12.4.6 The Netherlands - Market size and forecast 2025-2030

Chart on The Netherlands - Market size and forecast 2025-2030 ($ million)
Data Table on The Netherlands - Market size and forecast 2025-2030 ($ million)
Chart on The Netherlands - Year-over-year growth 2025-2030 (%)
Data Table on The Netherlands - Year-over-year growth 2025-2030 (%)

12.5 APAC - Market size and forecast 2025-2030

Chart on APAC - Market size and forecast 2025-2030 ($ million)
Data Table on APAC - Market size and forecast 2025-2030 ($ million)
Chart on APAC - Year-over-year growth 2025-2030 (%)
Data Table on APAC - Year-over-year growth 2025-2030 (%)
Chart on Regional Comparison - APAC
Data Table on Regional Comparison - APAC

12.5.1 China - Market size and forecast 2025-2030

Chart on China - Market size and forecast 2025-2030 ($ million)
Data Table on China - Market size and forecast 2025-2030 ($ million)
Chart on China - Year-over-year growth 2025-2030 (%)
Data Table on China - Year-over-year growth 2025-2030 (%)

12.5.2 Japan - Market size and forecast 2025-2030

Chart on Japan - Market size and forecast 2025-2030 ($ million)
Data Table on Japan - Market size and forecast 2025-2030 ($ million)
Chart on Japan - Year-over-year growth 2025-2030 (%)
Data Table on Japan - Year-over-year growth 2025-2030 (%)

12.5.3 India - Market size and forecast 2025-2030

Chart on India - Market size and forecast 2025-2030 ($ million)
Data Table on India - Market size and forecast 2025-2030 ($ million)
Chart on India - Year-over-year growth 2025-2030 (%)
Data Table on India - Year-over-year growth 2025-2030 (%)

12.5.4 South Korea - Market size and forecast 2025-2030

Chart on South Korea - Market size and forecast 2025-2030 ($ million)
Data Table on South Korea - Market size and forecast 2025-2030 ($ million)
Chart on South Korea - Year-over-year growth 2025-2030 (%)
Data Table on South Korea - Year-over-year growth 2025-2030 (%)

12.5.5 Australia - Market size and forecast 2025-2030

Chart on Australia - Market size and forecast 2025-2030 ($ million)
Data Table on Australia - Market size and forecast 2025-2030 ($ million)
Chart on Australia - Year-over-year growth 2025-2030 (%)
Data Table on Australia - Year-over-year growth 2025-2030 (%)

12.5.6 Indonesia - Market size and forecast 2025-2030

Chart on Indonesia - Market size and forecast 2025-2030 ($ million)
Data Table on Indonesia - Market size and forecast 2025-2030 ($ million)
Chart on Indonesia - Year-over-year growth 2025-2030 (%)
Data Table on Indonesia - Year-over-year growth 2025-2030 (%)

12.6 South America - Market size and forecast 2025-2030

Chart on South America - Market size and forecast 2025-2030 ($ million)
Data Table on South America - Market size and forecast 2025-2030 ($ million)
Chart on South America - Year-over-year growth 2025-2030 (%)
Data Table on South America - Year-over-year growth 2025-2030 (%)
Chart on Regional Comparison - South America
Data Table on Regional Comparison - South America

12.6.1 Brazil - Market size and forecast 2025-2030

Chart on Brazil - Market size and forecast 2025-2030 ($ million)
Data Table on Brazil - Market size and forecast 2025-2030 ($ million)
Chart on Brazil - Year-over-year growth 2025-2030 (%)
Data Table on Brazil - Year-over-year growth 2025-2030 (%)

12.6.2 Argentina - Market size and forecast 2025-2030

Chart on Argentina - Market size and forecast 2025-2030 ($ million)
Data Table on Argentina - Market size and forecast 2025-2030 ($ million)
Chart on Argentina - Year-over-year growth 2025-2030 (%)
Data Table on Argentina - Year-over-year growth 2025-2030 (%)

12.6.3 Chile - Market size and forecast 2025-2030

Chart on Chile - Market size and forecast 2025-2030 ($ million)
Data Table on Chile - Market size and forecast 2025-2030 ($ million)
Chart on Chile - Year-over-year growth 2025-2030 (%)
Data Table on Chile - Year-over-year growth 2025-2030 (%)

12.7 Middle East and Africa - Market size and forecast 2025-2030

Chart on Middle East and Africa - Market size and forecast 2025-2030 ($ million)
Data Table on Middle East and Africa - Market size and forecast 2025-2030 ($ million)
Chart on Middle East and Africa - Year-over-year growth 2025-2030 (%)
Data Table on Middle East and Africa - Year-over-year growth 2025-2030 (%)
Chart on Regional Comparison - Middle East and Africa
Data Table on Regional Comparison - Middle East and Africa

12.7.1 Saudi Arabia - Market size and forecast 2025-2030

Chart on Saudi Arabia - Market size and forecast 2025-2030 ($ million)
Data Table on Saudi Arabia - Market size and forecast 2025-2030 ($ million)
Chart on Saudi Arabia - Year-over-year growth 2025-2030 (%)
Data Table on Saudi Arabia - Year-over-year growth 2025-2030 (%)

12.7.2 UAE - Market size and forecast 2025-2030

Chart on UAE - Market size and forecast 2025-2030 ($ million)
Data Table on UAE - Market size and forecast 2025-2030 ($ million)
Chart on UAE - Year-over-year growth 2025-2030 (%)
Data Table on UAE - Year-over-year growth 2025-2030 (%)

12.7.3 South Africa - Market size and forecast 2025-2030

Chart on South Africa - Market size and forecast 2025-2030 ($ million)
Data Table on South Africa - Market size and forecast 2025-2030 ($ million)
Chart on South Africa - Year-over-year growth 2025-2030 (%)
Data Table on South Africa - Year-over-year growth 2025-2030 (%)

12.7.4 Turkey - Market size and forecast 2025-2030

Chart on Turkey - Market size and forecast 2025-2030 ($ million)
Data Table on Turkey - Market size and forecast 2025-2030 ($ million)
Chart on Turkey - Year-over-year growth 2025-2030 (%)
Data Table on Turkey - Year-over-year growth 2025-2030 (%)

12.7.5 Israel - Market size and forecast 2025-2030

Chart on Israel - Market size and forecast 2025-2030 ($ million)
Data Table on Israel - Market size and forecast 2025-2030 ($ million)
Chart on Israel - Year-over-year growth 2025-2030 (%)
Data Table on Israel - Year-over-year growth 2025-2030 (%)

12.8 Market opportunity by geography

Market opportunity by geography ($ million)
Data Tables on Market opportunity by geography ($ million)

13. Drivers, Challenges, and Opportunity

13.1 Market drivers

Growing institutional investment and professionalization of residential sector
Rising shift toward eco-friendly property operations
Integration of digital payment and lease management systems

13.2 Market challenges

Escalating cybersecurity vulnerabilities and data privacy compliance risks
Tenant retention and changing expectations
Fluctuating real estate industry conditions

13.3 Impact of drivers and challenges

Impact of drivers and challenges in 2025 and 2030

13.4 Market opportunities

Smart city infrastructure and IoT connectivity
Growing focus on tenant experience and digital engagement
Expansion of flexible and hybrid spaces

14. Competitive Landscape

14.1 Overview

14.2

Overview on criticality of inputs and factors of differentiation

14.3 Landscape disruption

Overview on factors of disruption

14.4 Industry risks

Impact of key risks on business

15. Competitive Analysis

15.1 Companies profiled

Companies covered

15.2 Company ranking index

15.3 Market positioning of companies

Matrix on companies position and classification

15.4 Aareon AG

Aareon AG - Overview
Aareon AG - Product / Service
Aareon AG - Key offerings
SWOT

15.5 Avison Young Inc.

Avison Young Inc. - Overview
Avison Young Inc. - Product / Service
Avison Young Inc. - Key offerings
SWOT

15.6 CBRE Group Inc.

CBRE Group Inc. - Overview
CBRE Group Inc. - Business segments
CBRE Group Inc. - Key offerings
CBRE Group Inc. - Segment focus
SWOT

15.7 Colliers International Group

Colliers International Group - Overview
Colliers International Group - Business segments
Colliers International Group - Key offerings
Colliers International Group - Segment focus
SWOT

15.8 Cushman and Wakefield Plc

Cushman and Wakefield Plc - Overview
Cushman and Wakefield Plc - Business segments
Cushman and Wakefield Plc - Key offerings
Cushman and Wakefield Plc - Segment focus
SWOT

15.9 FirstService Residential

FirstService Residential - Overview
FirstService Residential - Product / Service
FirstService Residential - Key offerings
SWOT

15.10 Greystar Worldwide LLC

Greystar Worldwide LLC - Overview
Greystar Worldwide LLC - Product / Service
Greystar Worldwide LLC - Key offerings
SWOT

15.11 Jones Lang LaSalle Inc.

Jones Lang LaSalle Inc. - Overview
Jones Lang LaSalle Inc. - Business segments
Jones Lang LaSalle Inc. - Key offerings
Jones Lang LaSalle Inc. - Segment focus
SWOT

15.12 Lincoln Property Co.

Lincoln Property Co. - Overview
Lincoln Property Co. - Product / Service
Lincoln Property Co. - Key offerings
SWOT

15.13 NAI Global

NAI Global - Overview
NAI Global - Product / Service
NAI Global - Key offerings
SWOT

15.14 Newmark Group Inc.

Newmark Group Inc. - Overview
Newmark Group Inc. - Product / Service
Newmark Group Inc. - Key offerings
SWOT

15.15 Prologis Inc.

Prologis Inc. - Overview
Prologis Inc. - Business segments
Prologis Inc. - Key offerings
Prologis Inc. - Segment focus
SWOT

15.16 Savills plc

Savills plc - Overview
Savills plc - Business segments
Savills plc - Key offerings
Savills plc - Segment focus
SWOT

15.17 Stream Realty Partners LP

Stream Realty Partners LP - Overview
Stream Realty Partners LP - Product / Service
Stream Realty Partners LP - Key offerings
SWOT

15.18 The RMR Group Inc.

The RMR Group Inc. - Overview
The RMR Group Inc. - Product / Service
The RMR Group Inc. - Key offerings
SWOT

16. Appendix

16.1 Scope of the report

Market definition
Objectives
Notes and caveats

16.2 Inclusions and exclusions checklist

Inclusions checklist
Exclusions checklist

16.3 Currency conversion rates for US$

16.4 Research methodology

16.5 Data procurement

Information sources

16.6 Data validation

16.7 Validation techniques employed for market sizing

16.8 Data synthesis

16.9 360 degree market analysis

16.10 List of abbreviations

Research Methodology

Technavio presents a detailed picture of the market by way of study, synthesis, and summation of data from multiple sources. The analysts have presented the various facets of the market with a particular focus on identifying the key industry influencers. The data thus presented is comprehensive, reliable, and the result of extensive research, both primary and secondary.

INFORMATION SOURCES

Primary sources

  • Manufacturers and suppliers
  • Channel partners
  • Industry experts
  • Strategic decision makers

Secondary sources

  • Industry journals and periodicals
  • Government data
  • Financial reports of key industry players
  • Historical data
  • Press releases

DATA ANALYSIS

Data Synthesis

  • Collation of data
  • Estimation of key figures
  • Analysis of derived insights

Data Validation

  • Triangulation with data models
  • Reference against proprietary databases
  • Corroboration with industry experts

REPORT WRITING

Qualitative

  • Market drivers
  • Market challenges
  • Market trends
  • Five forces analysis

Quantitative

  • Market size and forecast
  • Market segmentation
  • Geographical insights
  • Competitive landscape

Interested in this report?

Get your sample now to see our research methodology and insights!

Download Now

Frequently Asked Questions

Property Management market growth will increase by USD 14474.9 million during 2026-2030.

The Property Management market is expected to grow at a CAGR of 8.5% during 2026-2030.

Property Management market is segmented by Application (Commercial, Industrial, Residential, Recreational marinas) Component (Solutions, Services) Deployment (Cloud-based, On-premises)

Aareon AG, Avison Young Inc., CBRE Group Inc., Colliers International Group, Cushman and Wakefield Plc, DMS Property Management, FirstService Residential, Greystar Worldwide LLC, Jones Lang LaSalle Inc., Lincoln Property Co., NAI Global, Newmark Group Inc., NoBroker Technologies Pvt. Ltd., Prologis Inc., Propshell Business Solutions, RangeWater Real Estate, Savills plc, Stream Realty Partners LP, The Bozzuto Group, The RMR Group Inc. are a few of the key vendors in the Property Management market.

APAC will register the highest growth rate of 31% among the other regions. Therefore, the Property Management market in APAC is expected to garner significant business opportunities for the vendors during the forecast period.

US, Canada, Mexico, Germany, UK, France, Italy, Spain, The Netherlands, China, Japan, India, South Korea, Australia, Indonesia, Brazil, Argentina, Chile, Saudi Arabia, UAE, South Africa, Turkey, Israel

  • Growing institutional investment and professionalization of residential sector is the driving factor this market.

The Property Management market vendors should focus on grabbing business opportunities from the Application segment as it accounted for the largest market share in the base year.
RIA - Research AI Assistant
Ask RIA