Production Testing Market Analysis North America, APAC, Middle East and Africa, Europe, South America - US, China, Canada, Saudi Arabia, Russia - Size and Forecast 2024-2028

Production Testing Market Analysis North America, APAC, Middle East and Africa, Europe, South America - US, China, Canada, Saudi Arabia, Russia - Size and Forecast 2024-2028

Published: Jul 2024 138 Pages SKU: IRTNTR72872

Market Overview at a Glance

$1.81 B
Market Opportunity
4.83%
CAGR
4.37
YoY growth 2023-2024(%)

Production Testing Market Size 2024-2028

The production testing market size is forecast to increase by USD 1.81 billion at a CAGR of 4.83% between 2023 and 2028.

  • The market is experiencing significant growth due to several key trends. The increasing global consumption of oil and gas is driving market expansion, as the energy sector seeks to meet rising demand. Additionally, the rise in deepwater and ultra-deepwater, exploration and production (E and P) activities is contributing to market growth, as these projects require advanced testing technologies to ensure efficiency and safety. The production testing market is experiencing rapid growth, driven by the integration of artificial intelligence and machine learning technologies to enhance testing efficiency and accuracy. Furthermore, the change in energy mix towards renewable sources is also impacting the market, as traditional energy companies invest in new technologies to adapt to the shifting landscape. These trends are shaping the future of the market and presenting both opportunities and challenges for industry players.

What will be the Size of the Production Testing Market During the Forecast Period?

Production Testing Market Size

 Request Free Sample

  • The market encompasses various techniques used to evaluate the physical and mechanical properties of materials, including oil and gas industry applications for reservoir management and land-based drilling operations. Relevant testing methods include destructive and non-destructive approaches, such as thermal analysis, material testing for structural and mechanical properties, and non-destructive testing techniques. These assessments are crucial for industries like oil and gas, construction, and medical sectors, ensuring product quality, safety, and efficiency.
  • Market dynamics are influenced by factors such as the increasing demand for resource conservation and reducing wastage in the oil and gas industry, driven by fluctuating oil prices. Technological advancements in hybrid lightweight materials and the integration of non-destructive testing methods are also key trends shaping the market. The growing emphasis on enhancing operational efficiency and improving product quality across various industries further bolsters market growth.

How is this Production Testing Industry segmented and which is the largest segment?

The production testing industry research report provides comprehensive data (region-wise segment analysis), with forecasts and estimates in "USD million" for the period 2024-2028, as well as historical data from 2018-2022 for the following segments.

  • Application
    • Onshore
    • Offshore
  • Geography
    • North America
      • Canada
      • US
    • APAC
      • China
    • Middle East and Africa
    • Europe
    • South America

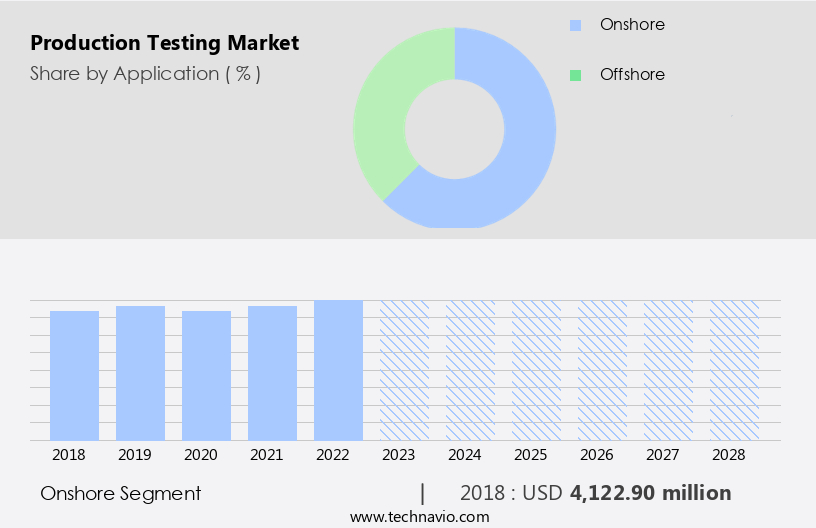
By Application Insights

  • The onshore segment is estimated to witness significant growth during the forecast period.

The market primarily focuses on assessing the performance and productivity of production wells, with onshore testing holding a significant market share. Onshore production testing is essential for reservoir management, production optimization, and capital discipline in the oil and gas industry. The demand for onshore production testing is driven by the vast onshore reserves, including shale reserves in the Permian Basin and deep-sea reserves. Onshore testing encompasses material testing, evaluating physical, structural, and mechanical properties, and employing advanced materials and techniques such as hybrid lightweight materials, thermal analysis, microscopy, destructive testing, and non-destructive testing.

The industrialization of sectors like construction and medicine necessitates the efficient use of resources, further fueling the demand for production testing. The market's growth is influenced by the increasing industrialization, the importance of oil prices, and the need for rapid testing methods.

Production Testing Market Size

Get a glance at the  Production Testing Industry report of share of various segments Request Free Sample

The onshore segment was valued at USD 4.12 billion in 2018 and showed a gradual increase during the forecast period.

Regional Analysis

  • APAC is estimated to contribute 34% to the growth of the global market during the forecast period.

Technavio's analysts have elaborately explained the regional trends and drivers that shape the market during the forecast period.

Production Testing Market Share by Geography

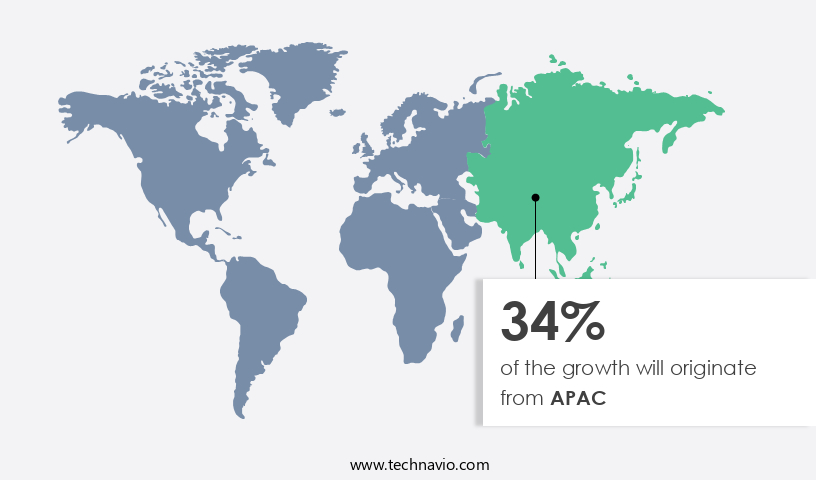
For more insights on the market share of various regions, Request Free Sample

The North American market is primarily driven by the significant increase in oil and gas production in the US and Canada, two major oil-producing countries in the region. Unconventional exploration and production (E&P) activities, such as the drilling of shale reserves in the US and oil sands in Canada, have led to a rise in production output. This trend is attributed to the rise in E&P activities in unconventional sources like shale and oil sands, which account for a substantial portion of the overall crude oil and natural gas production in North America. The market in the region is expected to grow due to the increasing demand for ensuring the optimal performance of production wells and the need for material testing of various components used in the oil and gas industry.

Key testing parameters include the physical and structural properties of reservoirs, the mechanical properties of materials, and the use of advanced materials and testing techniques such as thermal analysis, microscopy, destructive testing, and non-destructive testing. The market is further influenced by rapid industrialization in sectors like construction and medicine, as well as the need to reduce the wastage of resources and maintain capital discipline amidst fluctuating oil prices. 

Market Dynamics

Our researchers analyzed the data with 2023 as the base year, along with the key drivers, trends, and challenges. A holistic analysis of drivers will help companies refine their marketing strategies to gain a competitive advantage.

What are the key market drivers leading to the rise in the adoption of Production Testing Industry?

Rising global oil and gas consumption is the key driver of the market.

  • The market is experiencing significant growth due to the increasing demand for liquid fuels and the need for oil companies to discover new oil wells to meet this demand. According to the Energy Information Administration (EIA), global liquid fuel consumption reached 96.90 million barrels per day (mbpd) in 2018, up from 85.44 mbpd in 2009. With most oil-producing countries lacking sufficient storage capacities for crude oil, there is a pressing need for companies to explore new and existing oil fields to maintain supply. This trend is particularly evident in regions such as the Permian Basin in the US, where shale reserves and deep-sea reserves are being exploited.
  • The market is essential in ensuring the optimal performance of production wells by assessing the physical and structural properties of reservoirs, including material testing for mechanical properties, thermal analysis, and microscopy techniques. Moreover, the use of advanced materials, such as hybrid lightweight materials, is gaining popularity in various industries, including the construction sector and medical sector, further fueling the demand for production testing. Industrialization and the development of new trade routes are also contributing factors. Organizations, including research institutions and educational institutions, play a crucial role in advancing production testing technology through research and development. 

What are the market trends shaping the Production Testing Industry?

The rise in deepwater and ultra-deepwater E and P activities is the upcoming market trend.

  • The market encompasses various testing techniques employed by upstream oil and gas operators to optimize reservoir management and enhance production from oil and gas wells. This includes material testing of hybrid lightweight materials, thermal analysis, and microscopy techniques for assessing physical, structural, and mechanical properties. The focus on capital discipline and profitability has led oil and gas companies to explore deeper reserves, such as those in the Permian Basin and deep sea, where large shale reserves and offshore oil and gas deposits exist. The increase in oil prices and the rapid industrialization of sectors like construction and medicine have further boosted the demand for production testing.
  • Organizations set industry standards for testing methods, while research institutions and educational institutions contribute to the advancement of testing technologies. The market dynamics are influenced by factors like the type of test, industrialization, and trade routes. The market is witnessing significant growth due to the increasing importance of production optimization and the need to minimize wastage of resources. Non-destructive testing and destructive testing methods are employed to ensure the integrity of production wells and prevent costly downtime. The market is expected to continue growing as oil prices remain stable and companies seek to maximize their returns on investment.

What challenges does the Production Testing Industry face during its growth?

Change in energy mix is a key challenge affecting the industry growth.

  • The market encompasses various testing techniques and technologies used by oil and gas operators to ensure the optimal performance of production wells. This market caters to the assessment of material and physical properties, including structural and mechanical properties, of reservoirs in the Permian Basin, deep sea, and shale reserves. The adoption of advanced materials, such as hybrid lightweight materials, is on the rise due to the need for capital discipline and production optimization. Material testing plays a crucial role in determining the suitability of equipment and materials for oil and gas production. ASTM and ISO are renowned organizations that provide standardized testing methods and certifications.
  • Research organizations and educational institutions are also contributing significantly to the advancement of production testing through research and development. Industrialization in sectors like construction and medicine is driving the demand for production testing. Destructive and non-destructive testing techniques, such as thermal analysis and microscopy, are essential for evaluating the type of test required. The increasing industrialization and trade routes are further fueling the growth of the market. Despite the benefits of production testing, the wastage of resources due to low oil prices remains a challenge. The market dynamics are influenced by various factors, including technological advancements, regulatory frameworks, and market trends.

Exclusive Customer Landscape

The market forecasting report includes the adoption lifecycle of the market, covering from the innovator's stage to the laggard's stage. It focuses on adoption rates in different regions based on penetration. Furthermore, the production testing market report also includes key purchase criteria and drivers of price sensitivity to help companies evaluate and develop their market growth analysis strategies.

Production Testing Market Share by Geography

 Customer Landscape

Key Companies & Market Insights

Companies are implementing various strategies, such as strategic alliances, production testing market forecast, partnerships, mergers and acquisitions, geographical expansion, and product/service launches, to enhance their presence in the industry.

The industry research and growth report includes detailed analyses of the competitive landscape of the market and information about key companies, including:

  • Baker Hughes Co.
  • Expro Group Holdings NV
  • Fesco LTD.
  • Grant Production Testing Services Ltd
  • GREENE S ENERGY GROUP
  • Halliburton Co.
  • Hamdon Energy Solutions Ltd.
  • PROFLO Production Testing Ltd.
  • Roska DBO Inc.
  • Schlumberger Ltd.
  • Skyline Well Testing Inc.
  • TC Mobile vessels LTD
  • testwells Ltd.
  • TETRA Technologies Inc.
  • Weatherford International Plc
  • WELLMAX
  • Wespro Production Testing Ltd.

Qualitative and quantitative analysis of companies has been conducted to help clients understand the wider business environment as well as the strengths and weaknesses of key industry players. Data is qualitatively analyzed to categorize companies as pure play, category-focused, industry-focused, and diversified; it is quantitatively analyzed to categorize companies as dominant, leading, strong, tentative, and weak.

Research Analyst Overview

The market encompasses a range of services and technologies employed to evaluate the performance and integrity of equipment and systems used in the production of various industries. This market is driven by the need to ensure optimal production efficiency, reduce downtime, and maintain safety standards. Production testing plays a crucial role in industries where equipment failure can result in significant financial losses and potential safety hazards. In the context of industrialization, the increasing demand for advanced materials and technologies in sectors such as construction and medicine is driving growth in the market. One of the primary applications of production testing is in the energy sector, specifically in the management of reservoirs and optimization of production wells.

Moreover, the testing of physical and structural properties, such as mechanical strength and thermal conductivity, is essential to ensure the efficient extraction of resources from reservoirs. The use of hybrid lightweight materials in drilling and production equipment is also driving demand for advanced production testing techniques. The importance of production testing is not limited to the energy sector. In the manufacturing industry, for instance, the market is driven by the need to ensure the quality and reliability of products. This is particularly important in industries where safety is a critical concern, such as the medical sector. The market is characterized by a diverse range of testing techniques, including destructive and non-destructive methods.

Furthermore, thermal analysis and microscopy techniques are commonly used to evaluate the physical and structural properties of materials. The choice of testing method depends on various factors, including the nature of the material being tested and the specific requirements of the industry. The market is also influenced by broader market dynamics, such as rapid industrialization and the evolution of trade routes. The increasing demand for advanced materials and technologies is driving innovation in production testing methods and equipment. Additionally, the wastage of resources due to equipment failure or inefficiency is a significant concern, further emphasizing the importance of production testing in various industries.

Market Scope

Report Coverage

Details

Page number

138

Base year

2023

Historic period

2018-2022

Forecast period

2024-2028

Growth momentum & CAGR

Accelerate at a CAGR of 4.83%

Market Growth 2024-2028

USD 1.82 billion

Market structure

Fragmented

YoY growth 2023-2024(%)

4.37

Key countries

US, China, Canada, Saudi Arabia, and Russia

Competitive landscape

Leading Companies, Market Positioning of Companies, Competitive Strategies, and Industry Risks

Request Free Sample

What are the Key Data Covered in this Production Testing Market Research and Growth Report?

  • CAGR of the Production Testing industry during the forecast period
  • Detailed information on factors that will drive the market growth and forecasting between 2024 and 2028
  • Precise estimation of the size of the market and its contribution of the industry in focus to the parent market
  • Accurate predictions about upcoming growth and trends and changes in consumer behaviour
  • Growth of the market across North America, APAC, Middle East and Africa, Europe, and South America
  • A thorough analysis of the market's competitive landscape and detailed information about companies
  • Comprehensive analysis of factors that will challenge the production testing market growth of industry companies

We can help! Our analysts can customize this production testing market research report to meet your requirements.

Get in touch

1 Executive Summary

  • 1.1 Market overview
    • Executive Summary - Chart on Market Overview
    • Executive Summary - Data Table on Market Overview
    • Executive Summary - Chart on Global Market Characteristics
    • Executive Summary - Chart on Market by Geography
    • Executive Summary - Chart on Market Segmentation by Application
    • Executive Summary - Chart on Incremental Growth
    • Executive Summary - Data Table on Incremental Growth
    • Executive Summary - Chart on Company Market Positioning

2 Market Landscape

  • 2.1 Market ecosystem
    • Parent Market
    • Data Table on - Parent Market
  • 2.2 Market characteristics
    • Market characteristics analysis
  • 2.3 Value chain analysis
    • Value Chain Analysis

3 Market Sizing

  • 3.1 Market definition
    • Offerings of companies included in the market definition
  • 3.2 Market segment analysis
    • Market segments
  • 3.3 Market size 2023
    • 3.4 Market outlook: Forecast for 2023-2028
      • Chart on Global - Market size and forecast 2023-2028 ($ million)
      • Data Table on Global - Market size and forecast 2023-2028 ($ million)
      • Chart on Global Market: Year-over-year growth 2023-2028 (%)
      • Data Table on Global Market: Year-over-year growth 2023-2028 (%)

    4 Historic Market Size

    • 4.1 Global Production Testing Market 2018 - 2022
      • Historic Market Size - Data Table on Global Production Testing Market 2018 - 2022 ($ million)
    • 4.2 Application segment analysis 2018 - 2022
      • Historic Market Size - Application Segment 2018 - 2022 ($ million)
    • 4.3 Geography segment analysis 2018 - 2022
      • Historic Market Size - Geography Segment 2018 - 2022 ($ million)
    • 4.4 Country segment analysis 2018 - 2022
      • Historic Market Size - Country Segment 2018 - 2022 ($ million)

    5 Five Forces Analysis

    • 5.1 Five forces summary
      • Five forces analysis - Comparison between 2023 and 2028
    • 5.2 Bargaining power of buyers
      • Bargaining power of buyers - Impact of key factors 2023 and 2028
    • 5.3 Bargaining power of suppliers
      • Bargaining power of suppliers - Impact of key factors in 2023 and 2028
    • 5.4 Threat of new entrants
      • Threat of new entrants - Impact of key factors in 2023 and 2028
    • 5.5 Threat of substitutes
      • Threat of substitutes - Impact of key factors in 2023 and 2028
    • 5.6 Threat of rivalry
      • Threat of rivalry - Impact of key factors in 2023 and 2028
    • 5.7 Market condition
      • Chart on Market condition - Five forces 2023 and 2028

    6 Market Segmentation by Application

    • 6.1 Market segments
      • Chart on Application - Market share 2023-2028 (%)
      • Data Table on Application - Market share 2023-2028 (%)
    • 6.2 Comparison by Application
      • Chart on Comparison by Application
      • Data Table on Comparison by Application
    • 6.3 Onshore - Market size and forecast 2023-2028
      • Chart on Onshore - Market size and forecast 2023-2028 ($ million)
      • Data Table on Onshore - Market size and forecast 2023-2028 ($ million)
      • Chart on Onshore - Year-over-year growth 2023-2028 (%)
      • Data Table on Onshore - Year-over-year growth 2023-2028 (%)
    • 6.4 Offshore - Market size and forecast 2023-2028
      • Chart on Offshore - Market size and forecast 2023-2028 ($ million)
      • Data Table on Offshore - Market size and forecast 2023-2028 ($ million)
      • Chart on Offshore - Year-over-year growth 2023-2028 (%)
      • Data Table on Offshore - Year-over-year growth 2023-2028 (%)
    • 6.5 Market opportunity by Application
      • Market opportunity by Application ($ million)
      • Data Table on Market opportunity by Application ($ million)

    7 Customer Landscape

    • 7.1 Customer landscape overview
      • Analysis of price sensitivity, lifecycle, customer purchase basket, adoption rates, and purchase criteria

    8 Geographic Landscape

    • 8.1 Geographic segmentation
      • Chart on Market share by geography 2023-2028 (%)
      • Data Table on Market share by geography 2023-2028 (%)
    • 8.2 Geographic comparison
      • Chart on Geographic comparison
      • Data Table on Geographic comparison
    • 8.3 North America - Market size and forecast 2023-2028
      • Chart on North America - Market size and forecast 2023-2028 ($ million)
      • Data Table on North America - Market size and forecast 2023-2028 ($ million)
      • Chart on North America - Year-over-year growth 2023-2028 (%)
      • Data Table on North America - Year-over-year growth 2023-2028 (%)
    • 8.4 APAC - Market size and forecast 2023-2028
      • Chart on APAC - Market size and forecast 2023-2028 ($ million)
      • Data Table on APAC - Market size and forecast 2023-2028 ($ million)
      • Chart on APAC - Year-over-year growth 2023-2028 (%)
      • Data Table on APAC - Year-over-year growth 2023-2028 (%)
    • 8.5 Middle East and Africa - Market size and forecast 2023-2028
      • Chart on Middle East and Africa - Market size and forecast 2023-2028 ($ million)
      • Data Table on Middle East and Africa - Market size and forecast 2023-2028 ($ million)
      • Chart on Middle East and Africa - Year-over-year growth 2023-2028 (%)
      • Data Table on Middle East and Africa - Year-over-year growth 2023-2028 (%)
    • 8.6 Europe - Market size and forecast 2023-2028
      • Chart on Europe - Market size and forecast 2023-2028 ($ million)
      • Data Table on Europe - Market size and forecast 2023-2028 ($ million)
      • Chart on Europe - Year-over-year growth 2023-2028 (%)
      • Data Table on Europe - Year-over-year growth 2023-2028 (%)
    • 8.7 South America - Market size and forecast 2023-2028
      • Chart on South America - Market size and forecast 2023-2028 ($ million)
      • Data Table on South America - Market size and forecast 2023-2028 ($ million)
      • Chart on South America - Year-over-year growth 2023-2028 (%)
      • Data Table on South America - Year-over-year growth 2023-2028 (%)
    • 8.8 US - Market size and forecast 2023-2028
      • Chart on US - Market size and forecast 2023-2028 ($ million)
      • Data Table on US - Market size and forecast 2023-2028 ($ million)
      • Chart on US - Year-over-year growth 2023-2028 (%)
      • Data Table on US - Year-over-year growth 2023-2028 (%)
    • 8.9 China - Market size and forecast 2023-2028
      • Chart on China - Market size and forecast 2023-2028 ($ million)
      • Data Table on China - Market size and forecast 2023-2028 ($ million)
      • Chart on China - Year-over-year growth 2023-2028 (%)
      • Data Table on China - Year-over-year growth 2023-2028 (%)
    • 8.10 Canada - Market size and forecast 2023-2028
      • Chart on Canada - Market size and forecast 2023-2028 ($ million)
      • Data Table on Canada - Market size and forecast 2023-2028 ($ million)
      • Chart on Canada - Year-over-year growth 2023-2028 (%)
      • Data Table on Canada - Year-over-year growth 2023-2028 (%)
    • 8.11 Saudi Arabia - Market size and forecast 2023-2028
      • Chart on Saudi Arabia - Market size and forecast 2023-2028 ($ million)
      • Data Table on Saudi Arabia - Market size and forecast 2023-2028 ($ million)
      • Chart on Saudi Arabia - Year-over-year growth 2023-2028 (%)
      • Data Table on Saudi Arabia - Year-over-year growth 2023-2028 (%)
    • 8.12 Russia - Market size and forecast 2023-2028
      • Chart on Russia - Market size and forecast 2023-2028 ($ million)
      • Data Table on Russia - Market size and forecast 2023-2028 ($ million)
      • Chart on Russia - Year-over-year growth 2023-2028 (%)
      • Data Table on Russia - Year-over-year growth 2023-2028 (%)
    • 8.13 Market opportunity by geography
      • Market opportunity by geography ($ million)
      • Data Tables on Market opportunity by geography ($ million)

    9 Drivers, Challenges, and Opportunity/Restraints

    • 9.1 Market drivers
      • 9.2 Market challenges
        • 9.3 Impact of drivers and challenges
          • Impact of drivers and challenges in 2023 and 2028
        • 9.4 Market opportunities/restraints

          10 Competitive Landscape

          • 10.1 Overview
            • 10.2 Competitive Landscape
              • Overview on criticality of inputs and factors of differentiation
            • 10.3 Landscape disruption
              • Overview on factors of disruption
            • 10.4 Industry risks
              • Impact of key risks on business

            11 Competitive Analysis

            • 11.1 Companies profiled
              • Companies covered
            • 11.2 Market positioning of companies
              • Matrix on companies position and classification
            • 11.3 Baker Hughes Co.
              • Baker Hughes Co. - Overview
              • Baker Hughes Co. - Business segments
              • Baker Hughes Co. - Key news
              • Baker Hughes Co. - Key offerings
              • Baker Hughes Co. - Segment focus
            • 11.4 Expro Group Holdings NV
              • Expro Group Holdings NV - Overview
              • Expro Group Holdings NV - Business segments
              • Expro Group Holdings NV - Key offerings
              • Expro Group Holdings NV - Segment focus
            • 11.5 Fesco LTD.
              • Fesco LTD. - Overview
              • Fesco LTD. - Product / Service
              • Fesco LTD. - Key offerings
            • 11.6 Halliburton Co.
              • Halliburton Co. - Overview
              • Halliburton Co. - Business segments
              • Halliburton Co. - Key news
              • Halliburton Co. - Key offerings
              • Halliburton Co. - Segment focus
            • 11.7 Hamdon Energy Solutions Ltd.
              • Hamdon Energy Solutions Ltd. - Overview
              • Hamdon Energy Solutions Ltd. - Product / Service
              • Hamdon Energy Solutions Ltd. - Key offerings
            • 11.8 Roska DBO Inc.
              • Roska DBO Inc. - Overview
              • Roska DBO Inc. - Product / Service
              • Roska DBO Inc. - Key offerings
            • 11.9 Schlumberger Ltd.
              • Schlumberger Ltd. - Overview
              • Schlumberger Ltd. - Business segments
              • Schlumberger Ltd. - Key news
              • Schlumberger Ltd. - Key offerings
              • Schlumberger Ltd. - Segment focus
            • 11.10 testwells Ltd.
              • testwells Ltd. - Overview
              • testwells Ltd. - Product / Service
              • testwells Ltd. - Key offerings
            • 11.11 TETRA Technologies Inc.
              • TETRA Technologies Inc. - Overview
              • TETRA Technologies Inc. - Business segments
              • TETRA Technologies Inc. - Key offerings
              • TETRA Technologies Inc. - Segment focus
            • 11.12 Weatherford International Plc
              • Weatherford International Plc - Overview
              • Weatherford International Plc - Business segments
              • Weatherford International Plc - Key news
              • Weatherford International Plc - Key offerings
              • Weatherford International Plc - Segment focus

            12 Appendix

            • 12.1 Scope of the report
              • 12.2 Inclusions and exclusions checklist
                • Inclusions checklist
                • Exclusions checklist
              • 12.3 Currency conversion rates for US$
                • Currency conversion rates for US$
              • 12.4 Research methodology
                • Research methodology
              • 12.5 Data procurement
                • Information sources
              • 12.6 Data validation
                • Data validation
              • 12.7 Validation techniques employed for market sizing
                • Validation techniques employed for market sizing
              • 12.8 Data synthesis
                • Data synthesis
              • 12.9 360 degree market analysis
                • 360 degree market analysis
              • 12.10 List of abbreviations
                • List of abbreviations

              Research Methodology

              Technavio presents a detailed picture of the market by way of study, synthesis, and summation of data from multiple sources. The analysts have presented the various facets of the market with a particular focus on identifying the key industry influencers. The data thus presented is comprehensive, reliable, and the result of extensive research, both primary and secondary.

              INFORMATION SOURCES

              Primary sources

              • Manufacturers and suppliers
              • Channel partners
              • Industry experts
              • Strategic decision makers

              Secondary sources

              • Industry journals and periodicals
              • Government data
              • Financial reports of key industry players
              • Historical data
              • Press releases

              DATA ANALYSIS

              Data Synthesis

              • Collation of data
              • Estimation of key figures
              • Analysis of derived insights

              Data Validation

              • Triangulation with data models
              • Reference against proprietary databases
              • Corroboration with industry experts

              REPORT WRITING

              Qualitative

              • Market drivers
              • Market challenges
              • Market trends
              • Five forces analysis

              Quantitative

              • Market size and forecast
              • Market segmentation
              • Geographical insights
              • Competitive landscape

              Interested in this report?

              Get your sample now to see our research methodology and insights!

              Download Now

              Frequently Asked Questions

              Production Testing market growth will increase by $ 1811.6 mn during 2024-2028.

              The Production Testing market is expected to grow at a CAGR of 4.83% during 2024-2028.

              Production Testing market is segmented by Application( Onshore, Offshore)

              Baker Hughes Co., Expro Group Holdings NV, Fesco LTD., Grant Production Testing Services Ltd, GREENE S ENERGY GROUP, Halliburton Co., Hamdon Energy Solutions Ltd., PROFLO Production Testing Ltd., Roska DBO Inc., Schlumberger Ltd., Skyline Well Testing Inc., TC Mobile vessels LTD, testwells Ltd., TETRA Technologies Inc., Weatherford International Plc, WELLMAX, Wespro Production Testing Ltd. are a few of the key vendors in the Production Testing market.

              APAC will register the highest growth rate of 34% among the other regions. Therefore, the Production Testing market in APAC is expected to garner significant business opportunities for the vendors during the forecast period.

              US, China, Canada, Saudi Arabia, Russia

              • Rising global oil and gas consumptionAs per the EIA is the driving factor this market.
              • the global liquid fuel consumption increased to 96.90 mbpd in 2018 is the driving factor this market.
              • which was 85.44 mbpd in 2009 is the driving factor this market.
              • and it is expected to grow at a high rate during the forecast period. Most oil-producing countries do not have extra storage capacities for crude oil. Hence is the driving factor this market.
              • to meet the increasing demand for fuel is the driving factor this market.
              • oil companies need to discover greenfield oil wells in the new and existing oil fields. This is likely to drive the growth of the global production testing market during the forecast period. The demand for fuel is rising in developing economies such as China and India. Rising industrialization and urbanization are attributed to the increased requirement for crude oil in the region. Also is the driving factor this market.
              • the rapid growth in mobility services such as Didi Chuxing and Uber is increasing fuel consumption. The smartphone application-based ride services vastly improved mobility in the countries such as India and China. The growth in such mobility services is likely to increase the demand for fuel in the region is the driving factor this market.
              • which requires more production from oil and gas companies. Such factors drive the growth of the global production testing market during the forecast period. is the driving factor this market.

              The Production Testing market vendors should focus on grabbing business opportunities from the Onshore segment as it accounted for the largest market share in the base year.