Printed Signage Market Analysis APAC, North America, Europe, South America, Middle East and Africa - US, China, Japan, UK, Germany - Size and Forecast 2024-2028

Printed Signage Market Analysis APAC, North America, Europe, South America, Middle East and Africa - US, China, Japan, UK, Germany - Size and Forecast 2024-2028

Published: Jun 2024 173 Pages SKU: IRTNTR75063

Market Overview at a Glance

$4.65 B
Market Opportunity
2.06%
CAGR
2.02
YoY growth 2023-2024(%)

Printed Signage Market Size 2024-2028

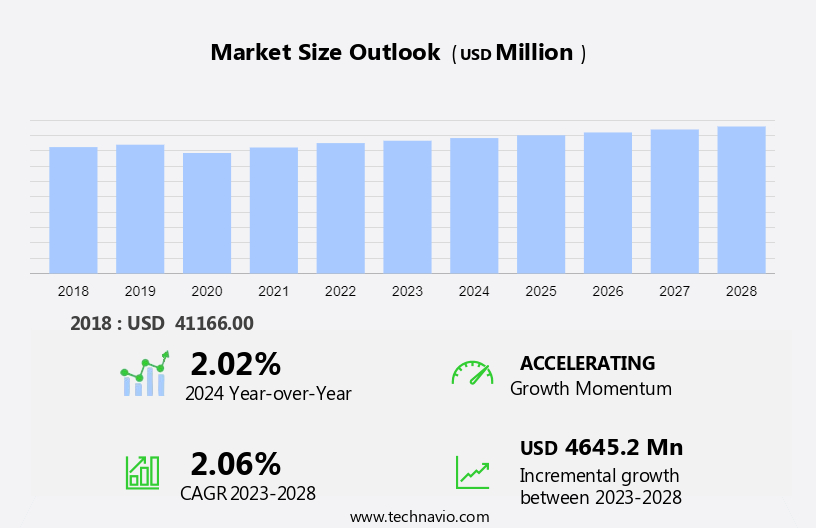
The printed signage market size is forecast to increase by USD 4.65 billion at a CAGR of 2.06% between 2023 and 2028.

  • The market is experiencing significant growth, driven by various factors. One key trend is the increasing adoption of digital signage in outdoor advertising, particularly in sectors such as retail and BFSI, due to its ability to deliver dynamic and targeted content. Another trend is the use of reflective materials for enhanced visibility in construction sites and transportation applications. 
  • Additionally, the e-commerce sector's surge has led to a higher demand for labels and display signage. In terms of materials, plywood and aluminum continue to be popular choices, while polypropylene is gaining traction due to its durability and cost-effectiveness. Logistics challenges remain a concern, as efficient delivery and installation are crucial for businesses to maximize the impact of their signage investments.
  • Overall, the market for printed signage is poised for continued growth, driven by these trends and the enduring demand for effective and visually appealing signage solutions.

What will be the Size of the Printed Signage Market During the Forecast Period?

Printed Signage Market Size

 Request Free Sample

  • The market encompasses a diverse range of products, including billboards, backlit displays, posters, banners, backdrops, pop up displays, graphics, and signage for retail stores and shopping malls. This market is experiencing robust growth, driven by increasing demand for eye-catching, cost-effective marketing and advertising solutions. Large format printing technology, such as Softjet Grand and Kornit Digital, plays a significant role in producing high-quality, customized signage for various industries. Moreover, the integration of digital signage and e-commerce platforms is expanding the market's reach and potential for economies of scale. The retail sector, in particular, is a key contributor to the market's growth, with retailers seeking to enhance brand identity and attract customers through visually appealing signage.
  • Strategic factories and media expos showcase the latest advancements in print equipment sales, enabling businesses to stay informed about the latest trends and technologies. Despite the increasing popularity of digital signage, traditional signage solutions, such as posters and banners, continue to hold a strong presence in the market due to their cost-effectiveness and versatility. Maintenance costs and sustainability concerns are also influencing the market, with a growing emphasis on using eco-friendly materials and energy-efficient technologies. 

How is this Printed Signage Industry segmented and which is the largest segment?

The printed signage industry research report provides comprehensive data (region-wise segment analysis), with forecasts and estimates in "USD billion" for the period 2024-2028, as well as historical data from 2018-2022 for the following segments.

  • Application
    • Outdoor
    • Indoor
  • End-user
    • Retail
    • BFSI
    • Transportation and logistics
    • Healthcare
    • Others
  • Geography
    • APAC
      • China
      • Japan
    • North America
      • US
    • Europe
      • Germany
      • UK
    • South America
    • Middle East and Africa

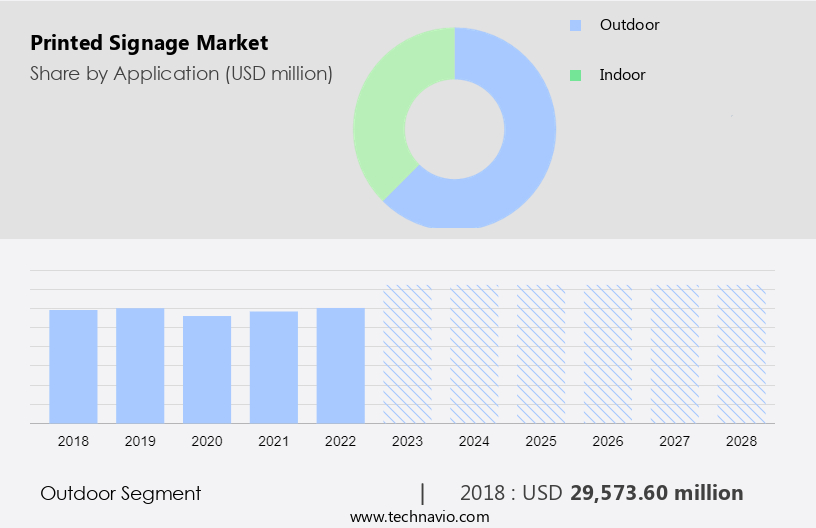
By Application Insights

The outdoor segment is estimated to witness significant growth during the forecast period. Outdoor printed signage plays a significant role in marketing and advertising, encompassing applications such as billboards, retail displays, wayfinding signs, and traffic signs. Advanced printing technologies and durable materials, including PVC, wood, polypropylene, and plywood, are utilized to create visually striking, weather-resistant displays. These signs serve multiple purposes: providing essential company information, making a good first impression, and promoting sales and specials to increase foot traffic. Outdoor signage is an extension of a company's brand identity and can effectively capture and maintain audience attention in various industries, including retail, transportation and logistics, healthcare, and more. Companies offer print equipment and solutions for creating high-quality outdoor signage. Economies of scale and cost-effectiveness make printed signage a popular choice for businesses looking to maximize their marketing efforts.

Printed Signage Market Size

Get a glance at the market report of various segments. Request Free Sample

The Outdoor segment was valued at USD 29.57 billion in 2018 and showed a gradual increase during the forecast period.

Regional Analysis

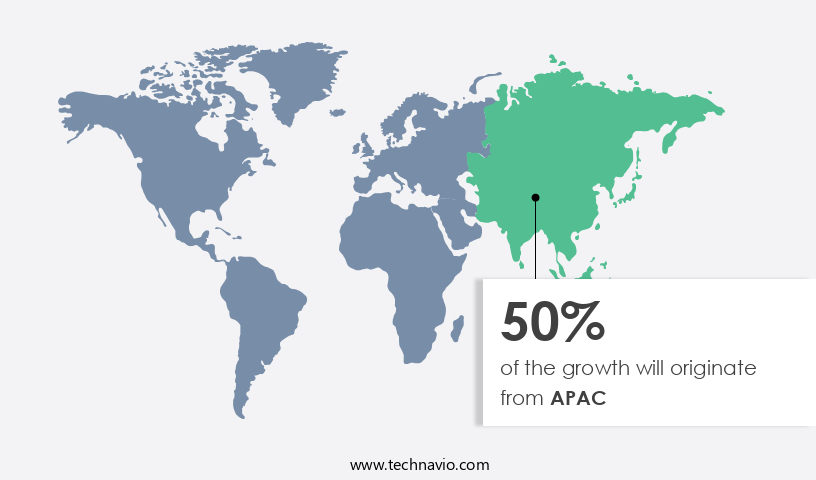
APAC is estimated to contribute 50% to the growth of the global market during the forecast period. Technavio's analysts have elaborately explained the regional trends and drivers that shape the market during the forecast period.

Printed Signage Market Share by Geography

For more insights on the market size of various regions, Request Free Sample

The market in APAC is experiencing significant growth due to the increasing demand for marketing and branding applications. Retailers in countries such as China, South Korea, Thailand, Singapore, and India are focusing on enhancing customer experiences, driving the need for high-quality printed signage. The region's expansion of commercial retail space is a key factor fueling market growth. In India, the Printed Signage Industry has undergone substantial transformation over the past decade. Adapting to changing times and demands, the industry has evolved in all aspects, from sourcing to manufacturing and end-product development. Key trends include the use of advanced technologies such as Large Format Printing, Digital Signage, and Indoor/Outdoor Signage. Economies of scale and cost-effectiveness are critical factors influencing market growth. Materials used include PVC, wood, polypropylene, and marine plywood. Industry players are focusing on acquisitions and mergers to expand their offerings and gain a competitive edge.

Market Dynamics

Our researchers analyzed the data with 2023 as the base year, along with the key drivers, trends, and challenges. A holistic analysis of drivers will help companies refine their marketing strategies to gain a competitive advantage.

What are the key market drivers leading to the rise In the adoption of Printed Signage Industry?

  • Several benefits of using printed signage is the key driver of the market.The market is experiencing notable growth due to its numerous benefits for various industries. One of the primary reasons for its popularity is its affordability. Compared to other advertising methods, printed signage offers an economical solution for businesses to disseminate their messages on a large scale. This cost-effective marketing strategy allows companies to allocate their resources towards other essential business needs. Moreover, printed signage is an effective tool for attracting consumers. It is versatile and can be used in various applications, including billboards, backlit displays, retail signage, and digital signage. The use of high-quality graphics, PVC (Polyvinyl Chloride), wood, Polypropylene, and other materials ensures that the signs are visually appealing and grab the attention of potential customers.

    Printed signage is also used extensively In the retail sector, shopping malls, and retail stores. It is an essential component of corporate graphics, exhibitions, and trade shows. In addition, printed signage is used in transportation and logistics, healthcare, and industrial settings. Maintenance costs for printed signage are relatively low compared to other advertising methods. Signs made from durable materials like PVC, wood, Polypropylene, and Marine plywood can last for years with minimal maintenance. Furthermore, printed signage is available in various types, including banners, backdrops, pop-up displays, and posters. Printed signage is also used for informative signs, promotional signage, and brand identity.

    It is an essential tool for businesses looking to create a strong brand image and reach a wider audience. Companies can also choose from a range of printed signage applications, including indoor and outdoor signage, and various industries, including healthcare, transportation, and logistics. Industrial tapes and reflective materials are used to enhance the durability and visibility of printed signage. AR displays and screen printing technologies are also used to create interactive and engaging signage. Print equipment sales are increasing due to the cost-effectiveness and versatility of printed signage. In conclusion, the market is growing due to its numerous benefits, including affordability, versatility, and effectiveness in attracting consumers.

    It is a cost-effective marketing strategy that is widely used in various industries and applications. The use of high-quality materials, advanced printing technologies, and innovative design solutions ensures that printed signage remains a popular choice for businesses looking to create a strong brand image and reach a wider audience.

What are the market trends shaping the Printed Signage market?

  • Growing demand for printed signage in BFSI sector is the upcoming market trend.The market encompasses various applications withIn the retail and BFSI sectors. In retail, signage types include billboards, backlit displays, large format printing, digital signage, and pop-up displays. For the BFSI sector, signage is utilized at ATMs (posters, banners, backdrops), interiors (wall graphics, wall projections), and exteriors. The increasing investment in marketing and advertising is driving the demand for cost-effective printed signage solutions, which offer a longer lifespan compared to digital alternatives. Key elements of the market include PVC (Polyvinyl Chloride), wood, polypropylene, marine plywood, oak, and birch plywood. Industrial tapes, reflective materials, and traffic signs are also essential components.

    Economies of scale and advancements in print equipment sales, such as Screen Inkjet, Sheetfed, and Indoor/Outdoor technology, contribute to the market's growth. Additionally, printed signage finds applications in transportation and logistics, healthcare, and exhibitions and trade shows. Companies like Astra Signs, Durst, Vanguard, and Kornit Digital are leading players In the market, offering a range of printed signage solutions.

What challenges does the Printed Signage Industry face during its growth?

  • Growing use of digital signage is a key challenge affecting the industry growth.The market encompasses various types and verticals, including Billboards, Backlit displays, Large format printing, Digital signage, Retail signage, and more. Global governments and businesses increasingly utilize printed signage for marketing and advertising purposes, with applications ranging from retail sectors to transportation and logistics, healthcare, and exhibitions and trade shows. Strategic acquisitions and mergers among industry players, such as Astra Signs, Durst, Vanguard, and Kornit Digital, have driven economies of scale and cost effectiveness. Digital outdoor advertising, a segment of the market, offers enterprises the flexibility to target specific customer groups based on time and weather conditions. For instance, an ice cream parlor can display ads when temperatures rise, or a stationery shop can advertise during school hours.

    Moreover, digital displays can be connected to customers' mobile devices, directing them to enterprises' social media accounts or websites. Additionally, printed signage comes in various materials, such as PVC (Polyvinyl Chloride), Wood, Polypropylene, Marine plywood, Oak, and Birch plywood, catering to diverse industries and applications. Indoor signage, such as Pop-up displays, Graphics, and Posters, and outdoor signage, including Backdrops, Banners, and Traffic signs, are essential for brand identity and informative purposes. Industrial tapes and reflective materials ensure the durability and safety of these signs, while AR displays and Screen printing technologies offer innovative solutions for the market.

Exclusive Customer Landscape

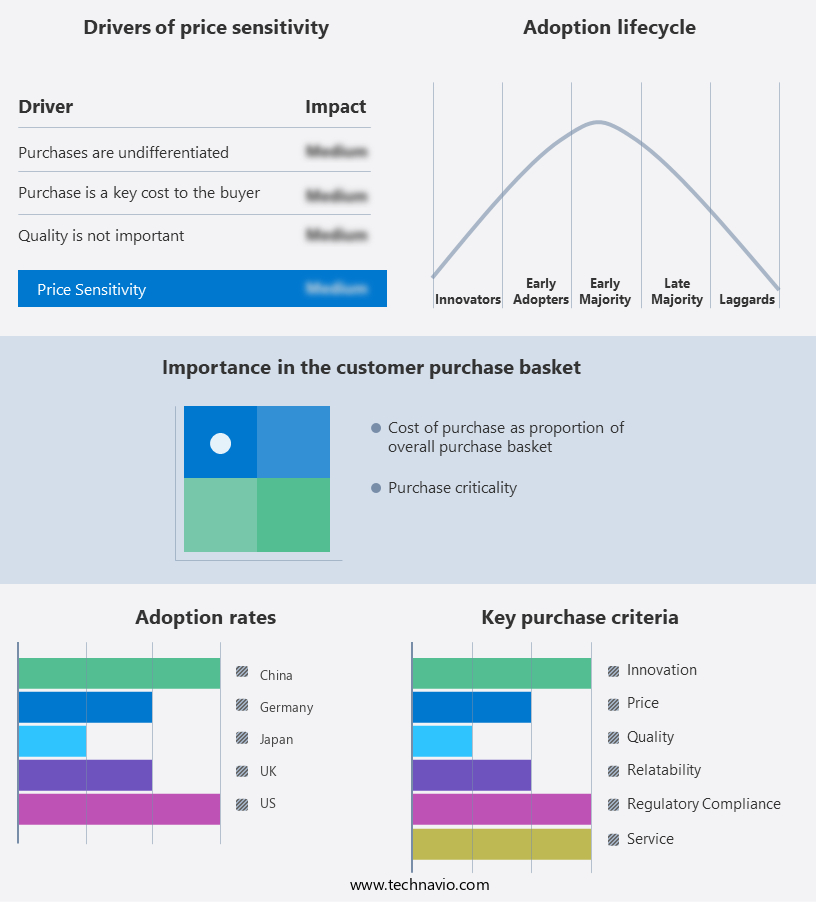
The printed signage market forecasting report includes the adoption lifecycle of the market, covering from the innovator's stage to the laggard's stage. It focuses on adoption rates in different regions based on penetration. Furthermore, the printed signage market report also includes key purchase criteria and drivers of price sensitivity to help companies evaluate and develop their market growth analysis strategies.

Printed Signage Market Share by Geography

 Customer Landscape

Key Companies & Market Insights

Companies are implementing various strategies, such as strategic alliances, printed signage market forecast, partnerships, mergers and acquisitions, geographical expansion, and product/service launches, to enhance their presence in the industry.

The industry research and growth report includes detailed analyses of the competitive landscape of the market and information about key companies, including:

  • Avery Dennison Corp.
  • Canva Pty Ltd.
  • Chandler Signs LLC
  • Cimpress Plc
  • EhKo Sign Industries Kft.
  • IGEPA group GmbH and Co. KG
  • James Publishing
  • Kelly Signs
  • L and H Companies
  • LINTEC Corp.
  • Mativ Holdings Inc.
  • ORAFOL Europe GmbH
  • Paddock Printing
  • Schweiter Technologies AG
  • Sign Solutions USA
  • Signage US
  • Signs Express
  • SmartSign
  • Spandex Ltd.
  • Techprint Inc.

Qualitative and quantitative analysis of companies has been conducted to help clients understand the wider business environment as well as the strengths and weaknesses of key industry players. Data is qualitatively analyzed to categorize companies as pure play, category-focused, industry-focused, and diversified; it is quantitatively analyzed to categorize companies as dominant, leading, strong, tentative, and weak.

Research Analyst Overview

The market encompasses a diverse range of visual communication solutions, including billboards, backlit displays, and strategic factory signage. This sector caters to various industries, such as retail, transportation and logistics, healthcare, and exhibitions and trade shows. Large format printing plays a pivotal role in producing high-impact signage, with technologies like digital signage, screen printing, and inkjet printing leading the charge. The market for printed signage is driven by several factors. Firstly, the growing importance of marketing and advertising in today's competitive business landscape necessitates eye-catching visuals to attract and retain customer attention. Secondly, the need for cost-effective brand identity solutions has led businesses to explore various printed signage types, such as posters, banners, backdrops, pop-up displays, and graphics.

Moreover, the advent of e-commerce has expanded the scope of printed signage applications beyond traditional retail settings. For instance, in logistics and transportation, companies use printed signage to ensure vehicle conspicuity and personal safety. In the healthcare sector, informative signs are essential for wayfinding and patient safety. The market is characterized by continuous innovation, with companies investing in research and development to create new products and improve existing ones. For example, the use of PVC (polyvinyl chloride), wood, polypropylene, marine plywood, and oak in signage production has led to increased durability and versatility. Additionally, the integration of reflective materials and industrial tapes enhances the functionality and safety of printed signage.

The market for printed signage is also influenced by industry trends, such as the increasing popularity of digital signage and the adoption of AR (augmented reality) displays. Mergers and acquisitions, such as those involving Astra Signs, Durst, and Vanguard, have led to consolidation and economies of scale withIn the industry. In conclusion, the market is a dynamic and evolving industry that caters to various sectors and applications. The demand for cost-effective, durable, and innovative visual communication solutions continues to drive growth and innovation within this sector.

Market Scope

Report Coverage

Details

Page number

173

Base year

2023

Historic period

2018-2022

Forecast period

2024-2028

Growth momentum & CAGR

Accelerate at a CAGR of 2.06%

Market growth 2024-2028

USD 4.65 billion

Market structure

Fragmented

YoY growth 2023-2024(%)

2.02

Key countries

US, China, Japan, UK, and Germany

Competitive landscape

Leading Companies, Market Positioning of Companies, Competitive Strategies, and Industry Risks

Request Free Sample

What are the Key Data Covered in this Printed Signage Market Research and Growth Report?

  • CAGR of the Printed Signage industry during the forecast period
  • Detailed information on factors that will drive the growth and forecasting between 2024 and 2028
  • Precise estimation of the size of the market and its contribution of the industry in focus to the parent market
  • Accurate predictions about upcoming growth and trends and changes in consumer behaviour
  • Growth of the market across APAC, North America, Europe, South America, and Middle East and Africa
  • Thorough analysis of the market's competitive landscape and detailed information about companies
  • Comprehensive analysis of factors that will challenge the printed signage market growth of industry companies

We can help! Our analysts can customize this printed signage market research report to meet your requirements.

Get in touch

1 Executive Summary

  • 1.1 Market overview
    • Executive Summary - Chart on Market Overview
    • Executive Summary - Data Table on Market Overview
    • Executive Summary - Chart on Global Market Characteristics
    • Executive Summary - Chart on Market by Geography
    • Executive Summary - Chart on Market Segmentation by Application
    • Executive Summary - Chart on Market Segmentation by End-user
    • Executive Summary - Chart on Incremental Growth
    • Executive Summary - Data Table on Incremental Growth
    • Executive Summary - Chart on Company Market Positioning

2 Market Landscape

  • 2.1 Market ecosystem
    • Parent Market
    • Data Table on - Parent Market
  • 2.2 Market characteristics
    • Market characteristics analysis
  • 2.3 Value chain analysis
    • Value Chain Analysis

3 Market Sizing

  • 3.1 Market definition
    • Offerings of companies included in the market definition
  • 3.2 Market segment analysis
    • Market segments
  • 3.3 Market size 2023
    • 3.4 Market outlook: Forecast for 2023-2028
      • Chart on Global - Market size and forecast 2023-2028 ($ million)
      • Data Table on Global - Market size and forecast 2023-2028 ($ million)
      • Chart on Global Market: Year-over-year growth 2023-2028 (%)
      • Data Table on Global Market: Year-over-year growth 2023-2028 (%)

    4 Historic Market Size

    • 4.1 Global Printed Signage Market 2018 - 2022
      • Historic Market Size - Data Table on Global Printed Signage Market 2018 - 2022 ($ million)
    • 4.2 Application segment analysis 2018 - 2022
      • Historic Market Size - Application Segment 2018 - 2022 ($ million)
    • 4.3 End-user segment analysis 2018 - 2022
      • Historic Market Size - End-user Segment 2018 - 2022 ($ million)
    • 4.4 Geography segment analysis 2018 - 2022
      • Historic Market Size - Geography Segment 2018 - 2022 ($ million)
    • 4.5 Country segment analysis 2018 - 2022
      • Historic Market Size - Country Segment 2018 - 2022 ($ million)

    5 Five Forces Analysis

    • 5.1 Five forces summary
      • Five forces analysis - Comparison between 2023 and 2028
    • 5.2 Bargaining power of buyers
      • Bargaining power of buyers - Impact of key factors 2023 and 2028
    • 5.3 Bargaining power of suppliers
      • Bargaining power of suppliers - Impact of key factors in 2023 and 2028
    • 5.4 Threat of new entrants
      • Threat of new entrants - Impact of key factors in 2023 and 2028
    • 5.5 Threat of substitutes
      • Threat of substitutes - Impact of key factors in 2023 and 2028
    • 5.6 Threat of rivalry
      • Threat of rivalry - Impact of key factors in 2023 and 2028
    • 5.7 Market condition
      • Chart on Market condition - Five forces 2023 and 2028

    6 Market Segmentation by Application

    • 6.1 Market segments
      • Chart on Application - Market share 2023-2028 (%)
      • Data Table on Application - Market share 2023-2028 (%)
    • 6.2 Comparison by Application
      • Chart on Comparison by Application
      • Data Table on Comparison by Application
    • 6.3 Outdoor - Market size and forecast 2023-2028
      • Chart on Outdoor - Market size and forecast 2023-2028 ($ million)
      • Data Table on Outdoor - Market size and forecast 2023-2028 ($ million)
      • Chart on Outdoor - Year-over-year growth 2023-2028 (%)
      • Data Table on Outdoor - Year-over-year growth 2023-2028 (%)
    • 6.4 Indoor - Market size and forecast 2023-2028
      • Chart on Indoor - Market size and forecast 2023-2028 ($ million)
      • Data Table on Indoor - Market size and forecast 2023-2028 ($ million)
      • Chart on Indoor - Year-over-year growth 2023-2028 (%)
      • Data Table on Indoor - Year-over-year growth 2023-2028 (%)
    • 6.5 Market opportunity by Application
      • Market opportunity by Application ($ million)
      • Data Table on Market opportunity by Application ($ million)

    7 Market Segmentation by End-user

    • 7.1 Market segments
      • Chart on End-user - Market share 2023-2028 (%)
      • Data Table on End-user - Market share 2023-2028 (%)
    • 7.2 Comparison by End-user
      • Chart on Comparison by End-user
      • Data Table on Comparison by End-user
    • 7.3 Retail - Market size and forecast 2023-2028
      • Chart on Retail - Market size and forecast 2023-2028 ($ million)
      • Data Table on Retail - Market size and forecast 2023-2028 ($ million)
      • Chart on Retail - Year-over-year growth 2023-2028 (%)
      • Data Table on Retail - Year-over-year growth 2023-2028 (%)
    • 7.4 BFSI - Market size and forecast 2023-2028
      • Chart on BFSI - Market size and forecast 2023-2028 ($ million)
      • Data Table on BFSI - Market size and forecast 2023-2028 ($ million)
      • Chart on BFSI - Year-over-year growth 2023-2028 (%)
      • Data Table on BFSI - Year-over-year growth 2023-2028 (%)
    • 7.5 Transportation and logistics - Market size and forecast 2023-2028
      • Chart on Transportation and logistics - Market size and forecast 2023-2028 ($ million)
      • Data Table on Transportation and logistics - Market size and forecast 2023-2028 ($ million)
      • Chart on Transportation and logistics - Year-over-year growth 2023-2028 (%)
      • Data Table on Transportation and logistics - Year-over-year growth 2023-2028 (%)
    • 7.6 Healthcare - Market size and forecast 2023-2028
      • Chart on Healthcare - Market size and forecast 2023-2028 ($ million)
      • Data Table on Healthcare - Market size and forecast 2023-2028 ($ million)
      • Chart on Healthcare - Year-over-year growth 2023-2028 (%)
      • Data Table on Healthcare - Year-over-year growth 2023-2028 (%)
    • 7.7 Others - Market size and forecast 2023-2028
      • Chart on Others - Market size and forecast 2023-2028 ($ million)
      • Data Table on Others - Market size and forecast 2023-2028 ($ million)
      • Chart on Others - Year-over-year growth 2023-2028 (%)
      • Data Table on Others - Year-over-year growth 2023-2028 (%)
    • 7.8 Market opportunity by End-user
      • Market opportunity by End-user ($ million)
      • Data Table on Market opportunity by End-user ($ million)

    8 Customer Landscape

    • 8.1 Customer landscape overview
      • Analysis of price sensitivity, lifecycle, customer purchase basket, adoption rates, and purchase criteria

    9 Geographic Landscape

    • 9.1 Geographic segmentation
      • Chart on Market share by geography 2023-2028 (%)
      • Data Table on Market share by geography 2023-2028 (%)
    • 9.2 Geographic comparison
      • Chart on Geographic comparison
      • Data Table on Geographic comparison
    • 9.3 APAC - Market size and forecast 2023-2028
      • Chart on APAC - Market size and forecast 2023-2028 ($ million)
      • Data Table on APAC - Market size and forecast 2023-2028 ($ million)
      • Chart on APAC - Year-over-year growth 2023-2028 (%)
      • Data Table on APAC - Year-over-year growth 2023-2028 (%)
    • 9.4 North America - Market size and forecast 2023-2028
      • Chart on North America - Market size and forecast 2023-2028 ($ million)
      • Data Table on North America - Market size and forecast 2023-2028 ($ million)
      • Chart on North America - Year-over-year growth 2023-2028 (%)
      • Data Table on North America - Year-over-year growth 2023-2028 (%)
    • 9.5 Europe - Market size and forecast 2023-2028
      • Chart on Europe - Market size and forecast 2023-2028 ($ million)
      • Data Table on Europe - Market size and forecast 2023-2028 ($ million)
      • Chart on Europe - Year-over-year growth 2023-2028 (%)
      • Data Table on Europe - Year-over-year growth 2023-2028 (%)
    • 9.6 South America - Market size and forecast 2023-2028
      • Chart on South America - Market size and forecast 2023-2028 ($ million)
      • Data Table on South America - Market size and forecast 2023-2028 ($ million)
      • Chart on South America - Year-over-year growth 2023-2028 (%)
      • Data Table on South America - Year-over-year growth 2023-2028 (%)
    • 9.7 Middle East and Africa - Market size and forecast 2023-2028
      • Chart on Middle East and Africa - Market size and forecast 2023-2028 ($ million)
      • Data Table on Middle East and Africa - Market size and forecast 2023-2028 ($ million)
      • Chart on Middle East and Africa - Year-over-year growth 2023-2028 (%)
      • Data Table on Middle East and Africa - Year-over-year growth 2023-2028 (%)
    • 9.8 US - Market size and forecast 2023-2028
      • Chart on US - Market size and forecast 2023-2028 ($ million)
      • Data Table on US - Market size and forecast 2023-2028 ($ million)
      • Chart on US - Year-over-year growth 2023-2028 (%)
      • Data Table on US - Year-over-year growth 2023-2028 (%)
    • 9.9 China - Market size and forecast 2023-2028
      • Chart on China - Market size and forecast 2023-2028 ($ million)
      • Data Table on China - Market size and forecast 2023-2028 ($ million)
      • Chart on China - Year-over-year growth 2023-2028 (%)
      • Data Table on China - Year-over-year growth 2023-2028 (%)
    • 9.10 Japan - Market size and forecast 2023-2028
      • Chart on Japan - Market size and forecast 2023-2028 ($ million)
      • Data Table on Japan - Market size and forecast 2023-2028 ($ million)
      • Chart on Japan - Year-over-year growth 2023-2028 (%)
      • Data Table on Japan - Year-over-year growth 2023-2028 (%)
    • 9.11 UK - Market size and forecast 2023-2028
      • Chart on UK - Market size and forecast 2023-2028 ($ million)
      • Data Table on UK - Market size and forecast 2023-2028 ($ million)
      • Chart on UK - Year-over-year growth 2023-2028 (%)
      • Data Table on UK - Year-over-year growth 2023-2028 (%)
    • 9.12 Germany - Market size and forecast 2023-2028
      • Chart on Germany - Market size and forecast 2023-2028 ($ million)
      • Data Table on Germany - Market size and forecast 2023-2028 ($ million)
      • Chart on Germany - Year-over-year growth 2023-2028 (%)
      • Data Table on Germany - Year-over-year growth 2023-2028 (%)
    • 9.13 Market opportunity by geography
      • Market opportunity by geography ($ million)
      • Data Tables on Market opportunity by geography ($ million)

    10 Drivers, Challenges, and Opportunity/Restraints

    • 10.1 Market drivers
      • 10.2 Market challenges
        • 10.3 Impact of drivers and challenges
          • Impact of drivers and challenges in 2023 and 2028
        • 10.4 Market opportunities/restraints

          11 Competitive Landscape

          • 11.1 Overview
            • 11.2 Competitive Landscape
              • Overview on criticality of inputs and factors of differentiation
            • 11.3 Landscape disruption
              • Overview on factors of disruption
            • 11.4 Industry risks
              • Impact of key risks on business

            12 Competitive Analysis

            • 12.1 Companies profiled
              • Companies covered
            • 12.2 Market positioning of companies
              • Matrix on companies position and classification
            • 12.3 Avery Dennison Corp.
              • Avery Dennison Corp. - Overview
              • Avery Dennison Corp. - Business segments
              • Avery Dennison Corp. - Key news
              • Avery Dennison Corp. - Key offerings
              • Avery Dennison Corp. - Segment focus
            • 12.4 Canva Pty Ltd.
              • Canva Pty Ltd. - Overview
              • Canva Pty Ltd. - Product / Service
              • Canva Pty Ltd. - Key offerings
            • 12.5 EhKo Sign Industries Kft.
              • EhKo Sign Industries Kft. - Overview
              • EhKo Sign Industries Kft. - Product / Service
              • EhKo Sign Industries Kft. - Key offerings
            • 12.6 IGEPA group GmbH and Co. KG
              • IGEPA group GmbH and Co. KG - Overview
              • IGEPA group GmbH and Co. KG - Product / Service
              • IGEPA group GmbH and Co. KG - Key offerings
            • 12.7 Kelly Signs
              • Kelly Signs - Overview
              • Kelly Signs - Product / Service
              • Kelly Signs - Key offerings
            • 12.8 L and H Companies
              • L and H Companies - Overview
              • L and H Companies - Product / Service
              • L and H Companies - Key offerings
            • 12.9 LINTEC Corp.
              • LINTEC Corp. - Overview
              • LINTEC Corp. - Business segments
              • LINTEC Corp. - Key news
              • LINTEC Corp. - Key offerings
              • LINTEC Corp. - Segment focus
            • 12.10 Mativ Holdings Inc.
              • Mativ Holdings Inc. - Overview
              • Mativ Holdings Inc. - Business segments
              • Mativ Holdings Inc. - Key offerings
              • Mativ Holdings Inc. - Segment focus
            • 12.11 ORAFOL Europe GmbH
              • ORAFOL Europe GmbH - Overview
              • ORAFOL Europe GmbH - Product / Service
              • ORAFOL Europe GmbH - Key offerings
            • 12.12 Paddock Printing
              • Paddock Printing - Overview
              • Paddock Printing - Product / Service
              • Paddock Printing - Key offerings
            • 12.13 Schweiter Technologies AG
              • Schweiter Technologies AG - Overview
              • Schweiter Technologies AG - Product / Service
              • Schweiter Technologies AG - Key offerings
            • 12.14 Sign Solutions USA
              • Sign Solutions USA - Overview
              • Sign Solutions USA - Product / Service
              • Sign Solutions USA - Key offerings
            • 12.15 Signs Express
              • Signs Express - Overview
              • Signs Express - Product / Service
              • Signs Express - Key offerings
            • 12.16 Spandex Ltd.
              • Spandex Ltd. - Overview
              • Spandex Ltd. - Product / Service
              • Spandex Ltd. - Key offerings
            • 12.17 Techprint Inc.
              • Techprint Inc. - Overview
              • Techprint Inc. - Product / Service
              • Techprint Inc. - Key offerings

            13 Appendix

            • 13.1 Scope of the report
              • 13.2 Inclusions and exclusions checklist
                • Inclusions checklist
                • Exclusions checklist
              • 13.3 Currency conversion rates for US$
                • Currency conversion rates for US$
              • 13.4 Research methodology
                • Research methodology
              • 13.5 Data procurement
                • Information sources
              • 13.6 Data validation
                • Data validation
              • 13.7 Validation techniques employed for market sizing
                • Validation techniques employed for market sizing
              • 13.8 Data synthesis
                • Data synthesis
              • 13.9 360 degree market analysis
                • 360 degree market analysis
              • 13.10 List of abbreviations
                • List of abbreviations

              Research Methodology

              Technavio presents a detailed picture of the market by way of study, synthesis, and summation of data from multiple sources. The analysts have presented the various facets of the market with a particular focus on identifying the key industry influencers. The data thus presented is comprehensive, reliable, and the result of extensive research, both primary and secondary.

              INFORMATION SOURCES

              Primary sources

              • Manufacturers and suppliers
              • Channel partners
              • Industry experts
              • Strategic decision makers

              Secondary sources

              • Industry journals and periodicals
              • Government data
              • Financial reports of key industry players
              • Historical data
              • Press releases

              DATA ANALYSIS

              Data Synthesis

              • Collation of data
              • Estimation of key figures
              • Analysis of derived insights

              Data Validation

              • Triangulation with data models
              • Reference against proprietary databases
              • Corroboration with industry experts

              REPORT WRITING

              Qualitative

              • Market drivers
              • Market challenges
              • Market trends
              • Five forces analysis

              Quantitative

              • Market size and forecast
              • Market segmentation
              • Geographical insights
              • Competitive landscape

              Interested in this report?

              Get your sample now to see our research methodology and insights!

              Download Now

              Frequently Asked Questions

              Printed Signage market growth will increase by $ 4.65 bn during 2024-2028.

              The Printed Signage market is expected to grow at a CAGR of 2.06% during 2024-2028.

              Printed Signage market is segmented by Application( Outdoor, Indoor) End-user( Retail, BFSI, Transportation and logistics, Healthcare, Others)

              Avery Dennison Corp., Canva Pty Ltd., Chandler Signs LLC, Cimpress Plc, EhKo Sign Industries Kft., IGEPA group GmbH and Co. KG, James Publishing, Kelly Signs, L and H Companies, LINTEC Corp., Mativ Holdings Inc., ORAFOL Europe GmbH, Paddock Printing, Schweiter Technologies AG, Sign Solutions USA, Signage US, Signs Express, SmartSign, Spandex Ltd., Techprint Inc. are a few of the key vendors in the Printed Signage market.

              APAC will register the highest growth rate of 50% among the other regions. Therefore, the Printed Signage market in APAC is expected to garner significant business opportunities for the vendors during the forecast period.

              US, China, Japan, UK, Germany

              • Several benefits of using printed signageThe demand for printed signage is growing significantly in recent years is the driving factor this market.
              • owing to several advantages provided by this printed signage to different industries. Some of the benefits of printed signage are listed below:It is affordablePrint advertising is among the least expensive forms of advertising. It is a simple way to publish the content companies want on a wide scale. It is one of the most economical ways to market and advertise companies' products and spread the word. Print signage is used by business owners because it costs less than other marketing strategies is the driving factor this market.
              • freeing up funds for other crucial business needs.It attracts consumers:It has multiple potential uses for business promotion. Printed signs catch the eye is the driving factor this market.
              • especially those with vivid lettering is the driving factor this market.
              • graphics is the driving factor this market.
              • and images. They aid in catching the attention of potential clients and customers. The signs put up around the workplace is the driving factor this market.
              • on a building site is the driving factor this market.
              • or even in a restaurant can have a significant impact on how customers view the brand.People require a focal point for their attention. There is never enough time to read everything that appears on a screen. A great way to display pertinent information without launching an application or website is through printed signage. Simple to installThe content is printed and cut to the required size is the driving factor this market.
              • making the installation simple. The next step is to install the printed signage after the decision to do so has been made. A poster can be printed and put up much more quickly and easily than launching a website. Now that low-cost is the driving factor this market.
              • high-quality prints are available is the driving factor this market.
              • these printed marketing materials can help the company grow.Several benefits of using printed signage are expected to drive the growth of the global printed signage market during the forecast period. is the driving factor this market.

              The Printed Signage market vendors should focus on grabbing business opportunities from the Outdoor segment as it accounted for the largest market share in the base year.