Power Over Ethernet Market Analysis, Size, and Forecast 2026-2030: APAC (China, Japan, and India), Europe (Germany, UK, and France), North America (US, Canada, and Mexico), Middle East and Africa (Saudi Arabia, UAE, and South Africa), South America (Brazil and Argentina), and Rest of World (ROW)

Power Over Ethernet Market Analysis, Size, and Forecast 2026-2030:
APAC (China, Japan, and India), Europe (Germany, UK, and France), North America (US, Canada, and Mexico), Middle East and Africa (Saudi Arabia, UAE, and South Africa), South America (Brazil and Argentina), and Rest of World (ROW)

Published: Apr 2026 306 Pages SKU: IRTNTR71505

Market Overview at a Glance

$989.92 Mn
Market Opportunity
13.4%
CAGR 2025 - 2030
31.8%
Europe Growth
$600.01 Mn
Powered device (PD) segment 2024

Power Over Ethernet Market Size 2026-2030

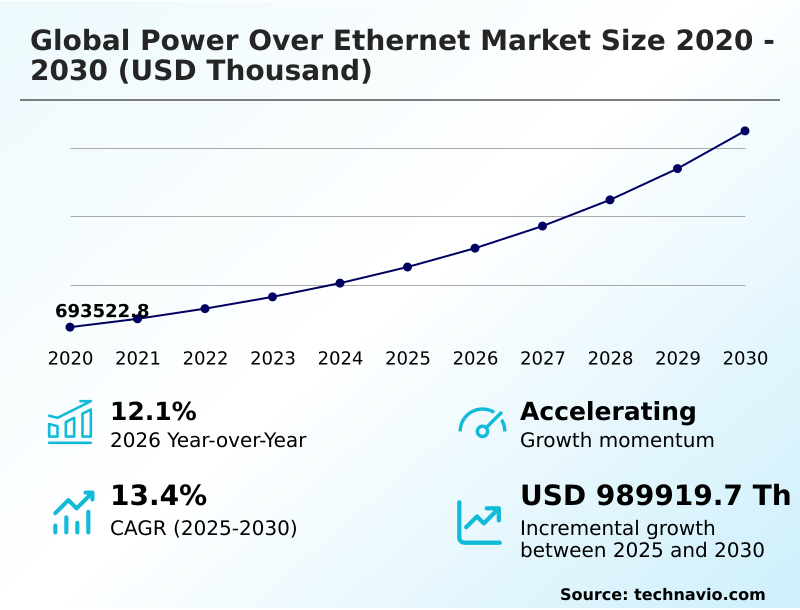
The power over ethernet market size is valued to increase by USD 989.92 million, at a CAGR of 13.4% from 2025 to 2030. Industrialization of smart LED lighting and intelligent building automation will drive the power over ethernet market.

Major Market Trends & Insights

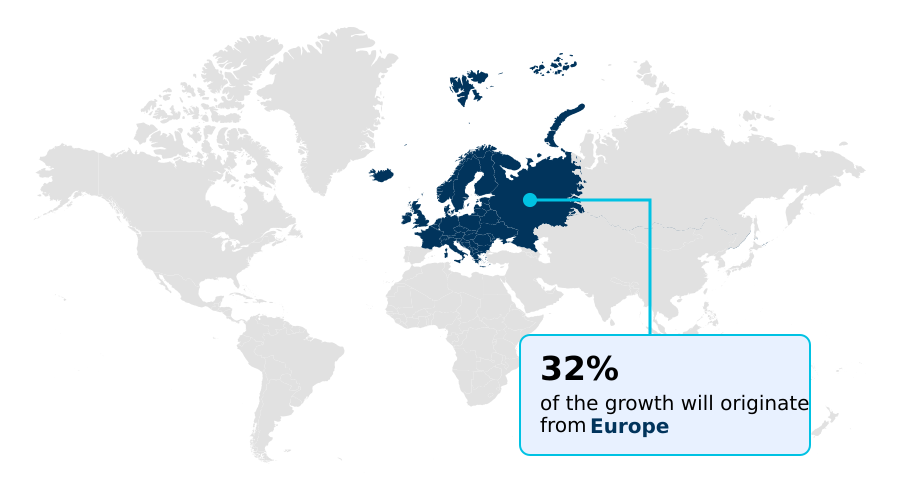
  • Europe dominated the market and accounted for a 31.8% growth during the forecast period.
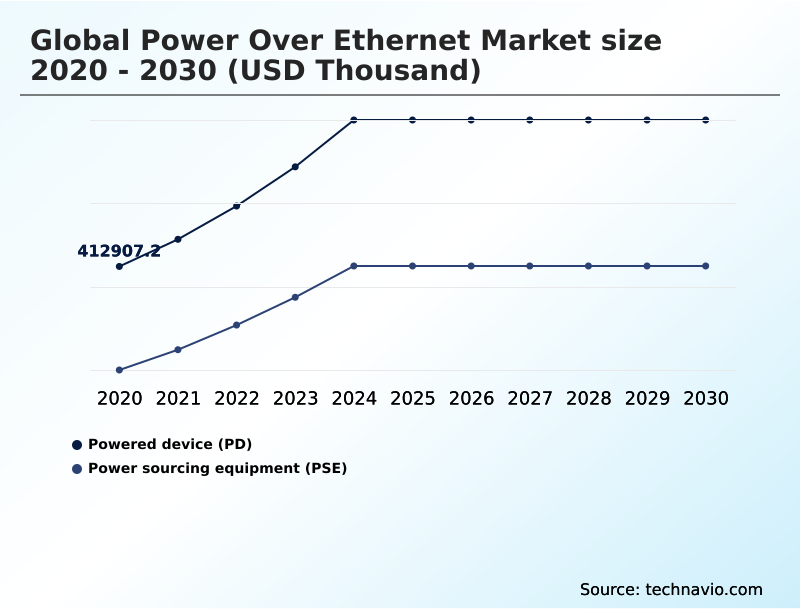
  • By Type - Powered device (PD) segment was valued at USD 600.01 million in 2024
  • By Application - Network infrastructure segment accounted for the largest market revenue share in 2024

Market Size & Forecast

  • Market Opportunities:
  • Market Future Opportunities: USD 989.92 million
  • CAGR from 2025 to 2030 : 13.4%

Market Summary

  • The Power over Ethernet market is undergoing significant infrastructure modernization, driven by the convergence of high-power delivery standards and the proliferation of IoT across commercial and industrial sectors. As enterprises consolidate power and data into single structured cabling solutions, demand for advanced power sourcing equipment, such as managed switches and midspan injectors, has intensified.
  • This growth is propelled by the architectural shift toward smart buildings, where PoE forms the backbone for integrated systems like intelligent LED lighting, IP surveillance, and environmental sensors. For instance, a multinational corporation upgrading its facilities to achieve energy efficiency goals might deploy a PoE-based lighting grid, enabling centralized control and real-time monitoring to reduce idle power consumption by over 30%.
  • The adoption of the IEEE 802.3bt standard, supporting up to 100 watts, expands the market by powering energy-intensive devices like digital signage and high-performance wireless access points. Challenges remain in managing thermal dissipation in high-density cabling and ensuring backward compatibility with legacy powered device hardware, but the drive for operational efficiency and sustainability continues to fuel innovation and adoption.

What will be the Size of the Power Over Ethernet Market during the forecast period?

Get Key Insights on Market Forecast (PDF) Request Free Sample

How is the Power Over Ethernet Market Segmented?

The power over ethernet industry research report provides comprehensive data (region-wise segment analysis), with forecasts and estimates in "USD thousand" for the period 2026-2030, as well as historical data from 2020-2024 for the following segments.

  • Type
    • Powered device (PD)
    • Power sourcing equipment (PSE)
  • Application
    • Network infrastructure
    • Security and access control
    • LED lighting and control
    • Infotainment
    • Others
  • End-user
    • Commercial
    • Industrial
    • Residential
  • Geography
    • APAC
      • China
      • Japan
      • India
    • Europe
      • Germany
      • UK
      • France
    • North America
      • US
      • Canada
      • Mexico
    • Middle East and Africa
      • Saudi Arabia
      • UAE
      • South Africa
    • South America
      • Brazil
      • Argentina
    • Rest of World (ROW)

By Type Insights

The powered device (pd) segment is estimated to witness significant growth during the forecast period.

The powered device segment includes a diverse ecosystem of hardware receiving power and data via a single interface.

This category is rapidly moving beyond traditional endpoints to include high-performance hardware, driven by a need to simplify installations and lower labor costs.

The adoption of the IEEE 802.3bt standard enables support for more demanding hardware, necessitating enhanced thermal management solutions and power efficiency for local computations.

While power sourcing equipment provides the core power, the evolution of single pair ethernet and the 10BASE-T1L standard promises to extend connectivity to previously inaccessible industrial domains.

The use of a midspan injector helps upgrade existing networks, though interoperability issues can arise. Effective predictive energy management and cognitive power budgeting are becoming critical.

Request Free Sample

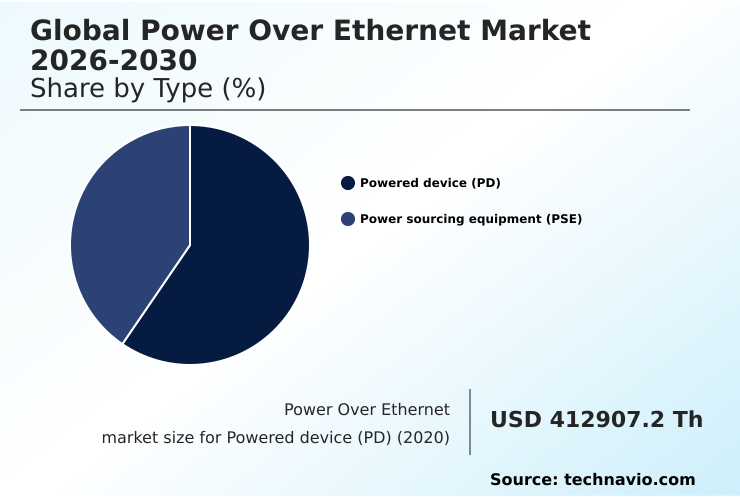
The Powered device (PD) segment was valued at USD 600.01 million in 2024 and showed a gradual increase during the forecast period.

Request Free Sample

Regional Analysis

Europe is estimated to contribute 31.8% to the growth of the global market during the forecast period.Technavio’s analysts have elaborately explained the regional trends and drivers that shape the market during the forecast period.

See How Power Over Ethernet Market Demand is Rising in Europe Request Free Sample

The geographic landscape is marked by diverse growth rates and priorities. The Middle East and Africa are projected to see the fastest expansion, driven by smart city megaprojects.

In North America and Europe, the focus is on upgrading existing commercial and industrial infrastructure to support 802.3bt standards for high-power applications, including infotainment systems and advanced residential automation.

The APAC region, a hub for hardware production, benefits from competitive pricing, fueling rapid adoption in both new constructions and industrial modernizations. This widespread adoption of 802.3af and 802.at, and now 802.3bt, underpins the shift toward digital-first business models.

Ensuring operational resilience through robust enterprise-grade networks is a common goal, with real-time data analytics enabling predictive maintenance in non-hazardous factory environments and supporting autonomous robotics.

Market Dynamics

Our researchers analyzed the data with 2025 as the base year, along with the key drivers, trends, and challenges. A holistic analysis of drivers will help companies refine their marketing strategies to gain a competitive advantage.

  • The strategic deployment of Power over Ethernet is expanding into more specialized and demanding use cases, pushing the boundaries of traditional network design. The integration of power over ethernet for private 5G micro-cells is becoming critical for creating low-latency enterprise environments, while single pair ethernet for long-distance power delivery is opening new possibilities in sprawling industrial and agricultural settings.
  • A primary focus for engineers is managing thermal dissipation in high-power PoE switches, as new standards enable more power-hungry applications. This links directly to the challenge of ensuring interoperability between IEEE 802.3bt and legacy devices, a crucial factor for phased infrastructure upgrades.
  • Using PoE for intelligent building automation systems is now standard, but the specifics of powering pan-tilt-zoom cameras with 802.3bt highlight the need for robust PoE infrastructure for high-performance wireless access points. The role of PoE controllers in power negotiation becomes paramount in these complex systems.
  • As deployments move into harsh industrial environments, the cost-benefit analysis of PoE vs traditional wiring becomes more favorable, especially when considering reduced installation time and centralized maintenance.
  • For instance, facilities that adopt centralized power management with managed PoE switches often report a reduction in endpoint-related service calls that is twice as high as facilities with decentralized power sources, directly impacting operational budgets.
  • Security implications of PoE-enabled networks and the nuances of PoE standards for smart LED lighting control remain key areas of development, alongside the challenges of high-density PoE cabling and solutions for industrial IoT sensors.

What are the key market drivers leading to the rise in the adoption of Power Over Ethernet Industry?

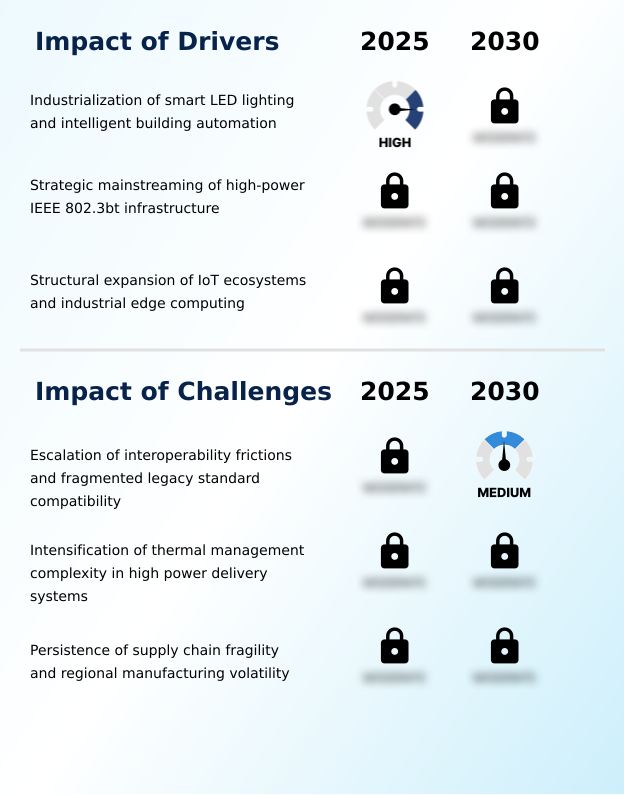
  • The industrialization of smart LED lighting and intelligent building automation serves as a key driver for the market's growth.

  • Market growth is significantly driven by the expanding ecosystem of connected devices and the need for simplified, efficient power delivery.
  • The proliferation of high-performance wireless access points and advanced pan-tilt-zoom cameras, often supported by a PoE adapter or PoE injector, necessitates robust power budgets that only modern standards can provide.
  • The integration of smart LED lighting, powered directly via ethernet, can reduce energy consumption by up to 40% in commercial buildings.
  • This drive for efficiency and consolidation is pushing the adoption of the managed switch as the core of the network, providing granular control over the network power budget and endpoint power classification.
  • Legacy system compatibility issues are a persistent concern, but the benefits of unified infrastructure with a centralized uninterruptible power supply often outweigh the challenges of interoperability friction and potential supply chain fragility in industrial edge computing.

What are the market trends shaping the Power Over Ethernet Industry?

  • The growth of AI-enhanced power sourcing and predictive energy management is an emerging market trend. This involves leveraging machine learning for cognitive power budgeting and dynamic resource allocation.

  • Key trends are reshaping the market, led by the integration of AI for smarter power allocation and the rollout of new cabling standards. The use of a PoE controller with sophisticated power negotiation protocols is becoming standard in any modern PoE switch, enabling human-centric lighting and dynamic energy distribution.
  • This push for centralized power management is critical for optimizing cable heat dissipation, a major concern with high-density category 6A cabling. Furthermore, the adoption of single pair ethernet with four-pair power delivery over a standard RJ45 interface is enabling deployments over much longer distances.
  • The ability to perform remote power cycling on devices like IP surveillance cameras and voice over internet protocol phones has improved network uptime by over 15% in many enterprise settings, showcasing the operational benefits of smart building automation.

What challenges does the Power Over Ethernet Industry face during its growth?

  • Escalating interoperability frictions and fragmented compatibility with legacy standards present a key challenge to industry growth.

  • The market faces persistent challenges related to technical complexity and physical limitations. The intensification of thermal management in high-density cabling environments is a primary concern, as high-wattage delivery systems push copper wiring to its limits. This can lead to a 15% increase in premature insulation failure if not managed correctly.
  • Interoperability issues between new standards and legacy hardware create friction, complicating the expansion of network infrastructure for applications like digital signage and LED lighting and control. Furthermore, the push for low-latency infrastructure to support high-draw devices in converged wireless-wired architecture is straining existing designs.
  • The deployment of industrial-grade PoE for security and access control in edge computing gateways requires a new class of ruggedized hardware, while DC power microgrids are emerging as a competing technology for centralized power.

Exclusive Technavio Analysis on Customer Landscape

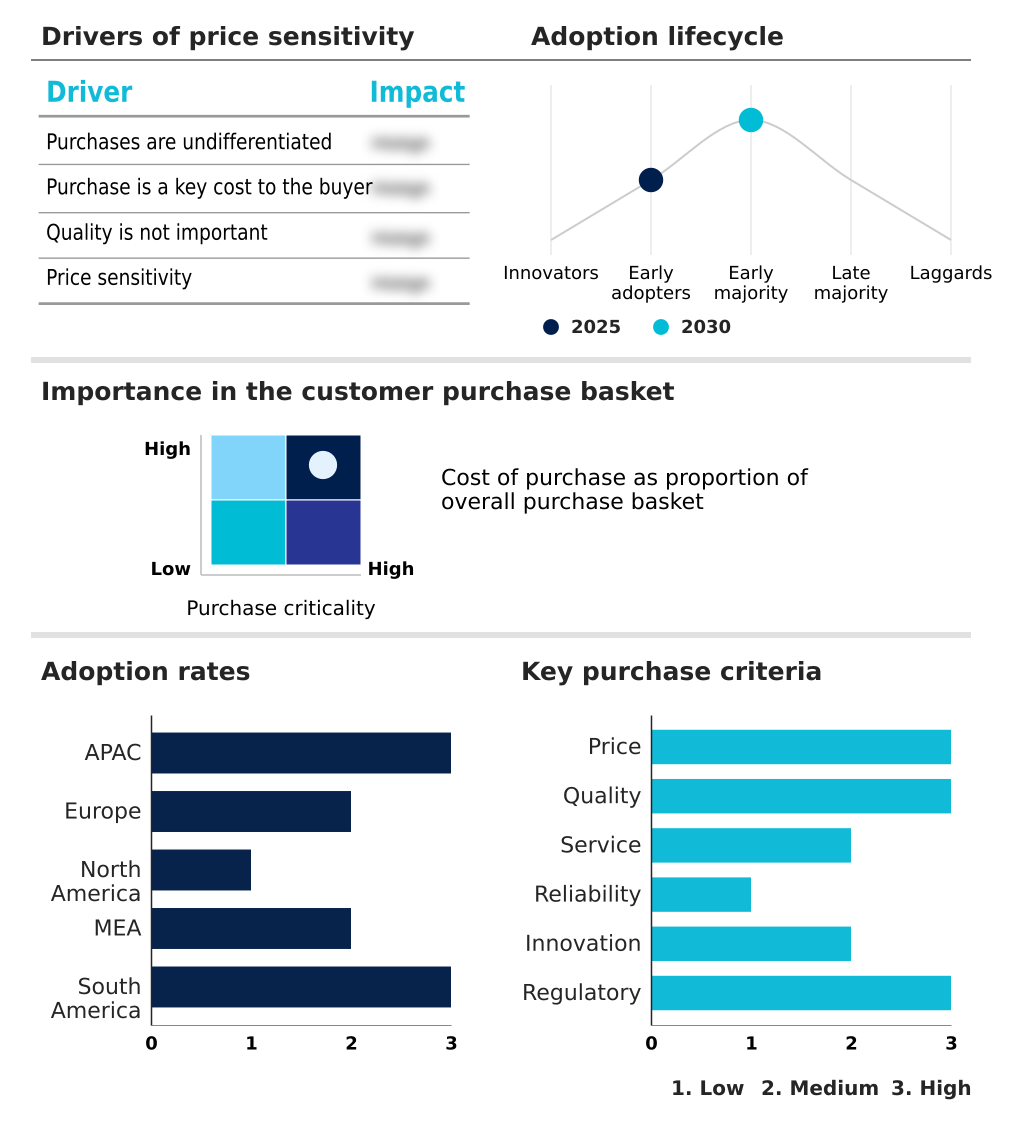
The power over ethernet market forecasting report includes the adoption lifecycle of the market, covering from the innovator’s stage to the laggard’s stage. It focuses on adoption rates in different regions based on penetration. Furthermore, the power over ethernet market report also includes key purchase criteria and drivers of price sensitivity to help companies evaluate and develop their market growth analysis strategies.

Customer Landscape of Power Over Ethernet Industry

Competitive Landscape

Companies are implementing various strategies, such as strategic alliances, power over ethernet market forecast, partnerships, mergers and acquisitions, geographical expansion, and product/service launches, to enhance their presence in the industry.

Advantech Co. Ltd. - Offers industrial-grade power over ethernet solutions, including integrated switches and injectors, that support multiple IEEE standards for ruggedized network deployments.

The industry research and growth report includes detailed analyses of the competitive landscape of the market and information about key companies, including:

  • Advantech Co. Ltd.
  • Analog Devices Inc.
  • Belden Inc.
  • Broadcom Inc.
  • Cisco Systems Inc.
  • D Link Corp.
  • Dell Technologies Inc.
  • Hewlett Packard Enterprise Co.
  • Huawei Technologies Co. Ltd.
  • Microchip Technology Inc.
  • Monolithic Power Systems Inc.
  • Moxa Inc.
  • NETGEAR Inc.
  • ON Semiconductor Corp.
  • Silicon Laboratories Inc.
  • STMicroelectronics NV
  • Texas Instruments Inc.
  • TP Link Corp. Ltd.
  • TRENDnet Inc.
  • Ubiquiti Inc.

Qualitative and quantitative analysis of companies has been conducted to help clients understand the wider business environment as well as the strengths and weaknesses of key industry players. Data is qualitatively analyzed to categorize companies as pure play, category-focused, industry-focused, and diversified; it is quantitatively analyzed to categorize companies as dominant, leading, strong, tentative, and weak.

Recent Development and News in Power over ethernet market

  • In May 2025, Hewlett Packard Enterprise Co. expanded its HPE Aruba Networking portfolio by introducing new campus switches and Wi-Fi 7 access points designed to deliver real-time performance for high-bandwidth computing needs through dynamic application prioritization.
  • In June 2025, Innoviz Technologies launched its InnovizSMART long-range LiDAR sensor, which incorporates native power over ethernet support to streamline deployment in robotics and urban mobility applications.
  • In October 2025, Cisco Systems refreshed its core switching and router lines with the introduction of a new high-end router engineered to manage distributed artificial intelligence workloads and high data throughput in AI-ready infrastructure.
  • In January 2025, Microchip Technology Inc. introduced its GS series of power over ethernet midspan devices, which include models offering up to 90 watts and are fully compliant with the latest ENERGY STAR specifications.

Dive into Technavio’s robust research methodology, blending expert interviews, extensive data synthesis, and validated models for unparalleled Power Over Ethernet Market insights. See full methodology.

Market Scope
Page number 306
Base year 2025
Historic period 2020-2024
Forecast period 2026-2030
Growth momentum & CAGR Accelerate at a CAGR of 13.4%
Market growth 2026-2030 USD 989919.7 thousand
Market structure Fragmented
YoY growth 2025-2026(%) 12.1%
Key countries China, Japan, India, South Korea, Australia, Indonesia, Germany, UK, France, Italy, Spain, The Netherlands, US, Canada, Mexico, Saudi Arabia, UAE, South Africa, Israel, Turkey, Brazil, Argentina and Chile
Competitive landscape Leading Companies, Market Positioning of Companies, Competitive Strategies, and Industry Risks

Request Free Sample

Research Analyst Overview

  • The Power over Ethernet market is defined by a rapid evolution in capabilities, primarily centered on delivering higher power and greater intelligence to the network edge.
  • This transition is heavily reliant on core components such as the PoE controller and PoE switch, which manage the delivery of power to a growing array of endpoints, from traditional voice over internet protocol phones to advanced IP surveillance systems and wireless access points.
  • The adoption of high-power standards allows a single PoE adapter or PoE injector to support devices like pan-tilt-zoom cameras and digital signage, which were previously impractical. Boardroom decisions are now centered on the strategic value of upgrading to managed switch infrastructure that supports these new capabilities, balancing the capital expenditure against long-term gains in operational efficiency and future-proofing the network.
  • This includes ensuring the availability of an uninterruptible power supply for mission-critical systems.
  • A key performance indicator is the ability of modern systems to deliver up to 100 watts per port, a substantial increase that enables a new class of smart LED lighting and industrial-grade PoE applications within a unified network fabric powered by DC power microgrids and edge computing gateways.

What are the Key Data Covered in this Power Over Ethernet Market Research and Growth Report?

  • What is the expected growth of the Power Over Ethernet Market between 2026 and 2030?

    • USD 989.92 million, at a CAGR of 13.4%

  • What segmentation does the market report cover?

    • The report is segmented by Type (Powered device (PD), and Power sourcing equipment (PSE)), Application (Network infrastructure, Security and access control, LED lighting and control, Infotainment, and Others), End-user (Commercial, Industrial, and Residential) and Geography (APAC, Europe, North America, Middle East and Africa, South America)

  • Which regions are analyzed in the report?

    • APAC, Europe, North America, Middle East and Africa and South America

  • What are the key growth drivers and market challenges?

    • Industrialization of smart LED lighting and intelligent building automation, Escalation of interoperability frictions and fragmented legacy standard compatibility

  • Who are the major players in the Power Over Ethernet Market?

    • Advantech Co. Ltd., Analog Devices Inc., Belden Inc., Broadcom Inc., Cisco Systems Inc., D Link Corp., Dell Technologies Inc., Hewlett Packard Enterprise Co., Huawei Technologies Co. Ltd., Microchip Technology Inc., Monolithic Power Systems Inc., Moxa Inc., NETGEAR Inc., ON Semiconductor Corp., Silicon Laboratories Inc., STMicroelectronics NV, Texas Instruments Inc., TP Link Corp. Ltd., TRENDnet Inc. and Ubiquiti Inc.

Market Research Insights

  • Market dynamics are increasingly shaped by a move toward high-wattage delivery systems and smart building automation, which improves operational resilience. The focus on energy efficiency is driving the adoption of low-voltage DC power solutions, with some implementations achieving energy savings of up to 40% in networked lighting systems.
  • However, supply chain fragility remains a concern, with recent disruptions increasing lead times for industrial-grade PoE switches by over 20%. As organizations adopt digital-first business models, the demand for enterprise-grade networks capable of supporting high-draw devices intensifies.
  • The transition to converged wireless-wired architecture is also pushing the need for more sophisticated centralized power management and thermal management solutions to handle the complexity of modern network deployments.

We can help! Our analysts can customize this power over ethernet market research report to meet your requirements.

Get in touch

1. Executive Summary

1.1 Market overview

Executive Summary - Chart on Market Overview
Executive Summary - Data Table on Market Overview
Executive Summary - Chart on Global Market Characteristics
Executive Summary - Chart on Market by Geography
Executive Summary - Chart on Market Segmentation by Type
Executive Summary - Chart on Market Segmentation by Application
Executive Summary - Chart on Market Segmentation by End-user
Executive Summary - Chart on Incremental Growth
Executive Summary - Data Table on Incremental Growth
Executive Summary - Chart on Company Market Positioning

2. Technavio Analysis

2.1 Analysis of price sensitivity, lifecycle, customer purchase basket, adoption rates, and purchase criteria

2.2 Criticality of inputs and Factors of differentiation

Chart on Overview on criticality of inputs and factors of differentiation

2.3 Factors of disruption

Chart on Overview on factors of disruption

2.4 Impact of drivers and challenges

Chart on Impact of drivers and challenges in 2025 and 2030

3. Market Landscape

3.1 Market ecosystem

Chart on Parent Market
Data Table on - Parent Market

3.2 Market characteristics

Chart on Market characteristics analysis

3.3 Value chain analysis

Chart on Value chain analysis

4. Market Sizing

4.1 Market definition

Data Table on Offerings of companies included in the market definition

4.2 Market segment analysis

Market segments

4.3 Market size 2025

4.4 Market outlook: Forecast for 2025-2030

Chart on Global - Market size and forecast 2025-2030 ($ thousand)
Data Table on Global - Market size and forecast 2025-2030 ($ thousand)
Chart on Global Market: Year-over-year growth 2025-2030 (%)
Data Table on Global Market: Year-over-year growth 2025-2030 (%)

5. Historic Market Size

5.1 Global Power Over Ethernet Market 2020 - 2024

Historic Market Size - Data Table on Global Power Over Ethernet Market 2020 - 2024 ($ thousand)

5.2 Type segment analysis 2020 - 2024

Historic Market Size - Type Segment 2020 - 2024 ($ thousand)

5.3 Application segment analysis 2020 - 2024

Historic Market Size - Application Segment 2020 - 2024 ($ thousand)

5.4 End-user segment analysis 2020 - 2024

Historic Market Size - End-user Segment 2020 - 2024 ($ thousand)

5.5 Geography segment analysis 2020 - 2024

Historic Market Size - Geography Segment 2020 - 2024 ($ thousand)

5.6 Country segment analysis 2020 - 2024

Historic Market Size - Country Segment 2020 - 2024 ($ thousand)

6. Qualitative Analysis

6.1 Impact of AI in global power over Ethernet market

6.2 Impact of geopolitical conflict for global power over Ethernet market

7. Five Forces Analysis

7.1 Five forces summary

Five forces analysis - Comparison between 2025 and 2030

7.2 Bargaining power of buyers

Bargaining power of buyers - Impact of key factors 2025 and 2030

7.3 Bargaining power of suppliers

Bargaining power of suppliers - Impact of key factors in 2025 and 2030

7.4 Threat of new entrants

Threat of new entrants - Impact of key factors in 2025 and 2030

7.5 Threat of substitutes

Threat of substitutes - Impact of key factors in 2025 and 2030

7.6 Threat of rivalry

Threat of rivalry - Impact of key factors in 2025 and 2030

7.7 Market condition

Chart on Market condition - Five forces 2025 and 2030

8. Market Segmentation by Type

8.1 Market segments

Chart on Type - Market share 2025-2030 (%)
Data Table on Type - Market share 2025-2030 (%)

8.2 Comparison by Type

Chart on Comparison by Type
Data Table on Comparison by Type

8.3 Powered device (PD) - Market size and forecast 2025-2030

Chart on Powered device (PD) - Market size and forecast 2025-2030 ($ thousand)
Data Table on Powered device (PD) - Market size and forecast 2025-2030 ($ thousand)
Chart on Powered device (PD) - Year-over-year growth 2025-2030 (%)
Data Table on Powered device (PD) - Year-over-year growth 2025-2030 (%)

8.4 Power sourcing equipment (PSE) - Market size and forecast 2025-2030

Chart on Power sourcing equipment (PSE) - Market size and forecast 2025-2030 ($ thousand)
Data Table on Power sourcing equipment (PSE) - Market size and forecast 2025-2030 ($ thousand)
Chart on Power sourcing equipment (PSE) - Year-over-year growth 2025-2030 (%)
Data Table on Power sourcing equipment (PSE) - Year-over-year growth 2025-2030 (%)

8.5 Market opportunity by Type

Market opportunity by Type ($ thousand)
Data Table on Market opportunity by Type ($ thousand)

9. Market Segmentation by Application

9.1 Market segments

Chart on Application - Market share 2025-2030 (%)
Data Table on Application - Market share 2025-2030 (%)

9.2 Comparison by Application

Chart on Comparison by Application
Data Table on Comparison by Application

9.3 Network infrastructure - Market size and forecast 2025-2030

Chart on Network infrastructure - Market size and forecast 2025-2030 ($ thousand)
Data Table on Network infrastructure - Market size and forecast 2025-2030 ($ thousand)
Chart on Network infrastructure - Year-over-year growth 2025-2030 (%)
Data Table on Network infrastructure - Year-over-year growth 2025-2030 (%)

9.4 Security and access control - Market size and forecast 2025-2030

Chart on Security and access control - Market size and forecast 2025-2030 ($ thousand)
Data Table on Security and access control - Market size and forecast 2025-2030 ($ thousand)
Chart on Security and access control - Year-over-year growth 2025-2030 (%)
Data Table on Security and access control - Year-over-year growth 2025-2030 (%)

9.5 LED lighting and control - Market size and forecast 2025-2030

Chart on LED lighting and control - Market size and forecast 2025-2030 ($ thousand)
Data Table on LED lighting and control - Market size and forecast 2025-2030 ($ thousand)
Chart on LED lighting and control - Year-over-year growth 2025-2030 (%)
Data Table on LED lighting and control - Year-over-year growth 2025-2030 (%)

9.6 Infotainment - Market size and forecast 2025-2030

Chart on Infotainment - Market size and forecast 2025-2030 ($ thousand)
Data Table on Infotainment - Market size and forecast 2025-2030 ($ thousand)
Chart on Infotainment - Year-over-year growth 2025-2030 (%)
Data Table on Infotainment - Year-over-year growth 2025-2030 (%)

9.7 Others - Market size and forecast 2025-2030

Chart on Others - Market size and forecast 2025-2030 ($ thousand)
Data Table on Others - Market size and forecast 2025-2030 ($ thousand)
Chart on Others - Year-over-year growth 2025-2030 (%)
Data Table on Others - Year-over-year growth 2025-2030 (%)

9.8 Market opportunity by Application

Market opportunity by Application ($ thousand)
Data Table on Market opportunity by Application ($ thousand)

10. Market Segmentation by End-user

10.1 Market segments

Chart on End-user - Market share 2025-2030 (%)
Data Table on End-user - Market share 2025-2030 (%)

10.2 Comparison by End-user

Chart on Comparison by End-user
Data Table on Comparison by End-user

10.3 Commercial - Market size and forecast 2025-2030

Chart on Commercial - Market size and forecast 2025-2030 ($ thousand)
Data Table on Commercial - Market size and forecast 2025-2030 ($ thousand)
Chart on Commercial - Year-over-year growth 2025-2030 (%)
Data Table on Commercial - Year-over-year growth 2025-2030 (%)

10.4 Industrial - Market size and forecast 2025-2030

Chart on Industrial - Market size and forecast 2025-2030 ($ thousand)
Data Table on Industrial - Market size and forecast 2025-2030 ($ thousand)
Chart on Industrial - Year-over-year growth 2025-2030 (%)
Data Table on Industrial - Year-over-year growth 2025-2030 (%)

10.5 Residential - Market size and forecast 2025-2030

Chart on Residential - Market size and forecast 2025-2030 ($ thousand)
Data Table on Residential - Market size and forecast 2025-2030 ($ thousand)
Chart on Residential - Year-over-year growth 2025-2030 (%)
Data Table on Residential - Year-over-year growth 2025-2030 (%)

10.6 Market opportunity by End-user

Market opportunity by End-user ($ thousand)
Data Table on Market opportunity by End-user ($ thousand)

11. Customer Landscape

11.1 Customer landscape overview

Analysis of price sensitivity, lifecycle, customer purchase basket, adoption rates, and purchase criteria

12. Geographic Landscape

12.1 Geographic segmentation

Chart on Market share by geography 2025-2030 (%)
Data Table on Market share by geography 2025-2030 (%)

12.2 Geographic comparison

Chart on Geographic comparison
Data Table on Geographic comparison

12.3 APAC - Market size and forecast 2025-2030

Chart on APAC - Market size and forecast 2025-2030 ($ thousand)
Data Table on APAC - Market size and forecast 2025-2030 ($ thousand)
Chart on APAC - Year-over-year growth 2025-2030 (%)
Data Table on APAC - Year-over-year growth 2025-2030 (%)
Chart on Regional Comparison - APAC
Data Table on Regional Comparison - APAC

12.3.1 China - Market size and forecast 2025-2030

Chart on China - Market size and forecast 2025-2030 ($ thousand)
Data Table on China - Market size and forecast 2025-2030 ($ thousand)
Chart on China - Year-over-year growth 2025-2030 (%)
Data Table on China - Year-over-year growth 2025-2030 (%)

12.3.2 Japan - Market size and forecast 2025-2030

Chart on Japan - Market size and forecast 2025-2030 ($ thousand)
Data Table on Japan - Market size and forecast 2025-2030 ($ thousand)
Chart on Japan - Year-over-year growth 2025-2030 (%)
Data Table on Japan - Year-over-year growth 2025-2030 (%)

12.3.3 India - Market size and forecast 2025-2030

Chart on India - Market size and forecast 2025-2030 ($ thousand)
Data Table on India - Market size and forecast 2025-2030 ($ thousand)
Chart on India - Year-over-year growth 2025-2030 (%)
Data Table on India - Year-over-year growth 2025-2030 (%)

12.3.4 South Korea - Market size and forecast 2025-2030

Chart on South Korea - Market size and forecast 2025-2030 ($ thousand)
Data Table on South Korea - Market size and forecast 2025-2030 ($ thousand)
Chart on South Korea - Year-over-year growth 2025-2030 (%)
Data Table on South Korea - Year-over-year growth 2025-2030 (%)

12.3.5 Australia - Market size and forecast 2025-2030

Chart on Australia - Market size and forecast 2025-2030 ($ thousand)
Data Table on Australia - Market size and forecast 2025-2030 ($ thousand)
Chart on Australia - Year-over-year growth 2025-2030 (%)
Data Table on Australia - Year-over-year growth 2025-2030 (%)

12.3.6 Indonesia - Market size and forecast 2025-2030

Chart on Indonesia - Market size and forecast 2025-2030 ($ thousand)
Data Table on Indonesia - Market size and forecast 2025-2030 ($ thousand)
Chart on Indonesia - Year-over-year growth 2025-2030 (%)
Data Table on Indonesia - Year-over-year growth 2025-2030 (%)

12.4 Europe - Market size and forecast 2025-2030

Chart on Europe - Market size and forecast 2025-2030 ($ thousand)
Data Table on Europe - Market size and forecast 2025-2030 ($ thousand)
Chart on Europe - Year-over-year growth 2025-2030 (%)
Data Table on Europe - Year-over-year growth 2025-2030 (%)
Chart on Regional Comparison - Europe
Data Table on Regional Comparison - Europe

12.4.1 Germany - Market size and forecast 2025-2030

Chart on Germany - Market size and forecast 2025-2030 ($ thousand)
Data Table on Germany - Market size and forecast 2025-2030 ($ thousand)
Chart on Germany - Year-over-year growth 2025-2030 (%)
Data Table on Germany - Year-over-year growth 2025-2030 (%)

12.4.2 UK - Market size and forecast 2025-2030

Chart on UK - Market size and forecast 2025-2030 ($ thousand)
Data Table on UK - Market size and forecast 2025-2030 ($ thousand)
Chart on UK - Year-over-year growth 2025-2030 (%)
Data Table on UK - Year-over-year growth 2025-2030 (%)

12.4.3 France - Market size and forecast 2025-2030

Chart on France - Market size and forecast 2025-2030 ($ thousand)
Data Table on France - Market size and forecast 2025-2030 ($ thousand)
Chart on France - Year-over-year growth 2025-2030 (%)
Data Table on France - Year-over-year growth 2025-2030 (%)

12.4.4 Italy - Market size and forecast 2025-2030

Chart on Italy - Market size and forecast 2025-2030 ($ thousand)
Data Table on Italy - Market size and forecast 2025-2030 ($ thousand)
Chart on Italy - Year-over-year growth 2025-2030 (%)
Data Table on Italy - Year-over-year growth 2025-2030 (%)

12.4.5 Spain - Market size and forecast 2025-2030

Chart on Spain - Market size and forecast 2025-2030 ($ thousand)
Data Table on Spain - Market size and forecast 2025-2030 ($ thousand)
Chart on Spain - Year-over-year growth 2025-2030 (%)
Data Table on Spain - Year-over-year growth 2025-2030 (%)

12.4.6 The Netherlands - Market size and forecast 2025-2030

Chart on The Netherlands - Market size and forecast 2025-2030 ($ thousand)
Data Table on The Netherlands - Market size and forecast 2025-2030 ($ thousand)
Chart on The Netherlands - Year-over-year growth 2025-2030 (%)
Data Table on The Netherlands - Year-over-year growth 2025-2030 (%)

12.5 North America - Market size and forecast 2025-2030

Chart on North America - Market size and forecast 2025-2030 ($ thousand)
Data Table on North America - Market size and forecast 2025-2030 ($ thousand)
Chart on North America - Year-over-year growth 2025-2030 (%)
Data Table on North America - Year-over-year growth 2025-2030 (%)
Chart on Regional Comparison - North America
Data Table on Regional Comparison - North America

12.5.1 US - Market size and forecast 2025-2030

Chart on US - Market size and forecast 2025-2030 ($ thousand)
Data Table on US - Market size and forecast 2025-2030 ($ thousand)
Chart on US - Year-over-year growth 2025-2030 (%)
Data Table on US - Year-over-year growth 2025-2030 (%)

12.5.2 Canada - Market size and forecast 2025-2030

Chart on Canada - Market size and forecast 2025-2030 ($ thousand)
Data Table on Canada - Market size and forecast 2025-2030 ($ thousand)
Chart on Canada - Year-over-year growth 2025-2030 (%)
Data Table on Canada - Year-over-year growth 2025-2030 (%)

12.5.3 Mexico - Market size and forecast 2025-2030

Chart on Mexico - Market size and forecast 2025-2030 ($ thousand)
Data Table on Mexico - Market size and forecast 2025-2030 ($ thousand)
Chart on Mexico - Year-over-year growth 2025-2030 (%)
Data Table on Mexico - Year-over-year growth 2025-2030 (%)

12.6 Middle East and Africa - Market size and forecast 2025-2030

Chart on Middle East and Africa - Market size and forecast 2025-2030 ($ thousand)
Data Table on Middle East and Africa - Market size and forecast 2025-2030 ($ thousand)
Chart on Middle East and Africa - Year-over-year growth 2025-2030 (%)
Data Table on Middle East and Africa - Year-over-year growth 2025-2030 (%)
Chart on Regional Comparison - Middle East and Africa
Data Table on Regional Comparison - Middle East and Africa

12.6.1 Saudi Arabia - Market size and forecast 2025-2030

Chart on Saudi Arabia - Market size and forecast 2025-2030 ($ thousand)
Data Table on Saudi Arabia - Market size and forecast 2025-2030 ($ thousand)
Chart on Saudi Arabia - Year-over-year growth 2025-2030 (%)
Data Table on Saudi Arabia - Year-over-year growth 2025-2030 (%)

12.6.2 UAE - Market size and forecast 2025-2030

Chart on UAE - Market size and forecast 2025-2030 ($ thousand)
Data Table on UAE - Market size and forecast 2025-2030 ($ thousand)
Chart on UAE - Year-over-year growth 2025-2030 (%)
Data Table on UAE - Year-over-year growth 2025-2030 (%)

12.6.3 South Africa - Market size and forecast 2025-2030

Chart on South Africa - Market size and forecast 2025-2030 ($ thousand)
Data Table on South Africa - Market size and forecast 2025-2030 ($ thousand)
Chart on South Africa - Year-over-year growth 2025-2030 (%)
Data Table on South Africa - Year-over-year growth 2025-2030 (%)

12.6.4 Israel - Market size and forecast 2025-2030

Chart on Israel - Market size and forecast 2025-2030 ($ thousand)
Data Table on Israel - Market size and forecast 2025-2030 ($ thousand)
Chart on Israel - Year-over-year growth 2025-2030 (%)
Data Table on Israel - Year-over-year growth 2025-2030 (%)

12.6.5 Turkey - Market size and forecast 2025-2030

Chart on Turkey - Market size and forecast 2025-2030 ($ thousand)
Data Table on Turkey - Market size and forecast 2025-2030 ($ thousand)
Chart on Turkey - Year-over-year growth 2025-2030 (%)
Data Table on Turkey - Year-over-year growth 2025-2030 (%)

12.7 South America - Market size and forecast 2025-2030

Chart on South America - Market size and forecast 2025-2030 ($ thousand)
Data Table on South America - Market size and forecast 2025-2030 ($ thousand)
Chart on South America - Year-over-year growth 2025-2030 (%)
Data Table on South America - Year-over-year growth 2025-2030 (%)
Chart on Regional Comparison - South America
Data Table on Regional Comparison - South America

12.7.1 Brazil - Market size and forecast 2025-2030

Chart on Brazil - Market size and forecast 2025-2030 ($ thousand)
Data Table on Brazil - Market size and forecast 2025-2030 ($ thousand)
Chart on Brazil - Year-over-year growth 2025-2030 (%)
Data Table on Brazil - Year-over-year growth 2025-2030 (%)

12.7.2 Argentina - Market size and forecast 2025-2030

Chart on Argentina - Market size and forecast 2025-2030 ($ thousand)
Data Table on Argentina - Market size and forecast 2025-2030 ($ thousand)
Chart on Argentina - Year-over-year growth 2025-2030 (%)
Data Table on Argentina - Year-over-year growth 2025-2030 (%)

12.7.3 Chile - Market size and forecast 2025-2030

Chart on Chile - Market size and forecast 2025-2030 ($ thousand)
Data Table on Chile - Market size and forecast 2025-2030 ($ thousand)
Chart on Chile - Year-over-year growth 2025-2030 (%)
Data Table on Chile - Year-over-year growth 2025-2030 (%)

12.8 Market opportunity by geography

Market opportunity by geography ($ thousand)
Data Tables on Market opportunity by geography ($ thousand)

13. Drivers, Challenges, and Opportunity

13.1 Market drivers

Industrialization of smart LED lighting and intelligent building automation
Strategic mainstreaming of high-power IEEE 802.3bt infrastructure
Structural expansion of IoT ecosystems and industrial edge computing

13.2 Market challenges

Escalation of interoperability frictions and fragmented legacy standard compatibility
Intensification of thermal management complexity in high power delivery systems
Persistence of supply chain fragility and regional manufacturing volatility

13.3 Impact of drivers and challenges

Impact of drivers and challenges in 2025 and 2030

13.4 Market opportunities

Growth of AI enhanced power sourcing and predictive energy
Integration of single pair ethernet and long-distance power delivery
Expansion of PoE-powered private 5G micro-cells and edge compute nodes

14. Competitive Landscape

14.1 Overview

14.2

Overview on criticality of inputs and factors of differentiation

14.3 Landscape disruption

Overview on factors of disruption

14.4 Industry risks

Impact of key risks on business

15. Competitive Analysis

15.1 Companies profiled

Companies covered

15.2 Company ranking index

15.3 Market positioning of companies

Matrix on companies position and classification

15.4 Advantech Co. Ltd.

Advantech Co. Ltd. - Overview
Advantech Co. Ltd. - Business segments
Advantech Co. Ltd. - Key offerings
Advantech Co. Ltd. - Segment focus
SWOT

15.5 Analog Devices Inc.

Analog Devices Inc. - Overview
Analog Devices Inc. - Business segments
Analog Devices Inc. - Key offerings
Analog Devices Inc. - Segment focus
SWOT

15.6 Broadcom Inc.

Broadcom Inc. - Overview
Broadcom Inc. - Business segments
Broadcom Inc. - Key offerings
Broadcom Inc. - Segment focus
SWOT

15.7 Cisco Systems Inc.

Cisco Systems Inc. - Overview
Cisco Systems Inc. - Business segments
Cisco Systems Inc. - Key news
Cisco Systems Inc. - Key offerings
Cisco Systems Inc. - Segment focus
SWOT

15.8 D Link Corp.

D Link Corp. - Overview
D Link Corp. - Product / Service
D Link Corp. - Key offerings
SWOT

15.9 Dell Technologies Inc.

Dell Technologies Inc. - Overview
Dell Technologies Inc. - Business segments
Dell Technologies Inc. - Key news
Dell Technologies Inc. - Key offerings
Dell Technologies Inc. - Segment focus
SWOT

15.10 Hewlett Packard Enterprise Co.

Hewlett Packard Enterprise Co. - Overview
Hewlett Packard Enterprise Co. - Business segments
Hewlett Packard Enterprise Co. - Key news
Hewlett Packard Enterprise Co. - Key offerings
Hewlett Packard Enterprise Co. - Segment focus
SWOT

15.11 Huawei Technologies Co. Ltd.

Huawei Technologies Co. Ltd. - Overview
Huawei Technologies Co. Ltd. - Product / Service
Huawei Technologies Co. Ltd. - Key offerings
SWOT

15.12 Microchip Technology Inc.

Microchip Technology Inc. - Overview
Microchip Technology Inc. - Business segments
Microchip Technology Inc. - Key offerings
Microchip Technology Inc. - Segment focus
SWOT

15.13 Monolithic Power Systems Inc.

Monolithic Power Systems Inc. - Overview
Monolithic Power Systems Inc. - Product / Service
Monolithic Power Systems Inc. - Key news
Monolithic Power Systems Inc. - Key offerings
SWOT

15.14 NETGEAR Inc.

NETGEAR Inc. - Overview
NETGEAR Inc. - Business segments
NETGEAR Inc. - Key offerings
NETGEAR Inc. - Segment focus
SWOT

15.15 ON Semiconductor Corp.

ON Semiconductor Corp. - Overview
ON Semiconductor Corp. - Business segments
ON Semiconductor Corp. - Key news
ON Semiconductor Corp. - Key offerings
ON Semiconductor Corp. - Segment focus
SWOT

15.16 STMicroelectronics NV

STMicroelectronics NV - Overview
STMicroelectronics NV - Business segments
STMicroelectronics NV - Key offerings
STMicroelectronics NV - Segment focus
SWOT

15.17 Texas Instruments Inc.

Texas Instruments Inc. - Overview
Texas Instruments Inc. - Business segments
Texas Instruments Inc. - Key offerings
Texas Instruments Inc. - Segment focus
SWOT

15.18 TP Link Corp. Ltd.

TP Link Corp. Ltd. - Overview
TP Link Corp. Ltd. - Product / Service
TP Link Corp. Ltd. - Key offerings
SWOT

16. Appendix

16.1 Scope of the report

Market definition
Objectives
Notes and caveats

16.2 Inclusions and exclusions checklist

Inclusions checklist
Exclusions checklist

16.3 Currency conversion rates for US$

16.4 Research methodology

16.5 Data procurement

Information sources

16.6 Data validation

16.7 Validation techniques employed for market sizing

16.8 Data synthesis

16.9 360 degree market analysis

16.10 List of abbreviations

Research Methodology

Technavio presents a detailed picture of the market by way of study, synthesis, and summation of data from multiple sources. The analysts have presented the various facets of the market with a particular focus on identifying the key industry influencers. The data thus presented is comprehensive, reliable, and the result of extensive research, both primary and secondary.

INFORMATION SOURCES

Primary sources

  • Manufacturers and suppliers
  • Channel partners
  • Industry experts
  • Strategic decision makers

Secondary sources

  • Industry journals and periodicals
  • Government data
  • Financial reports of key industry players
  • Historical data
  • Press releases

DATA ANALYSIS

Data Synthesis

  • Collation of data
  • Estimation of key figures
  • Analysis of derived insights

Data Validation

  • Triangulation with data models
  • Reference against proprietary databases
  • Corroboration with industry experts

REPORT WRITING

Qualitative

  • Market drivers
  • Market challenges
  • Market trends
  • Five forces analysis

Quantitative

  • Market size and forecast
  • Market segmentation
  • Geographical insights
  • Competitive landscape

Interested in this report?

Get your sample now to see our research methodology and insights!

Download Now

Frequently Asked Questions

Power Over Ethernet market growth will increase by USD 989919.7 thousand thousand during 2026-2030.

The Power Over Ethernet market is expected to grow at a CAGR of 13.4% during 2026-2030.

Power Over Ethernet market is segmented by Type (Powered device (PD), Power sourcing equipment (PSE)) Application (Network infrastructure, Security and access control, LED lighting and control, Infotainment, Others) End-user (Commercial, Industrial, Residential)

Advantech Co. Ltd., Analog Devices Inc., Belden Inc., Broadcom Inc., Cisco Systems Inc., D Link Corp., Dell Technologies Inc., Hewlett Packard Enterprise Co., Huawei Technologies Co. Ltd., Microchip Technology Inc., Monolithic Power Systems Inc., Moxa Inc., NETGEAR Inc., ON Semiconductor Corp., Silicon Laboratories Inc., STMicroelectronics NV, Texas Instruments Inc., TP Link Corp. Ltd., TRENDnet Inc., Ubiquiti Inc. are a few of the key vendors in the Power Over Ethernet market.

Europe will register the highest growth rate of 31.8% among the other regions. Therefore, the Power Over Ethernet market in Europe is expected to garner significant business opportunities for the vendors during the forecast period.

China, Japan, India, South Korea, Australia, Indonesia, Germany, UK, France, Italy, Spain, The Netherlands, US, Canada, Mexico, Saudi Arabia, UAE, South Africa, Israel, Turkey, Brazil, Argentina, Chile

  • Industrialization of smart LED lighting and intelligent building automation is the driving factor this market.

The Power Over Ethernet market vendors should focus on grabbing business opportunities from the Type segment as it accounted for the largest market share in the base year.
RIA - Research AI Assistant
Ask RIA