Potassium Chloride Market Analysis, Size, and Forecast 2026-2030: APAC (China, India, and Indonesia), North America (US, Canada, and Mexico), Europe (France, Germany, and Italy), South America (Brazil, Argentina, and Colombia), Middle East and Africa (Saudi Arabia, UAE, and South Africa), and Rest of World (ROW)

Potassium Chloride Market Analysis, Size, and Forecast 2026-2030:
APAC (China, India, and Indonesia), North America (US, Canada, and Mexico), Europe (France, Germany, and Italy), South America (Brazil, Argentina, and Colombia), Middle East and Africa (Saudi Arabia, UAE, and South Africa), and Rest of World (ROW)

Published: Jan 2026 296 Pages SKU: IRTNTR44992

Market Overview at a Glance

$4.49 B
Market Opportunity
4.1%
CAGR 2025 - 2030
36.9%
APAC Growth
$14.71 B
Fertilizer segment 2024

Potassium Chloride Market Size 2026-2030

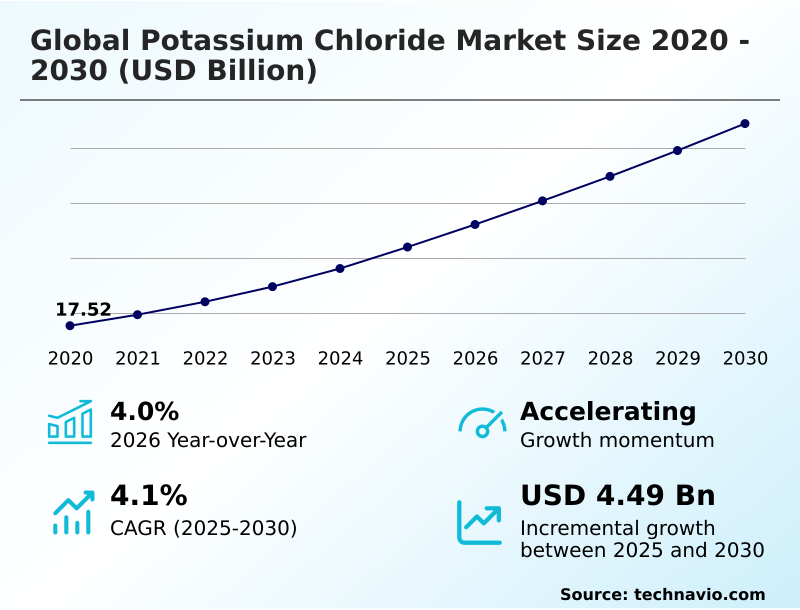
The potassium chloride market size is valued to increase by USD 4.49 billion, at a CAGR of 4.1% from 2025 to 2030. Surging global demand for high-yield agricultural inputs will drive the potassium chloride market.

Major Market Trends & Insights

  • APAC dominated the market and accounted for a 36.9% growth during the forecast period.
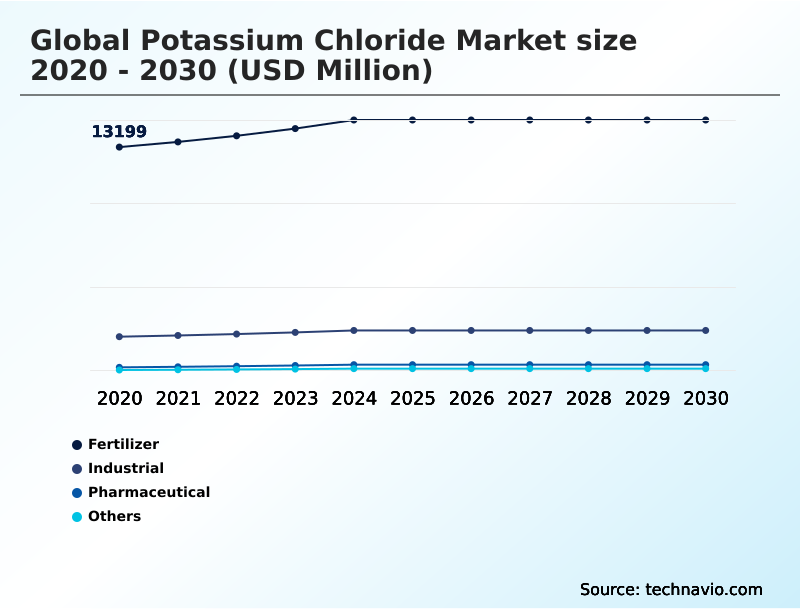
  • By Application - Fertilizer segment was valued at USD 14.71 billion in 2024
  • By Grade Type - Technical grade segment accounted for the largest market revenue share in 2024

Market Size & Forecast

  • Market Opportunities: USD 7.35 billion
  • Market Future Opportunities: USD 4.49 billion
  • CAGR from 2025 to 2030 : 4.1%

Market Summary

  • The potassium chloride market is fundamentally driven by the agricultural sector's need to ensure food security for a growing global population. As muriate of potash, it is the primary source of potassium in NPK fertilizer blends, essential for soil nutrient replenishment and maximizing crop yields.
  • Beyond agriculture, industrial-grade potassium chloride is critical in drilling mud formulations as a clay stabilizer and as a feedstock for potassium hydroxide production. The market is evolving with the adoption of precision agriculture, where soil testing analytics inform variable rate applications, improving nutrient use efficiency and preventing environmental runoff.
  • A significant trend is the move toward sustainable mining practices, including solution mining and water recycling systems, driven by ESG criteria compliance. For instance, a fertilizer manufacturer could leverage different grades, from standard potash to soluble potash for fertigation systems, to create custom blends.
  • This strategy allows them to manage agricultural input costs amid commodity price volatility while meeting diverse agronomic needs, from large-scale row crops to high-value horticulture requiring greenhouse-grade fertilizer. However, the market grapples with challenges like logistical bottlenecks and the impact of trade sanctions, which underscore the need for enhanced supply chain resiliency and domestic production investment.

What will be the Size of the Potassium Chloride Market during the forecast period?

Get Key Insights on Market Forecast (PDF) Request Free Sample

How is the Potassium Chloride Market Segmented?

The potassium chloride industry research report provides comprehensive data (region-wise segment analysis), with forecasts and estimates in "USD million" for the period 2026-2030, as well as historical data from 2020-2024 for the following segments.

  • Application
    • Fertilizer
    • Industrial
    • Pharmaceutical
    • Others
  • Grade type
    • Technical grade
    • Pharmaceutical grade
    • Food grade
  • Type
    • Less than 99 percent purity
    • Greater than 99 percent purity
  • Geography
    • APAC
      • China
      • India
      • Indonesia
    • North America
      • US
      • Canada
      • Mexico
    • Europe
      • France
      • Germany
      • Italy
    • South America
      • Brazil
      • Argentina
      • Colombia
    • Middle East and Africa
      • Saudi Arabia
      • UAE
      • South Africa
    • Rest of World (ROW)

By Application Insights

The fertilizer segment is estimated to witness significant growth during the forecast period.

The fertilizer segment is central to the potassium chloride market, where the chemical, known as muriate of potash (MOP), is a primary component in NPK fertilizer blends.

Its application is vital for soil nutrient replenishment and enhancing agricultural productivity to meet global food demands. The use of granular potash and standard potash helps improve crop resilience against environmental stressors.

In response to rising demand from key agricultural regions, some producers have expanded granular potash capacity by 15% to better serve these markets. The continuous need for soil health improvement and crop yield maximization ensures sustained demand.

This is supported by agronomic best practices and balanced fertilization programs, which are critical for sustainable agriculture and mitigating agricultural input costs.

Request Free Sample

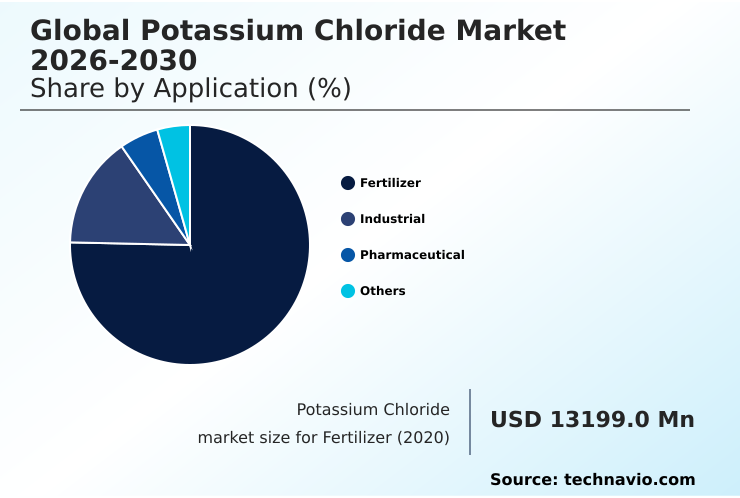
The Fertilizer segment was valued at USD 14.71 billion in 2024 and showed a gradual increase during the forecast period.

Request Free Sample

Regional Analysis

APAC is estimated to contribute 36.9% to the growth of the global market during the forecast period.Technavio’s analysts have elaborately explained the regional trends and drivers that shape the market during the forecast period.

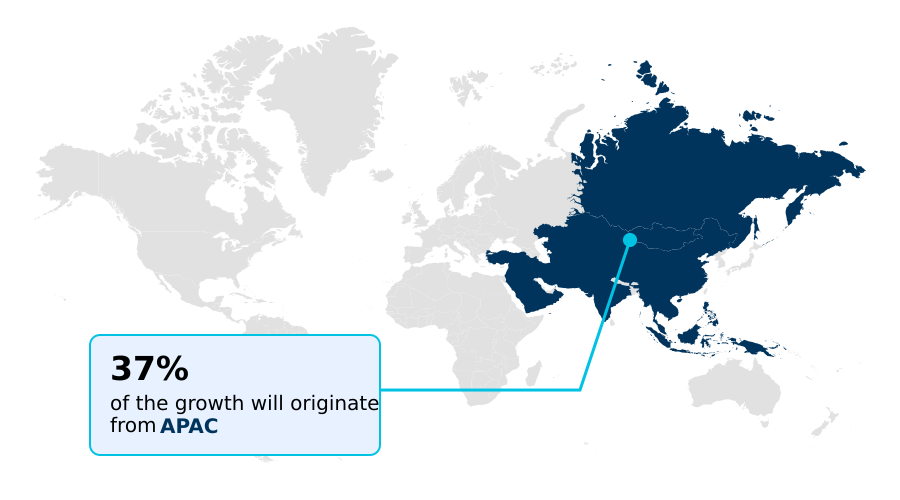
See How Potassium Chloride Market Demand is Rising in APAC Request Free Sample

The geographic landscape is dominated by key producing and consuming regions that dictate global trade flows.

APAC, accounting for over 36% of the market opportunity, is driven by the immense agricultural needs of China and India, where government-led food security initiatives and agricultural subsidy programs are common.

In North America, the adoption of advanced technologies has improved operational metrics; for example, precision agriculture has increased nutrient use efficiency by over 15% in the US Corn Belt.

South America, particularly Brazil, is a major import market where demand is tied to the expansion of soybean and corn cultivation.

Producers in the Middle East leverage solar evaporation for low-cost de-icing agent production, while Canadian miners utilize conventional shaft mining. This global interplay highlights the importance of resource sovereignty and the impact of currency exchange rate impact on market stability.

Market Dynamics

Our researchers analyzed the data with 2025 as the base year, along with the key drivers, trends, and challenges. A holistic analysis of drivers will help companies refine their marketing strategies to gain a competitive advantage.

  • The global potassium chloride market demonstrates significant versatility across multiple sectors. In agriculture, the use of potassium chloride for palm oil cultivation and its impact of MOP on soybean yield are critical for global food supply, while improving crop drought resistance with potash is a key focus in climate-variable regions.
  • The cost-benefit of granular vs standard potash is a constant calculation for blenders creating specific role of potassium chloride in NPK blends and potassium chloride in animal feed formulations. In the industrial space, its function as a potassium chloride as a clay stabilizer in drilling is indispensable for the energy sector.
  • Meanwhile, technical grade potassium chloride for KOH production fuels further chemical manufacturing. The market also addresses specialized needs, from high-purity potassium chloride for pharmaceuticals used in managing hypokalemia with potassium chloride to the application of sodium reduction using food-grade potassium chloride in consumer goods.
  • Environmental and operational considerations are also shaping the market, with a focus on mitigating the environmental impact of potash salt tailings and advancements in solution mining techniques for potash extraction, which can reduce operational costs by up to 25% compared to traditional methods.
  • This efficiency impacts downstream applications, from using potassium chloride for road de-icing to its role in potassium chloride in water softener regeneration and in using potassium chloride in aluminum recycling.
  • The complex potassium chloride supply chain from Canada, Brazilian dependency on potash imports, and the Indian nutrient based subsidy for potash, alongside the European farm to fork strategy for fertilizers, all highlight the market's intricate global dynamics.

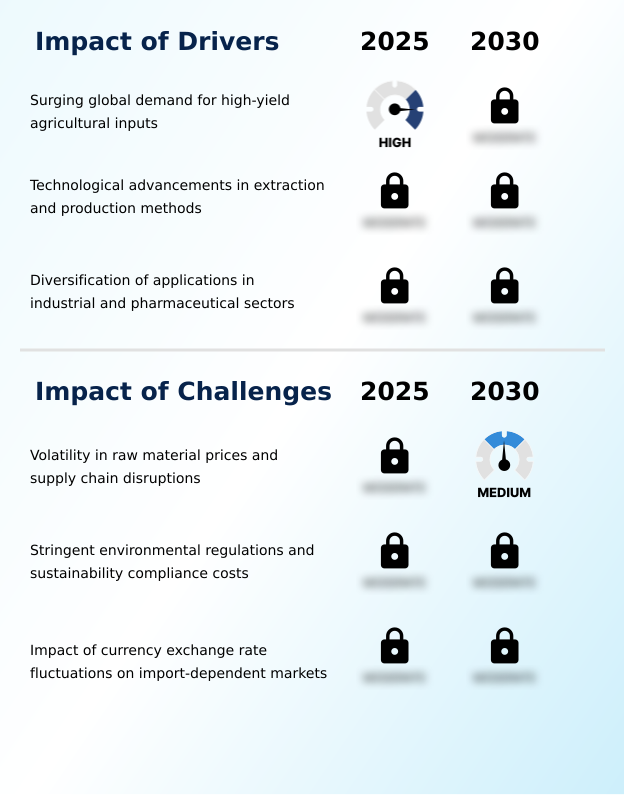
What are the key market drivers leading to the rise in the adoption of Potassium Chloride Industry?

  • The surging global demand for high-yield agricultural inputs is a key driver propelling market growth.

  • The primary market driver remains the relentless need for crop yield maximization to support global food security initiatives. The application of potassium chloride has been shown to boost agricultural productivity by over 10% in nutrient-deficient soils.
  • Technological advancements are a powerful secondary driver, with the adoption of solution mining techniques improving resource recovery efficiency by 15% and lowering operational expenditures.
  • On the farm, precision agriculture technology, informed by soil testing analytics, allows for variable rate application, optimizing soil nutrient replenishment.
  • This focus on efficiency and productivity, from mine to field, underpins the market's structural demand and ongoing innovation in the context of ESG criteria compliance.

What are the market trends shaping the Potassium Chloride Industry?

  • The intensification of global food security initiatives and the adoption of precision agriculture represent a significant upcoming market trend.

  • A significant trend transforming the market is the strategic realignment of global supply chains to enhance supply chain resiliency. In response to geopolitical risk mitigation, importers are diversifying sources, a shift that has improved supply reliability by nearly 30% for some nations.
  • This is complemented by an intensified focus on sustainable mining practices and the pursuit of green potash production, with leading producers achieving a 15% reduction in their carbon footprint through investments in water recycling systems and renewable energy. The industry is also seeing wider adoption of circular economy principles in mining waste management.
  • Concurrently, the farm-to-fork strategy is driving demand for enhanced nutrient use efficiency, making this a pivotal time for the sector.

What challenges does the Potassium Chloride Industry face during its growth?

  • Volatility in raw material prices and ongoing supply chain disruptions present a key challenge affecting the industry's growth.

  • The market faces significant headwinds from commodity price volatility, where agricultural input costs can fluctuate by as much as 40% in a single season, directly impacting farm-gate price and profitability. This volatility is exacerbated by logistical bottleneck analysis, with disruptions capable of delaying shipments and increasing freight expenses.
  • Furthermore, stringent regulations surrounding mining waste management and carbon emissions are increasing operational complexity, with compliance measures adding up to 20% to capital expenditure for new projects. Currency exchange rate impact remains a persistent challenge for import-dependent nations, where a strengthening USD can severely diminish purchasing power and affect agricultural subsidy programs, hindering access to essential nutrients.

Exclusive Technavio Analysis on Customer Landscape

The potassium chloride market forecasting report includes the adoption lifecycle of the market, covering from the innovator’s stage to the laggard’s stage. It focuses on adoption rates in different regions based on penetration. Furthermore, the potassium chloride market report also includes key purchase criteria and drivers of price sensitivity to help companies evaluate and develop their market growth analysis strategies.

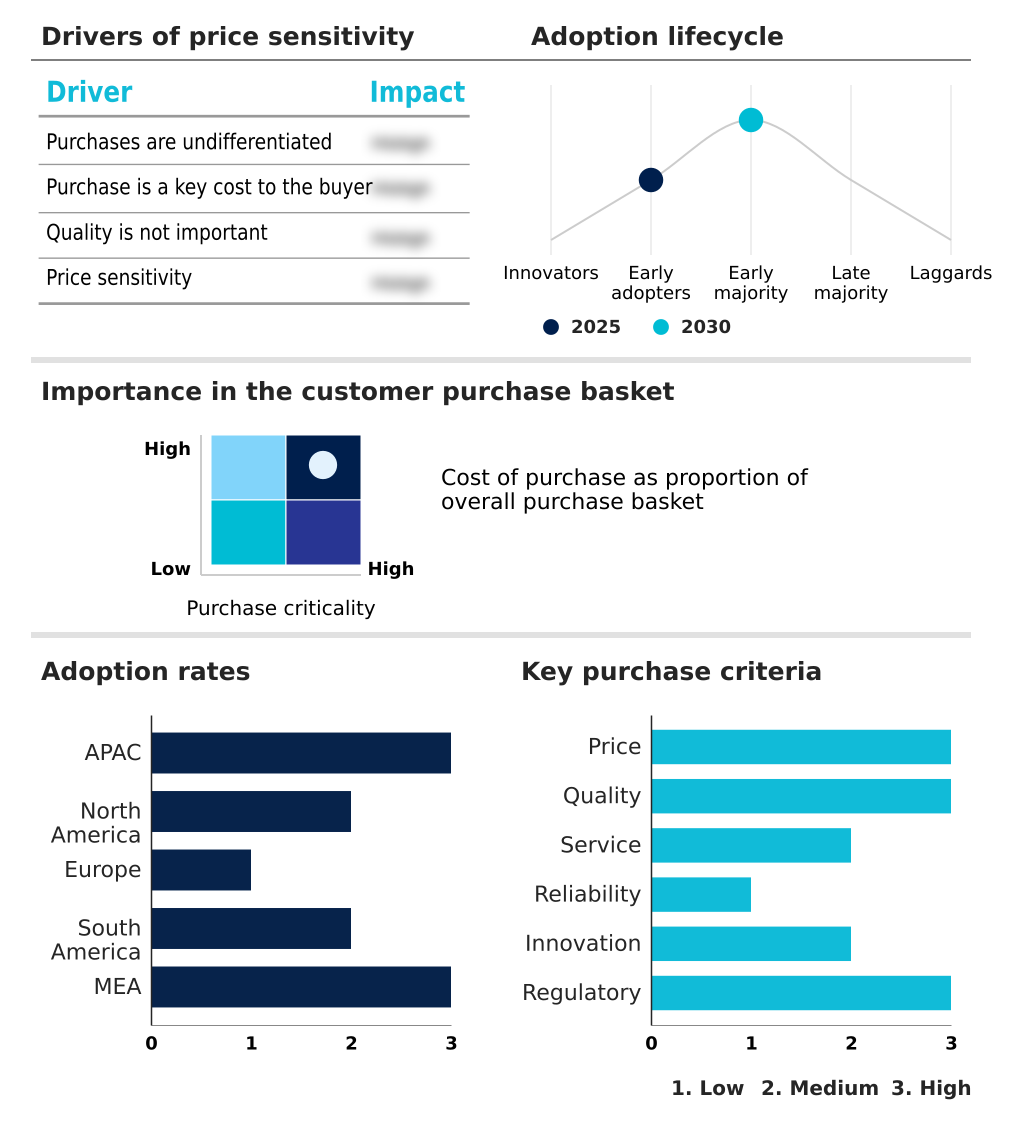
Customer Landscape of Potassium Chloride Industry

Competitive Landscape

Companies are implementing various strategies, such as strategic alliances, potassium chloride market forecast, partnerships, mergers and acquisitions, geographical expansion, and product/service launches, to enhance their presence in the industry.

Annexe Chem - Provides standard, fine, granular, and industrial grade potassium chloride, sourcing the mineral from Dead Sea brine for diverse market applications.

The industry research and growth report includes detailed analyses of the competitive landscape of the market and information about key companies, including:

  • Annexe Chem
  • Arab Potash Co. Plc
  • Avantor Inc.
  • Cargill Inc.
  • Compass Minerals International Inc.
  • Ennore India Chemical Int.
  • EuroChem Group AG
  • Haifa Negev technologies Ltd.
  • Intrepid Potash Inc.
  • Israel Chemicals Ltd.
  • JSC Belarusian Potash Co.
  • KS Aktiengesellschaft
  • Nutrien Ltd.
  • Qinghai Salt Lake Industry Co.,Ltd
  • Sinofert Holdings Ltd.
  • Spectrum Chemical Mfg. Corp.
  • SQM S.A.
  • The Mosaic Co.
  • Upsher Smith Laboratories LLC
  • Yara International ASA

Qualitative and quantitative analysis of companies has been conducted to help clients understand the wider business environment as well as the strengths and weaknesses of key industry players. Data is qualitatively analyzed to categorize companies as pure play, category-focused, industry-focused, and diversified; it is quantitatively analyzed to categorize companies as dominant, leading, strong, tentative, and weak.

Recent Development and News in Potassium chloride market

  • In March 2025, Nutrien Ltd. announced the deployment of a proprietary autonomous mining system across its Saskatchewan operations, designed to increase ore recovery rates by fifteen percent.
  • In February 2025, BHP Group announced the early completion of critical infrastructure at the Jansen Stage 2 project in Canada, confirming plans to accelerate production capacity by an additional two million tonnes annually to meet supply gaps.
  • In February 2025, the European Commission introduced the updated Directive on Mining Waste Management, which enforces stricter limits on saline discharge into water bodies and mandates advanced tailings storage technologies.
  • In March 2025, the government of Brazil announced a new strategic trade agreement framework with Canadian suppliers to stabilize potassium chloride import tariffs and secure long-term supply amid global volatility.

Dive into Technavio’s robust research methodology, blending expert interviews, extensive data synthesis, and validated models for unparalleled Potassium Chloride Market insights. See full methodology.

Market Scope
Page number 296
Base year 2025
Historic period 2020-2024
Forecast period 2026-2030
Growth momentum & CAGR Accelerate at a CAGR of 4.1%
Market growth 2026-2030 USD 4490.7 million
Market structure Fragmented
YoY growth 2025-2026(%) 4.0%
Key countries China, India, Indonesia, Australia, Japan, South Korea, US, Canada, Mexico, France, Germany, Italy, Spain, UK, The Netherlands, Brazil, Argentina, Colombia, Saudi Arabia, UAE, South Africa, Israel and Turkey
Competitive landscape Leading Companies, Market Positioning of Companies, Competitive Strategies, and Industry Risks

Request Free Sample

Research Analyst Overview

  • The potassium chloride market is evolving beyond a volume-driven commodity business into a more technically nuanced industry. While muriate of potash remains the cornerstone for broad-acre agriculture, significant value is now being created in specialized grades and applications. The demand for pharmaceutical-grade potassium chloride for hypokalemia treatment and as a sodium-free substitute in foods is growing steadily.
  • In industrial settings, its roles in drilling mud formulation, potassium hydroxide production, and as a de-icing agent are well-established. A key shift is the focus on production efficiency and sustainability, with technologies like solution mining enabling some operators to increase ore recovery rates by up to 15%.
  • This focus on efficiency extends to the field with products like slow-release fertilizer and controlled-release fertilizer, which optimize nutrient delivery. The market now encompasses a wide spectrum, from standard potash and agricultural lime to highly refined soluble potash for fertigation and hydroponic systems, reflecting a strategic move toward addressing specific end-user requirements with precision.

What are the Key Data Covered in this Potassium Chloride Market Research and Growth Report?

  • What is the expected growth of the Potassium Chloride Market between 2026 and 2030?

    • USD 4.49 billion, at a CAGR of 4.1%

  • What segmentation does the market report cover?

    • The report is segmented by Application (Fertilizer, Industrial, Pharmaceutical, and Others), Grade Type (Technical grade, Pharmaceutical grade, and Food grade), Type (Less than 99 percent purity, and Greater than 99 percent purity) and Geography (APAC, North America, Europe, South America, Middle East and Africa)

  • Which regions are analyzed in the report?

    • APAC, North America, Europe, South America and Middle East and Africa

  • What are the key growth drivers and market challenges?

    • Surging global demand for high-yield agricultural inputs, Volatility in raw material prices and supply chain disruptions

  • Who are the major players in the Potassium Chloride Market?

    • Annexe Chem, Arab Potash Co. Plc, Avantor Inc., Cargill Inc., Compass Minerals International Inc., Ennore India Chemical Int., EuroChem Group AG, Haifa Negev technologies Ltd., Intrepid Potash Inc., Israel Chemicals Ltd., JSC Belarusian Potash Co., KS Aktiengesellschaft, Nutrien Ltd., Qinghai Salt Lake Industry Co.,Ltd, Sinofert Holdings Ltd., Spectrum Chemical Mfg. Corp., SQM S.A., The Mosaic Co., Upsher Smith Laboratories LLC and Yara International ASA

Market Research Insights

  • Market dynamics are shaped by a complex interplay of agricultural demand, geopolitical risk mitigation, and technological adoption. The push for supply chain resiliency has become paramount, with investments in domestic production infrastructure showing an ability to reduce dependency on foreign imports by up to 25% in certain scenarios.
  • Concurrently, the implementation of precision agriculture technology allows for variable rate application of fertilizers, improving nutrient use efficiency by over 20% and minimizing environmental runoff. These advancements in soil nutrient management address farm-gate price pressures.
  • Efforts to overcome logistical bottleneck analysis have led to infrastructure upgrades capable of decreasing transport-related delays by 15%, enhancing the reliability of supply chains from producers to end-users and supporting food security initiatives globally.

We can help! Our analysts can customize this potassium chloride market research report to meet your requirements.

Get in touch

1. Executive Summary

1.1 Market overview

Executive Summary - Chart on Market Overview
Executive Summary - Data Table on Market Overview
Executive Summary - Chart on Global Market Characteristics
Executive Summary - Chart on Market by Geography
Executive Summary - Chart on Market Segmentation by Application
Executive Summary - Chart on Market Segmentation by Grade Type
Executive Summary - Chart on Market Segmentation by Type
Executive Summary - Chart on Incremental Growth
Executive Summary - Data Table on Incremental Growth
Executive Summary - Chart on Company Market Positioning

2. Technavio Analysis

2.1 Analysis of price sensitivity, lifecycle, customer purchase basket, adoption rates, and purchase criteria

2.2 Criticality of inputs and Factors of differentiation

Chart on Overview on criticality of inputs and factors of differentiation

2.3 Factors of disruption

Chart on Overview on factors of disruption

2.4 Impact of drivers and challenges

Chart on Impact of drivers and challenges in 2025 and 2030

3. Market Landscape

3.1 Market ecosystem

Chart on Parent Market
Data Table on - Parent Market

3.2 Market characteristics

Chart on Market characteristics analysis

3.3 Value chain analysis

Chart on Value chain analysis

4. Market Sizing

4.1 Market definition

Data Table on Offerings of companies included in the market definition

4.2 Market segment analysis

Market segments

4.3 Market size 2025

4.4 Market outlook: Forecast for 2025-2030

Chart on Global - Market size and forecast 2025-2030 ($ million)
Data Table on Global - Market size and forecast 2025-2030 ($ million)
Chart on Global Market: Year-over-year growth 2025-2030 (%)
Data Table on Global Market: Year-over-year growth 2025-2030 (%)

5. Historic Market Size

5.1 Global Potassium Chloride Market 2020 - 2024

Historic Market Size - Data Table on Global Potassium Chloride Market 2020 - 2024 ($ million)

5.2 Application segment analysis 2020 - 2024

Historic Market Size - Application Segment 2020 - 2024 ($ million)

5.3 Grade Type segment analysis 2020 - 2024

Historic Market Size - Grade Type Segment 2020 - 2024 ($ million)

5.4 Type segment analysis 2020 - 2024

Historic Market Size - Type Segment 2020 - 2024 ($ million)

5.5 Geography segment analysis 2020 - 2024

Historic Market Size - Geography Segment 2020 - 2024 ($ million)

5.6 Country segment analysis 2020 - 2024

Historic Market Size - Country Segment 2020 - 2024 ($ million)

6. Qualitative Analysis

6.1 Impact of AI on the Global Potassium Chloride Market

7. Five Forces Analysis

7.1 Five forces summary

Five forces analysis - Comparison between 2025 and 2030

7.2 Bargaining power of buyers

Bargaining power of buyers - Impact of key factors 2025 and 2030

7.3 Bargaining power of suppliers

Bargaining power of suppliers - Impact of key factors in 2025 and 2030

7.4 Threat of new entrants

Threat of new entrants - Impact of key factors in 2025 and 2030

7.5 Threat of substitutes

Threat of substitutes - Impact of key factors in 2025 and 2030

7.6 Threat of rivalry

Threat of rivalry - Impact of key factors in 2025 and 2030

7.7 Market condition

Chart on Market condition - Five forces 2025 and 2030

8. Market Segmentation by Application

8.1 Market segments

Chart on Application - Market share 2025-2030 (%)
Data Table on Application - Market share 2025-2030 (%)

8.2 Comparison by Application

Chart on Comparison by Application
Data Table on Comparison by Application

8.3 Fertilizer - Market size and forecast 2025-2030

Chart on Fertilizer - Market size and forecast 2025-2030 ($ million)
Data Table on Fertilizer - Market size and forecast 2025-2030 ($ million)
Chart on Fertilizer - Year-over-year growth 2025-2030 (%)
Data Table on Fertilizer - Year-over-year growth 2025-2030 (%)

8.4 Industrial - Market size and forecast 2025-2030

Chart on Industrial - Market size and forecast 2025-2030 ($ million)
Data Table on Industrial - Market size and forecast 2025-2030 ($ million)
Chart on Industrial - Year-over-year growth 2025-2030 (%)
Data Table on Industrial - Year-over-year growth 2025-2030 (%)

8.5 Pharmaceutical - Market size and forecast 2025-2030

Chart on Pharmaceutical - Market size and forecast 2025-2030 ($ million)
Data Table on Pharmaceutical - Market size and forecast 2025-2030 ($ million)
Chart on Pharmaceutical - Year-over-year growth 2025-2030 (%)
Data Table on Pharmaceutical - Year-over-year growth 2025-2030 (%)

8.6 Others - Market size and forecast 2025-2030

Chart on Others - Market size and forecast 2025-2030 ($ million)
Data Table on Others - Market size and forecast 2025-2030 ($ million)
Chart on Others - Year-over-year growth 2025-2030 (%)
Data Table on Others - Year-over-year growth 2025-2030 (%)

8.7 Market opportunity by Application

Market opportunity by Application ($ million)
Data Table on Market opportunity by Application ($ million)

9. Market Segmentation by Grade Type

9.1 Market segments

Chart on Grade Type - Market share 2025-2030 (%)
Data Table on Grade Type - Market share 2025-2030 (%)

9.2 Comparison by Grade Type

Chart on Comparison by Grade Type
Data Table on Comparison by Grade Type

9.3 Technical grade - Market size and forecast 2025-2030

Chart on Technical grade - Market size and forecast 2025-2030 ($ million)
Data Table on Technical grade - Market size and forecast 2025-2030 ($ million)
Chart on Technical grade - Year-over-year growth 2025-2030 (%)
Data Table on Technical grade - Year-over-year growth 2025-2030 (%)

9.4 Pharmaceutical grade - Market size and forecast 2025-2030

Chart on Pharmaceutical grade - Market size and forecast 2025-2030 ($ million)
Data Table on Pharmaceutical grade - Market size and forecast 2025-2030 ($ million)
Chart on Pharmaceutical grade - Year-over-year growth 2025-2030 (%)
Data Table on Pharmaceutical grade - Year-over-year growth 2025-2030 (%)

9.5 Food grade - Market size and forecast 2025-2030

Chart on Food grade - Market size and forecast 2025-2030 ($ million)
Data Table on Food grade - Market size and forecast 2025-2030 ($ million)
Chart on Food grade - Year-over-year growth 2025-2030 (%)
Data Table on Food grade - Year-over-year growth 2025-2030 (%)

9.6 Market opportunity by Grade Type

Market opportunity by Grade Type ($ million)
Data Table on Market opportunity by Grade Type ($ million)

10. Market Segmentation by Type

10.1 Market segments

Chart on Type - Market share 2025-2030 (%)
Data Table on Type - Market share 2025-2030 (%)

10.2 Comparison by Type

Chart on Comparison by Type
Data Table on Comparison by Type

10.3 Less than 99 percent purity - Market size and forecast 2025-2030

Chart on Less than 99 percent purity - Market size and forecast 2025-2030 ($ million)
Data Table on Less than 99 percent purity - Market size and forecast 2025-2030 ($ million)
Chart on Less than 99 percent purity - Year-over-year growth 2025-2030 (%)
Data Table on Less than 99 percent purity - Year-over-year growth 2025-2030 (%)

10.4 Greater than 99 percent purity - Market size and forecast 2025-2030

Chart on Greater than 99 percent purity - Market size and forecast 2025-2030 ($ million)
Data Table on Greater than 99 percent purity - Market size and forecast 2025-2030 ($ million)
Chart on Greater than 99 percent purity - Year-over-year growth 2025-2030 (%)
Data Table on Greater than 99 percent purity - Year-over-year growth 2025-2030 (%)

10.5 Market opportunity by Type

Market opportunity by Type ($ million)
Data Table on Market opportunity by Type ($ million)

11. Customer Landscape

11.1 Customer landscape overview

Analysis of price sensitivity, lifecycle, customer purchase basket, adoption rates, and purchase criteria

12. Geographic Landscape

12.1 Geographic segmentation

Chart on Market share by geography 2025-2030 (%)
Data Table on Market share by geography 2025-2030 (%)

12.2 Geographic comparison

Chart on Geographic comparison
Data Table on Geographic comparison

12.3 APAC - Market size and forecast 2025-2030

Chart on APAC - Market size and forecast 2025-2030 ($ million)
Data Table on APAC - Market size and forecast 2025-2030 ($ million)
Chart on APAC - Year-over-year growth 2025-2030 (%)
Data Table on APAC - Year-over-year growth 2025-2030 (%)
Chart on Regional Comparison - APAC
Data Table on Regional Comparison - APAC

12.3.1 China - Market size and forecast 2025-2030

Chart on China - Market size and forecast 2025-2030 ($ million)
Data Table on China - Market size and forecast 2025-2030 ($ million)
Chart on China - Year-over-year growth 2025-2030 (%)
Data Table on China - Year-over-year growth 2025-2030 (%)

12.3.2 India - Market size and forecast 2025-2030

Chart on India - Market size and forecast 2025-2030 ($ million)
Data Table on India - Market size and forecast 2025-2030 ($ million)
Chart on India - Year-over-year growth 2025-2030 (%)
Data Table on India - Year-over-year growth 2025-2030 (%)

12.3.3 Indonesia - Market size and forecast 2025-2030

Chart on Indonesia - Market size and forecast 2025-2030 ($ million)
Data Table on Indonesia - Market size and forecast 2025-2030 ($ million)
Chart on Indonesia - Year-over-year growth 2025-2030 (%)
Data Table on Indonesia - Year-over-year growth 2025-2030 (%)

12.3.4 Australia - Market size and forecast 2025-2030

Chart on Australia - Market size and forecast 2025-2030 ($ million)
Data Table on Australia - Market size and forecast 2025-2030 ($ million)
Chart on Australia - Year-over-year growth 2025-2030 (%)
Data Table on Australia - Year-over-year growth 2025-2030 (%)

12.3.5 Japan - Market size and forecast 2025-2030

Chart on Japan - Market size and forecast 2025-2030 ($ million)
Data Table on Japan - Market size and forecast 2025-2030 ($ million)
Chart on Japan - Year-over-year growth 2025-2030 (%)
Data Table on Japan - Year-over-year growth 2025-2030 (%)

12.3.6 South Korea - Market size and forecast 2025-2030

Chart on South Korea - Market size and forecast 2025-2030 ($ million)
Data Table on South Korea - Market size and forecast 2025-2030 ($ million)
Chart on South Korea - Year-over-year growth 2025-2030 (%)
Data Table on South Korea - Year-over-year growth 2025-2030 (%)

12.4 North America - Market size and forecast 2025-2030

Chart on North America - Market size and forecast 2025-2030 ($ million)
Data Table on North America - Market size and forecast 2025-2030 ($ million)
Chart on North America - Year-over-year growth 2025-2030 (%)
Data Table on North America - Year-over-year growth 2025-2030 (%)
Chart on Regional Comparison - North America
Data Table on Regional Comparison - North America

12.4.1 US - Market size and forecast 2025-2030

Chart on US - Market size and forecast 2025-2030 ($ million)
Data Table on US - Market size and forecast 2025-2030 ($ million)
Chart on US - Year-over-year growth 2025-2030 (%)
Data Table on US - Year-over-year growth 2025-2030 (%)

12.4.2 Canada - Market size and forecast 2025-2030

Chart on Canada - Market size and forecast 2025-2030 ($ million)
Data Table on Canada - Market size and forecast 2025-2030 ($ million)
Chart on Canada - Year-over-year growth 2025-2030 (%)
Data Table on Canada - Year-over-year growth 2025-2030 (%)

12.4.3 Mexico - Market size and forecast 2025-2030

Chart on Mexico - Market size and forecast 2025-2030 ($ million)
Data Table on Mexico - Market size and forecast 2025-2030 ($ million)
Chart on Mexico - Year-over-year growth 2025-2030 (%)
Data Table on Mexico - Year-over-year growth 2025-2030 (%)

12.5 Europe - Market size and forecast 2025-2030

Chart on Europe - Market size and forecast 2025-2030 ($ million)
Data Table on Europe - Market size and forecast 2025-2030 ($ million)
Chart on Europe - Year-over-year growth 2025-2030 (%)
Data Table on Europe - Year-over-year growth 2025-2030 (%)
Chart on Regional Comparison - Europe
Data Table on Regional Comparison - Europe

12.5.1 France - Market size and forecast 2025-2030

Chart on France - Market size and forecast 2025-2030 ($ million)
Data Table on France - Market size and forecast 2025-2030 ($ million)
Chart on France - Year-over-year growth 2025-2030 (%)
Data Table on France - Year-over-year growth 2025-2030 (%)

12.5.2 Germany - Market size and forecast 2025-2030

Chart on Germany - Market size and forecast 2025-2030 ($ million)
Data Table on Germany - Market size and forecast 2025-2030 ($ million)
Chart on Germany - Year-over-year growth 2025-2030 (%)
Data Table on Germany - Year-over-year growth 2025-2030 (%)

12.5.3 Italy - Market size and forecast 2025-2030

Chart on Italy - Market size and forecast 2025-2030 ($ million)
Data Table on Italy - Market size and forecast 2025-2030 ($ million)
Chart on Italy - Year-over-year growth 2025-2030 (%)
Data Table on Italy - Year-over-year growth 2025-2030 (%)

12.5.4 Spain - Market size and forecast 2025-2030

Chart on Spain - Market size and forecast 2025-2030 ($ million)
Data Table on Spain - Market size and forecast 2025-2030 ($ million)
Chart on Spain - Year-over-year growth 2025-2030 (%)
Data Table on Spain - Year-over-year growth 2025-2030 (%)

12.5.5 UK - Market size and forecast 2025-2030

Chart on UK - Market size and forecast 2025-2030 ($ million)
Data Table on UK - Market size and forecast 2025-2030 ($ million)
Chart on UK - Year-over-year growth 2025-2030 (%)
Data Table on UK - Year-over-year growth 2025-2030 (%)

12.5.6 The Netherlands - Market size and forecast 2025-2030

Chart on The Netherlands - Market size and forecast 2025-2030 ($ million)
Data Table on The Netherlands - Market size and forecast 2025-2030 ($ million)
Chart on The Netherlands - Year-over-year growth 2025-2030 (%)
Data Table on The Netherlands - Year-over-year growth 2025-2030 (%)

12.6 South America - Market size and forecast 2025-2030

Chart on South America - Market size and forecast 2025-2030 ($ million)
Data Table on South America - Market size and forecast 2025-2030 ($ million)
Chart on South America - Year-over-year growth 2025-2030 (%)
Data Table on South America - Year-over-year growth 2025-2030 (%)
Chart on Regional Comparison - South America
Data Table on Regional Comparison - South America

12.6.1 Brazil - Market size and forecast 2025-2030

Chart on Brazil - Market size and forecast 2025-2030 ($ million)
Data Table on Brazil - Market size and forecast 2025-2030 ($ million)
Chart on Brazil - Year-over-year growth 2025-2030 (%)
Data Table on Brazil - Year-over-year growth 2025-2030 (%)

12.6.2 Argentina - Market size and forecast 2025-2030

Chart on Argentina - Market size and forecast 2025-2030 ($ million)
Data Table on Argentina - Market size and forecast 2025-2030 ($ million)
Chart on Argentina - Year-over-year growth 2025-2030 (%)
Data Table on Argentina - Year-over-year growth 2025-2030 (%)

12.6.3 Colombia - Market size and forecast 2025-2030

Chart on Colombia - Market size and forecast 2025-2030 ($ million)
Data Table on Colombia - Market size and forecast 2025-2030 ($ million)
Chart on Colombia - Year-over-year growth 2025-2030 (%)
Data Table on Colombia - Year-over-year growth 2025-2030 (%)

12.7 Middle East and Africa - Market size and forecast 2025-2030

Chart on Middle East and Africa - Market size and forecast 2025-2030 ($ million)
Data Table on Middle East and Africa - Market size and forecast 2025-2030 ($ million)
Chart on Middle East and Africa - Year-over-year growth 2025-2030 (%)
Data Table on Middle East and Africa - Year-over-year growth 2025-2030 (%)
Chart on Regional Comparison - Middle East and Africa
Data Table on Regional Comparison - Middle East and Africa

12.7.1 Saudi Arabia - Market size and forecast 2025-2030

Chart on Saudi Arabia - Market size and forecast 2025-2030 ($ million)
Data Table on Saudi Arabia - Market size and forecast 2025-2030 ($ million)
Chart on Saudi Arabia - Year-over-year growth 2025-2030 (%)
Data Table on Saudi Arabia - Year-over-year growth 2025-2030 (%)

12.7.2 UAE - Market size and forecast 2025-2030

Chart on UAE - Market size and forecast 2025-2030 ($ million)
Data Table on UAE - Market size and forecast 2025-2030 ($ million)
Chart on UAE - Year-over-year growth 2025-2030 (%)
Data Table on UAE - Year-over-year growth 2025-2030 (%)

12.7.3 South Africa - Market size and forecast 2025-2030

Chart on South Africa - Market size and forecast 2025-2030 ($ million)
Data Table on South Africa - Market size and forecast 2025-2030 ($ million)
Chart on South Africa - Year-over-year growth 2025-2030 (%)
Data Table on South Africa - Year-over-year growth 2025-2030 (%)

12.7.4 Israel - Market size and forecast 2025-2030

Chart on Israel - Market size and forecast 2025-2030 ($ million)
Data Table on Israel - Market size and forecast 2025-2030 ($ million)
Chart on Israel - Year-over-year growth 2025-2030 (%)
Data Table on Israel - Year-over-year growth 2025-2030 (%)

12.7.5 Turkey - Market size and forecast 2025-2030

Chart on Turkey - Market size and forecast 2025-2030 ($ million)
Data Table on Turkey - Market size and forecast 2025-2030 ($ million)
Chart on Turkey - Year-over-year growth 2025-2030 (%)
Data Table on Turkey - Year-over-year growth 2025-2030 (%)

12.8 Market opportunity by geography

Market opportunity by geography ($ million)
Data Tables on Market opportunity by geography ($ million)

13. Drivers, Challenges, and Opportunity

13.1 Market drivers

Surging global demand for high-yield agricultural inputs
Technological advancements in extraction and production methods
Diversification of applications in industrial and pharmaceutical sectors

13.2 Market challenges

Volatility in raw material prices and supply chain disruptions
Stringent environmental regulations and sustainability compliance costs
Impact of currency exchange rate fluctuations on import-dependent markets

13.3 Impact of drivers and challenges

Impact of drivers and challenges in 2025 and 2030

13.4 Market opportunities

Intensification of global food security initiatives and precision agriculture
Acceleration of sustainable mining and green potash production
Strategic supply chain realignment and investment in domestic production

14. Competitive Landscape

14.1 Overview

14.2

Overview on criticality of inputs and factors of differentiation

14.3 Landscape disruption

Overview on factors of disruption

14.4 Industry risks

Impact of key risks on business

15. Competitive Analysis

15.1 Companies profiled

Companies covered

15.2 Company ranking index

15.3 Market positioning of companies

Matrix on companies position and classification

15.4 Arab Potash Co. Plc

Arab Potash Co. Plc - Overview
Arab Potash Co. Plc - Product / Service
Arab Potash Co. Plc - Key offerings
SWOT

15.5 Cargill Inc.

Cargill Inc. - Overview
Cargill Inc. - Product / Service
Cargill Inc. - Key offerings
SWOT

15.6 Compass Minerals International Inc.

Compass Minerals International Inc. - Overview
Compass Minerals International Inc. - Business segments
Compass Minerals International Inc. - Key offerings
Compass Minerals International Inc. - Segment focus
SWOT

15.7 EuroChem Group AG

EuroChem Group AG - Overview
EuroChem Group AG - Product / Service
EuroChem Group AG - Key offerings
SWOT

15.8 Haifa Negev technologies Ltd.

Haifa Negev technologies Ltd. - Overview
Haifa Negev technologies Ltd. - Product / Service
Haifa Negev technologies Ltd. - Key offerings
SWOT

15.9 Intrepid Potash Inc.

Intrepid Potash Inc. - Overview
Intrepid Potash Inc. - Product / Service
Intrepid Potash Inc. - Key offerings
SWOT

15.10 Israel Chemicals Ltd.

Israel Chemicals Ltd. - Overview
Israel Chemicals Ltd. - Business segments
Israel Chemicals Ltd. - Key offerings
Israel Chemicals Ltd. - Segment focus
SWOT

15.11 KS Aktiengesellschaft

KS Aktiengesellschaft - Overview
KS Aktiengesellschaft - Product / Service
KS Aktiengesellschaft - Key offerings
SWOT

15.12 Nutrien Ltd.

Nutrien Ltd. - Overview
Nutrien Ltd. - Business segments
Nutrien Ltd. - Key offerings
Nutrien Ltd. - Segment focus
SWOT

15.13 Qinghai Salt Lake Industry Co.,Ltd

Qinghai Salt Lake Industry Co.,Ltd - Overview
Qinghai Salt Lake Industry Co.,Ltd - Product / Service
Qinghai Salt Lake Industry Co.,Ltd - Key offerings
SWOT

15.14 Spectrum Chemical Mfg. Corp.

Spectrum Chemical Mfg. Corp. - Overview
Spectrum Chemical Mfg. Corp. - Product / Service
Spectrum Chemical Mfg. Corp. - Key offerings
SWOT

15.15 SQM S.A.

SQM S.A. - Overview
SQM S.A. - Business segments
SQM S.A. - Key news
SQM S.A. - Key offerings
SQM S.A. - Segment focus
SWOT

15.16 The Mosaic Co.

The Mosaic Co. - Overview
The Mosaic Co. - Business segments
The Mosaic Co. - Key offerings
The Mosaic Co. - Segment focus
SWOT

15.17 Upsher Smith Laboratories LLC

Upsher Smith Laboratories LLC - Overview
Upsher Smith Laboratories LLC - Product / Service
Upsher Smith Laboratories LLC - Key offerings
SWOT

15.18 Yara International ASA

Yara International ASA - Overview
Yara International ASA - Business segments
Yara International ASA - Key offerings
Yara International ASA - Segment focus
SWOT

16. Appendix

16.1 Scope of the report

Market definition
Objectives
Notes and caveats

16.2 Inclusions and exclusions checklist

Inclusions checklist
Exclusions checklist

16.3 Currency conversion rates for US$

16.4 Research methodology

16.5 Data procurement

Information sources

16.6 Data validation

16.7 Validation techniques employed for market sizing

16.8 Data synthesis

16.9 360 degree market analysis

16.10 List of abbreviations

Research Methodology

Technavio presents a detailed picture of the market by way of study, synthesis, and summation of data from multiple sources. The analysts have presented the various facets of the market with a particular focus on identifying the key industry influencers. The data thus presented is comprehensive, reliable, and the result of extensive research, both primary and secondary.

INFORMATION SOURCES

Primary sources

  • Manufacturers and suppliers
  • Channel partners
  • Industry experts
  • Strategic decision makers

Secondary sources

  • Industry journals and periodicals
  • Government data
  • Financial reports of key industry players
  • Historical data
  • Press releases

DATA ANALYSIS

Data Synthesis

  • Collation of data
  • Estimation of key figures
  • Analysis of derived insights

Data Validation

  • Triangulation with data models
  • Reference against proprietary databases
  • Corroboration with industry experts

REPORT WRITING

Qualitative

  • Market drivers
  • Market challenges
  • Market trends
  • Five forces analysis

Quantitative

  • Market size and forecast
  • Market segmentation
  • Geographical insights
  • Competitive landscape

Interested in this report?

Get your sample now to see our research methodology and insights!

Download Now

Frequently Asked Questions

Potassium Chloride market growth will increase by USD 4490.7 million during 2026-2030.

The Potassium Chloride market is expected to grow at a CAGR of 4.1% during 2026-2030.

Potassium Chloride market is segmented by Application (Fertilizer, Industrial, Pharmaceutical, Others) Grade type (Technical grade, Pharmaceutical grade, Food grade) Type (Less than 99 percent purity, Greater than 99 percent purity)

Annexe Chem, Arab Potash Co. Plc, Avantor Inc., Cargill Inc., Compass Minerals International Inc., Ennore India Chemical Int., EuroChem Group AG, Haifa Negev technologies Ltd., Intrepid Potash Inc., Israel Chemicals Ltd., JSC Belarusian Potash Co., KS Aktiengesellschaft, Nutrien Ltd., Qinghai Salt Lake Industry Co.,Ltd, Sinofert Holdings Ltd., Spectrum Chemical Mfg. Corp., SQM S.A., The Mosaic Co., Upsher Smith Laboratories LLC, Yara International ASA are a few of the key vendors in the Potassium Chloride market.

APAC will register the highest growth rate of 36.9% among the other regions. Therefore, the Potassium Chloride market in APAC is expected to garner significant business opportunities for the vendors during the forecast period.

China, India, Indonesia, Australia, Japan, South Korea, US, Canada, Mexico, France, Germany, Italy, Spain, UK, The Netherlands, Brazil, Argentina, Colombia, Saudi Arabia, UAE, South Africa, Israel, Turkey

  • Surging global demand for high-yield agricultural inputs is the driving factor this market.

The Potassium Chloride market vendors should focus on grabbing business opportunities from the Application segment as it accounted for the largest market share in the base year.