Polyurea Market Analysis, Size, and Forecast 2025-2029: North America (US, Canada, and Mexico), Europe (Germany, UK, and France), APAC (China, India, and Japan), Middle East and Africa (Saudi Arabia, UAE, and South Africa), South America (Brazil and Argentina), and Rest of World (ROW)

Polyurea Market Analysis, Size, and Forecast 2025-2029:
North America (US, Canada, and Mexico), Europe (Germany, UK, and France), APAC (China, India, and Japan), Middle East and Africa (Saudi Arabia, UAE, and South Africa), South America (Brazil and Argentina), and Rest of World (ROW)

Published: Dec 2025 289 Pages SKU: IRTNTR73461

Market Overview at a Glance

$503.7 Mn
Market Opportunity
6.5%
CAGR 2024 - 2029
37.5%
North America Growth
$991.8 Mn
Coatings segment 2023

Polyurea Market Size 2025-2029

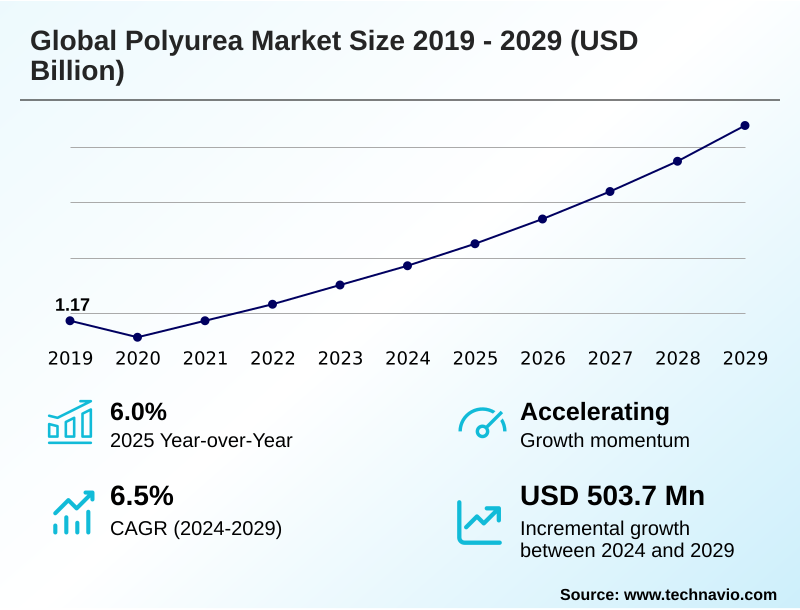
The polyurea market size is valued to increase by USD 503.7 million, at a CAGR of 6.5% from 2024 to 2029. Accelerated expansion of the global construction industry will drive the polyurea market.

Major Market Trends & Insights

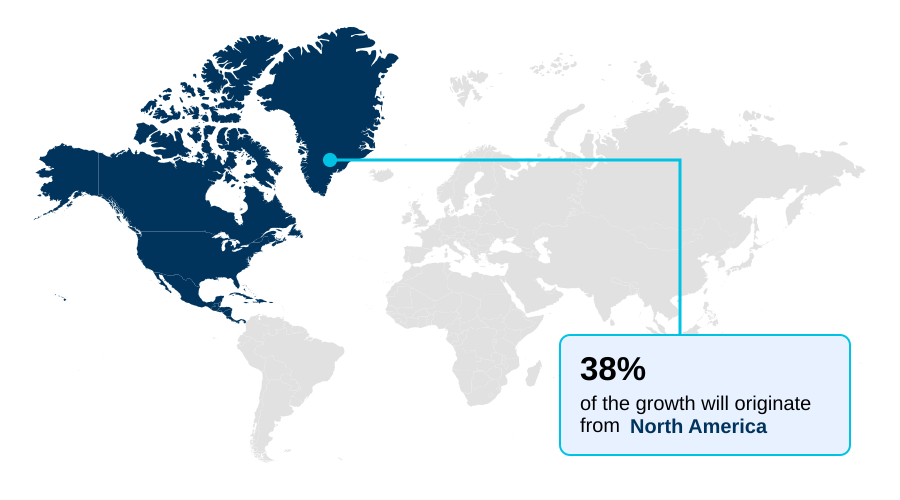
  • North America dominated the market and accounted for a 37.5% growth during the forecast period.
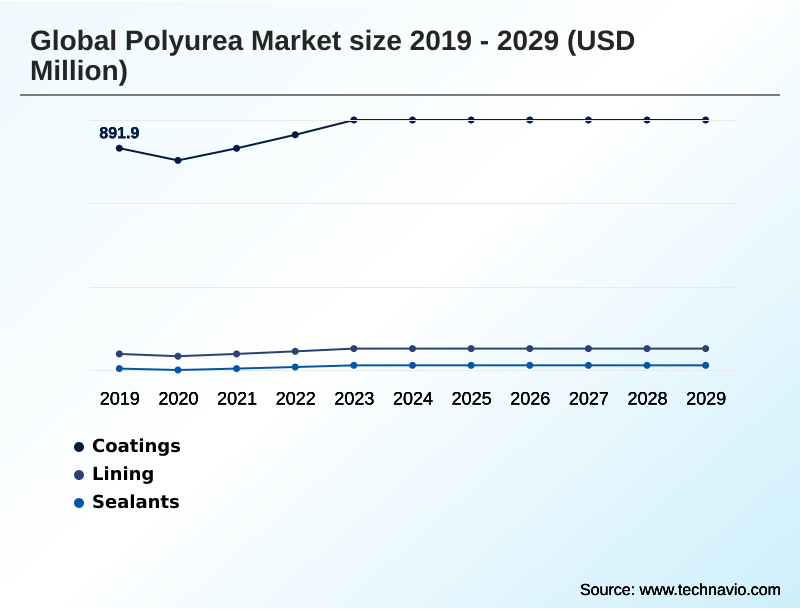
  • By Product - Coatings segment was valued at USD 991.8 million in 2023
  • By Raw Material - Aliphatic segment accounted for the largest market revenue share in 2023

Market Size & Forecast

  • Market Opportunities: USD 708.5 million
  • Market Future Opportunities: USD 503.7 million
  • CAGR from 2024 to 2029 : 6.5%

Market Summary

  • The polyurea market is defined by its high-performance elastomeric coatings, which are derived from the reaction of an isocyanate component with an amine-terminated resin blend. This step-growth polymerization process yields materials with exceptional high tensile strength, crack-bridging capabilities, and moisture insensitivity, making them ideal for demanding applications.
  • Key drivers include the expansion of the global construction industry and the increasing adoption in the automotive sector for applications like durable truck bed liners. A significant trend is the industry's pivot toward sustainability, with the development of bio-based polyurea and low-VOC formulations.
  • For instance, a project manager for a major bridge rehabilitation project must weigh the higher initial investment for a polyurea system, which offers rapid curing and long-term durability, against a lower-cost epoxy system that requires longer downtime and more frequent maintenance. This decision highlights the trade-offs between upfront capital expenditure and long-term operational efficiency.
  • Challenges such as volatile raw material pricing and competition from alternative technologies like polyaspartic topcoats persist, pushing vendors toward innovation in both chemistry and polyurea application technology to maintain a competitive edge and expand into new sectors.

What will be the Size of the Polyurea Market during the forecast period?

Get Key Insights on Market Forecast (PDF) Request Free Sample

How is the Polyurea Market Segmented?

The polyurea industry research report provides comprehensive data (region-wise segment analysis), with forecasts and estimates in "USD million" for the period 2025-2029, as well as historical data from 2019-2023 for the following segments.

  • Product
    • Coatings
    • Lining
    • Sealants
  • Raw material
    • Aliphatic
    • Aromatic
  • Type
    • Hot polyurea
    • Cold polyurea
  • Geography
    • North America
      • US
      • Canada
      • Mexico
    • Europe
      • Germany
      • UK
      • France
    • APAC
      • China
      • India
      • Japan
    • Middle East and Africa
      • Saudi Arabia
      • UAE
      • South Africa
    • South America
      • Brazil
      • Argentina
    • Rest of World (ROW)

By Product Insights

The coatings segment is estimated to witness significant growth during the forecast period.

The market is segmented by product, raw material, and type, with coatings representing a primary application. Innovations in plural-component systems are enhancing product capabilities, including superior chemical resistance. Formulations with low-VOC content are gaining traction, driven by environmental standards.

For instance, the integration of nano-silica has been shown to improve abrasion resistance by up to 35%, expanding use cases in high-wear environments.

The development of advanced polyurea application technology allows for the creation of a seamless membrane ideal for industrial flooring solutions and protective linings for tanks.

Both aliphatic isocyanates and aromatic isocyanates are used, influencing properties like UV stability and cost, which are critical for applications from roof coating restoration to marine and offshore coatings.

Request Free Sample

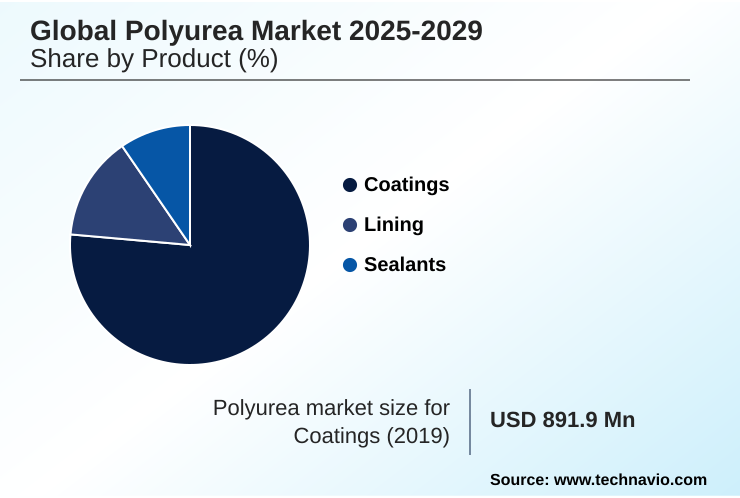
The Coatings segment was valued at USD 991.8 million in 2023 and showed a gradual increase during the forecast period.

Request Free Sample

Regional Analysis

North America is estimated to contribute 37.5% to the growth of the global market during the forecast period.Technavio’s analysts have elaborately explained the regional trends and drivers that shape the market during the forecast period.

See How Polyurea Market Demand is Rising in North America Request Free Sample

The geographic landscape of the polyurea market is diverse, with North America representing the largest share at approximately 37.5% of the market, driven by extensive infrastructure rehabilitation and industrial maintenance.

The region's demand is centered on applications like bridge deck waterproofing and secondary containment liners. In contrast, the APAC region is the fastest-growing market, contributing over 25.6% and expanding at a more rapid pace than mature markets.

This growth is fueled by large-scale construction and manufacturing activities in countries like China and India, where there is a high demand for fast-curing flooring systems and protective linings for tanks.

Europe focuses on sustainable solutions, promoting low-VOC formulations and cold-applied polyurea repair products. The Middle East shows strong potential due to mega-projects requiring vast quantities of high-performance coatings.

Market Dynamics

Our researchers analyzed the data with 2024 as the base year, along with the key drivers, trends, and challenges. A holistic analysis of drivers will help companies refine their marketing strategies to gain a competitive advantage.

  • Strategic decision-making in the polyurea market often revolves around a detailed cost analysis of polyurea vs epoxy flooring, where factors like long-term durability and the benefits of fast-curing flooring systems must be considered.
  • The choice between aliphatic vs aromatic polyurea for outdoor use is another critical consideration, with aliphatic variants offering superior UV resistance for applications like spray-applied waterproofing for commercial roofs and polyurea for rv roof leak prevention. For interior or protected applications, aromatic systems are a cost-effective choice.
  • Innovations are also making solutions more accessible, such as cold-applied polyurea for diy garage floors. For industrial settings, the discussion shifts to technical specifications. Using polyurea for secondary containment compliance is essential in regulated industries, while polyurea lining for potable water tanks requires certified, non-toxic formulations.
  • The material's versatility is highlighted when choosing the right polyurea for bridge decks, which demands exceptional crack-bridging and waterproofing. In the energy and defense sectors, specialized formulas are used for blast mitigation projects. Hand-applied polyurea for waterproofing repairs offers a practical solution for smaller jobs, contrasting with high-pressure systems used for large-scale projects like mining equipment protection.
  • Polyurea performance in marine environments is tested by constant exposure to corrosive elements, necessitating robust formulations. The fundamental polyurea versus polyurethane coating differences lie in cure time and moisture sensitivity, with polyurea offering a distinct advantage in rapid-return-to-service scenarios, often reducing project schedules by more than 50% compared to traditional systems, directly impacting operational planning and labor costs.

What are the key market drivers leading to the rise in the adoption of Polyurea Industry?

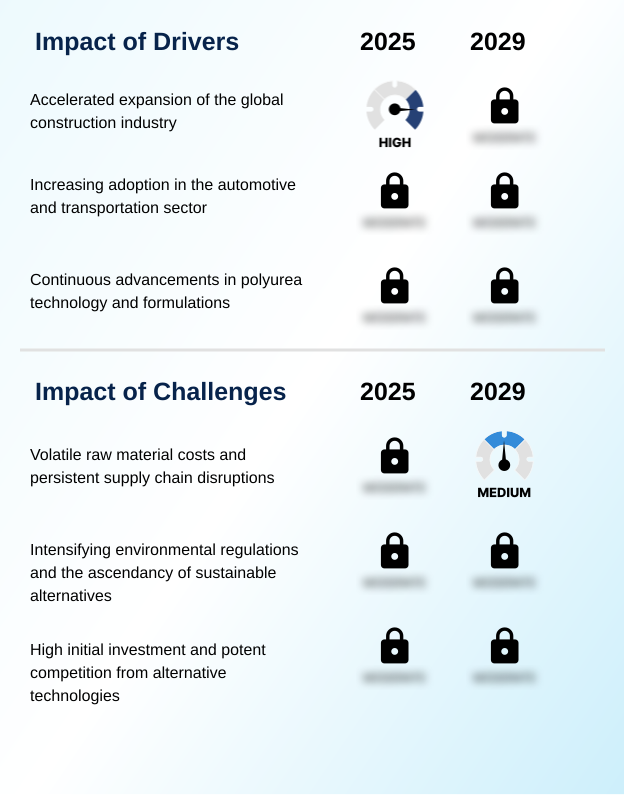
  • The accelerated expansion of the global construction industry serves as a key driver for market growth.

  • Robust growth in the global construction and automotive sectors serves as a primary driver for the market.
  • In construction, polyurea is specified for its rapid curing times and ability to form a durable, seamless membrane, essential for waterproofing and protecting infrastructure.
  • The material's high tensile strength and chemical resistance are critical for applications such as concrete surface preparation and linings.
  • In the automotive industry, which saw global production exceed 93 million units, polyurea is used for durable truck bed liners and protective underbody coatings. Continuous innovation in formulations is also expanding the market.
  • For example, research into nano-silica integration has demonstrated a 35% improvement in abrasion resistance, creating more resilient surfaces for industrial flooring solutions and parking garage deck coatings, thereby opening new opportunities and ensuring sustained demand.

What are the market trends shaping the Polyurea Industry?

  • An intensified focus on sustainable and eco-friendly formulations is emerging as a significant market trend. This shift is driven by increasing regulatory pressures and growing demand for greener material solutions.

  • A significant trend shaping the market is the expansion into specialized, high-performance applications driven by technological advancements. The electric vehicle sector, for instance, represents a major new frontier, with demand for protective coatings for EV batteries growing as global sales approach 15 million units annually. These coatings leverage polyurea's excellent insulation and impact resistance.
  • Concurrently, the industry is making strides in sustainability, exemplified by the development of bio-based polyurea formulations containing up to 30% renewable content without compromising performance. This aligns with the demand for greener building materials and low-VOC formulation products.
  • Innovations in polyurea application technology, including more efficient high-pressure spray systems, are making these advanced materials more accessible for large-scale projects like wastewater treatment tank linings and commercial kitchen flooring, enhancing both productivity and finish quality.

What challenges does the Polyurea Industry face during its growth?

  • Volatile raw material costs and persistent supply chain disruptions present a key challenge affecting industry growth.

  • A primary challenge for the market is the high initial investment in plural-component systems and specialized equipment, which can be a significant barrier for smaller contractors. These costs, sometimes exceeding conventional systems by a factor of three, are compounded by the need for skilled technicians trained in specific polyurea application technology.
  • Furthermore, intense competition from alternative technologies like epoxy and polyurethane coatings, which are often perceived as more cost-effective for less demanding applications, constrains market penetration.
  • The market also grapples with raw material price volatility, with key inputs like isocyanates experiencing price swings that can exceed 20% in a single quarter, directly impacting the cost of elastomeric coatings and high-solids coatings and making it difficult to maintain stable pricing for end-users.

Exclusive Technavio Analysis on Customer Landscape

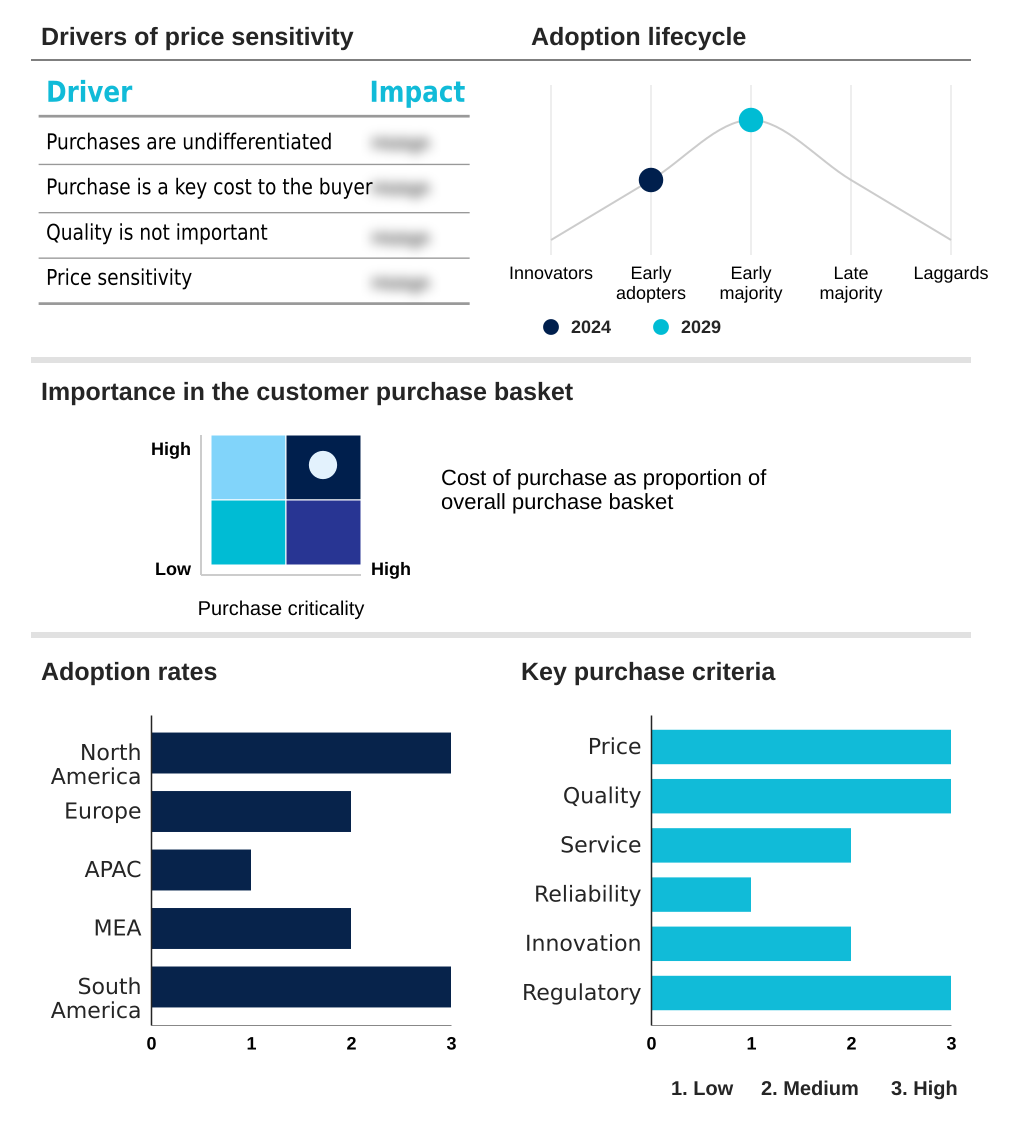
The polyurea market forecasting report includes the adoption lifecycle of the market, covering from the innovator’s stage to the laggard’s stage. It focuses on adoption rates in different regions based on penetration. Furthermore, the polyurea market report also includes key purchase criteria and drivers of price sensitivity to help companies evaluate and develop their market growth analysis strategies.

Customer Landscape of Polyurea Industry

Competitive Landscape

Companies are implementing various strategies, such as strategic alliances, polyurea market forecast, partnerships, mergers and acquisitions, geographical expansion, and product/service launches, to enhance their presence in the industry.

American Polymers Corp. - The company offers specialized protective coatings, linings, and joint fillers, focusing on pure polyurea and hybrid elastomer technologies for demanding industrial and commercial applications.

The industry research and growth report includes detailed analyses of the competitive landscape of the market and information about key companies, including:

  • American Polymers Corp.
  • ArmorThane USA Inc.
  • BASF SE
  • Covestro AG
  • Dorf Ketal Chemicals India Pvt. Ltd.
  • Huntsman International LLC
  • Krypton Chemical S.L.
  • Marvel Coatings
  • Nukote Coating Systems Intl.
  • POLYFLEX AND WASSER
  • PPG Industries Inc.
  • Rhino Linings Corp.
  • Scorpion Protective Coatings Inc.
  • Specialty Products Inc.
  • Sprayroq Inc.
  • TECNOPOL SISTEMAS S.L.
  • Teknos Group Oy
  • The Sherwin Williams Co.
  • VersaFlex Inc.
  • VIP Coatings International GmbH and Co. KG

Qualitative and quantitative analysis of companies has been conducted to help clients understand the wider business environment as well as the strengths and weaknesses of key industry players. Data is qualitatively analyzed to categorize companies as pure play, category-focused, industry-focused, and diversified; it is quantitatively analyzed to categorize companies as dominant, leading, strong, tentative, and weak.

Recent Development and News in Polyurea market

  • In September, 2024, Delta Coatings International announced a strategic expansion into Vietnam and the broader Southeast Asian region, signaling confidence in the region's growth potential for high-performance coatings.
  • In September, 2024, Sika launched Sikaflex-403 Tank and Silo, an advanced sealant developed to offer outstanding resistance to chemicals and organic acids for sealing bolted steel tanks and silos.
  • In November, 2024, PPG secured its 50th order for the electrostatic application of its marine fouling control coatings, which will utilize a polyurea-based product on a large oil tanker in Oman.
  • In February, 2025, a strategic alliance was formed between UAE and Italian firms to revolutionize water infrastructure development across the Middle East and Africa, focusing on desalination and treatment plants where corrosion protection is paramount.

Dive into Technavio’s robust research methodology, blending expert interviews, extensive data synthesis, and validated models for unparalleled Polyurea Market insights. See full methodology.

Market Scope
Page number 289
Base year 2024
Historic period 2019-2023
Forecast period 2025-2029
Growth momentum & CAGR Accelerate at a CAGR of 6.5%
Market growth 2025-2029 USD 503.7 million
Market structure Fragmented
YoY growth 2024-2025(%) 6.0%
Key countries US, Canada, Mexico, Germany, UK, France, Italy, Spain, The Netherlands, China, India, Japan, South Korea, Indonesia, Australia, Saudi Arabia, UAE, South Africa, Qatar, Egypt, Brazil, Argentina and Chile
Competitive landscape Leading Companies, Market Positioning of Companies, Competitive Strategies, and Industry Risks

Request Free Sample

Research Analyst Overview

  • The polyurea market is characterized by continuous innovation in material science, focusing on enhancing performance attributes such as abrasion resistance and flame retardancy. The use of both aliphatic isocyanates and aromatic isocyanates allows for a broad spectrum of applications, from aesthetically critical topcoats to robust base layers.
  • A key technological advancement involves the integration of nano-silica into plural-component systems, which has been shown to increase abrasion resistance by 35%. This drive for enhanced durability is pivotal as the material finds use in demanding environments requiring blast and impact protection or geotextile reinforcement.
  • Boardroom decisions are increasingly influenced by sustainability, pushing R&D toward bio-based polyurea and low-VOC formulation development. These elastomeric coatings create a seamless membrane with exceptional crack-bridging capabilities and high tensile strength, ideal for everything from potable water-certified lining to fast-cure coatings for industrial floors.
  • The development of hybrid polyurea systems and ceramic-reinforced polyurea further expands the application scope, while techniques like electrostatic application improve efficiency. This focus on advanced, specialized materials with properties like moisture insensitivity underscores the industry's direction toward high-value, performance-driven solutions.

What are the Key Data Covered in this Polyurea Market Research and Growth Report?

  • What is the expected growth of the Polyurea Market between 2025 and 2029?

    • USD 503.7 million, at a CAGR of 6.5%

  • What segmentation does the market report cover?

    • The report is segmented by Product (Coatings, Lining, and Sealants), Raw Material (Aliphatic, and Aromatic), Type (Hot Polyurea, and Cold Polyurea) and Geography (North America, Europe, APAC, Middle East and Africa, South America)

  • Which regions are analyzed in the report?

    • North America, Europe, APAC, Middle East and Africa and South America

  • What are the key growth drivers and market challenges?

    • Accelerated expansion of the global construction industry, Volatile raw material costs and persistent supply chain disruptions

  • Who are the major players in the Polyurea Market?

    • American Polymers Corp., ArmorThane USA Inc., BASF SE, Covestro AG, Dorf Ketal Chemicals India Pvt. Ltd., Huntsman International LLC, Krypton Chemical S.L., Marvel Coatings, Nukote Coating Systems Intl., POLYFLEX AND WASSER, PPG Industries Inc., Rhino Linings Corp., Scorpion Protective Coatings Inc., Specialty Products Inc., Sprayroq Inc., TECNOPOL SISTEMAS S.L., Teknos Group Oy, The Sherwin Williams Co., VersaFlex Inc. and VIP Coatings International GmbH and Co. KG

Market Research Insights

  • Market dynamics are heavily influenced by the push for advanced material performance and efficiency. Formulations incorporating aliphatic isocyanates offer superior UV stability, crucial for outdoor applications, while aromatic systems provide a cost-effective solution for uses not exposed to sunlight.
  • Innovations in polyurea application technology, including high-pressure spray systems, enable rapid installation of protective coatings for EV batteries and waterproofing membranes for roofing, reducing project timelines significantly. The development of bio-based polyurea with up to 30% renewable content caters to rising sustainability mandates.
  • Furthermore, research has shown that integrating nano-additives can increase abrasion resistance by 35%, enhancing durability for industrial flooring solutions. The versatility is evident in applications ranging from corrosion protection for pipelines to flexible joint fillers and spray-applied structural rehabilitation, demonstrating the material's adaptability to diverse industrial needs.

We can help! Our analysts can customize this polyurea market research report to meet your requirements.

Get in touch

1. Executive Summary

1.1 Market overview

Executive Summary - Chart on Market Overview
Executive Summary - Data Table on Market Overview
Executive Summary - Chart on Global Market Characteristics
Executive Summary - Chart on Market by Geography
Executive Summary - Chart on Market Segmentation by Product
Executive Summary - Chart on Market Segmentation by Raw Material
Executive Summary - Chart on Market Segmentation by Type
Executive Summary - Chart on Incremental Growth
Executive Summary - Data Table on Incremental Growth
Executive Summary - Chart on Company Market Positioning

2. Technavio Analysis

2.1 Analysis of price sensitivity, lifecycle, customer purchase basket, adoption rates, and purchase criteria

2.2 Criticality of inputs and Factors of differentiation

Chart on Overview on criticality of inputs and factors of differentiation

2.3 Factors of disruption

Chart on Overview on factors of disruption

2.4 Impact of drivers and challenges

Chart on Impact of drivers and challenges in 2024 and 2029

3. Market Landscape

3.1 Market ecosystem

Chart on Parent Market
Data Table on - Parent Market

3.2 Market characteristics

Chart on Market characteristics analysis

3.3 Value chain analysis

Chart on Value chain analysis

4. Market Sizing

4.1 Market definition

Data Table on Offerings of companies included in the market definition

4.2 Market segment analysis

Market segments

4.3 Market size 2024

4.4 Market outlook: Forecast for 2024-2029

Chart on Global - Market size and forecast 2024-2029 ($ million)
Data Table on Global - Market size and forecast 2024-2029 ($ million)
Chart on Global Market: Year-over-year growth 2024-2029 (%)
Data Table on Global Market: Year-over-year growth 2024-2029 (%)

5. Historic Market Size

5.1 Global Polyurea Market 2019 - 2023

Historic Market Size - Data Table on Global Polyurea Market 2019 - 2023 ($ million)

5.2 Product segment analysis 2019 - 2023

Historic Market Size - Product Segment 2019 - 2023 ($ million)

5.3 Raw Material segment analysis 2019 - 2023

Historic Market Size - Raw Material Segment 2019 - 2023 ($ million)

5.4 Type segment analysis 2019 - 2023

Historic Market Size - Type Segment 2019 - 2023 ($ million)

5.5 Geography segment analysis 2019 - 2023

Historic Market Size - Geography Segment 2019 - 2023 ($ million)

5.6 Country segment analysis 2019 - 2023

Historic Market Size - Country Segment 2019 - 2023 ($ million)

6. Qualitative Analysis

6.1 Impact of AI on Global Polyurea Market

7. Five Forces Analysis

7.1 Five forces summary

Five forces analysis - Comparison between 2024 and 2029

7.2 Bargaining power of buyers

Bargaining power of buyers - Impact of key factors 2024 and 2029

7.3 Bargaining power of suppliers

Bargaining power of suppliers - Impact of key factors in 2024 and 2029

7.4 Threat of new entrants

Threat of new entrants - Impact of key factors in 2024 and 2029

7.5 Threat of substitutes

Threat of substitutes - Impact of key factors in 2024 and 2029

7.6 Threat of rivalry

Threat of rivalry - Impact of key factors in 2024 and 2029

7.7 Market condition

Chart on Market condition - Five forces 2024 and 2029

8. Market Segmentation by Product

8.1 Market segments

Chart on Product - Market share 2024-2029 (%)
Data Table on Product - Market share 2024-2029 (%)

8.2 Comparison by Product

Chart on Comparison by Product
Data Table on Comparison by Product

8.3 Coatings - Market size and forecast 2024-2029

Chart on Coatings - Market size and forecast 2024-2029 ($ million)
Data Table on Coatings - Market size and forecast 2024-2029 ($ million)
Chart on Coatings - Year-over-year growth 2024-2029 (%)
Data Table on Coatings - Year-over-year growth 2024-2029 (%)

8.4 Lining - Market size and forecast 2024-2029

Chart on Lining - Market size and forecast 2024-2029 ($ million)
Data Table on Lining - Market size and forecast 2024-2029 ($ million)
Chart on Lining - Year-over-year growth 2024-2029 (%)
Data Table on Lining - Year-over-year growth 2024-2029 (%)

8.5 Sealants - Market size and forecast 2024-2029

Chart on Sealants - Market size and forecast 2024-2029 ($ million)
Data Table on Sealants - Market size and forecast 2024-2029 ($ million)
Chart on Sealants - Year-over-year growth 2024-2029 (%)
Data Table on Sealants - Year-over-year growth 2024-2029 (%)

8.6 Market opportunity by Product

Market opportunity by Product ($ million)
Data Table on Market opportunity by Product ($ million)

9. Market Segmentation by Raw Material

9.1 Market segments

Chart on Raw Material - Market share 2024-2029 (%)
Data Table on Raw Material - Market share 2024-2029 (%)

9.2 Comparison by Raw Material

Chart on Comparison by Raw Material
Data Table on Comparison by Raw Material

9.3 Aliphatic - Market size and forecast 2024-2029

Chart on Aliphatic - Market size and forecast 2024-2029 ($ million)
Data Table on Aliphatic - Market size and forecast 2024-2029 ($ million)
Chart on Aliphatic - Year-over-year growth 2024-2029 (%)
Data Table on Aliphatic - Year-over-year growth 2024-2029 (%)

9.4 Aromatic - Market size and forecast 2024-2029

Chart on Aromatic - Market size and forecast 2024-2029 ($ million)
Data Table on Aromatic - Market size and forecast 2024-2029 ($ million)
Chart on Aromatic - Year-over-year growth 2024-2029 (%)
Data Table on Aromatic - Year-over-year growth 2024-2029 (%)

9.5 Market opportunity by Raw Material

Market opportunity by Raw Material ($ million)
Data Table on Market opportunity by Raw Material ($ million)

10. Market Segmentation by Type

10.1 Market segments

Chart on Type - Market share 2024-2029 (%)
Data Table on Type - Market share 2024-2029 (%)

10.2 Comparison by Type

Chart on Comparison by Type
Data Table on Comparison by Type

10.3 Hot polyurea - Market size and forecast 2024-2029

Chart on Hot polyurea - Market size and forecast 2024-2029 ($ million)
Data Table on Hot polyurea - Market size and forecast 2024-2029 ($ million)
Chart on Hot polyurea - Year-over-year growth 2024-2029 (%)
Data Table on Hot polyurea - Year-over-year growth 2024-2029 (%)

10.4 Cold polyurea - Market size and forecast 2024-2029

Chart on Cold polyurea - Market size and forecast 2024-2029 ($ million)
Data Table on Cold polyurea - Market size and forecast 2024-2029 ($ million)
Chart on Cold polyurea - Year-over-year growth 2024-2029 (%)
Data Table on Cold polyurea - Year-over-year growth 2024-2029 (%)

10.5 Market opportunity by Type

Market opportunity by Type ($ million)
Data Table on Market opportunity by Type ($ million)

11. Customer Landscape

11.1 Customer landscape overview

Analysis of price sensitivity, lifecycle, customer purchase basket, adoption rates, and purchase criteria

12. Geographic Landscape

12.1 Geographic segmentation

Chart on Market share by geography 2024-2029 (%)
Data Table on Market share by geography 2024-2029 (%)

12.2 Geographic comparison

Chart on Geographic comparison
Data Table on Geographic comparison

12.3 North America - Market size and forecast 2024-2029

Chart on North America - Market size and forecast 2024-2029 ($ million)
Data Table on North America - Market size and forecast 2024-2029 ($ million)
Chart on North America - Year-over-year growth 2024-2029 (%)
Data Table on North America - Year-over-year growth 2024-2029 (%)
Chart on Regional Comparison - North America
Data Table on Regional Comparison - North America

12.3.1 US - Market size and forecast 2024-2029

Chart on US - Market size and forecast 2024-2029 ($ million)
Data Table on US - Market size and forecast 2024-2029 ($ million)
Chart on US - Year-over-year growth 2024-2029 (%)
Data Table on US - Year-over-year growth 2024-2029 (%)

12.3.2 Canada - Market size and forecast 2024-2029

Chart on Canada - Market size and forecast 2024-2029 ($ million)
Data Table on Canada - Market size and forecast 2024-2029 ($ million)
Chart on Canada - Year-over-year growth 2024-2029 (%)
Data Table on Canada - Year-over-year growth 2024-2029 (%)

12.3.3 Mexico - Market size and forecast 2024-2029

Chart on Mexico - Market size and forecast 2024-2029 ($ million)
Data Table on Mexico - Market size and forecast 2024-2029 ($ million)
Chart on Mexico - Year-over-year growth 2024-2029 (%)
Data Table on Mexico - Year-over-year growth 2024-2029 (%)

12.4 Europe - Market size and forecast 2024-2029

Chart on Europe - Market size and forecast 2024-2029 ($ million)
Data Table on Europe - Market size and forecast 2024-2029 ($ million)
Chart on Europe - Year-over-year growth 2024-2029 (%)
Data Table on Europe - Year-over-year growth 2024-2029 (%)
Chart on Regional Comparison - Europe
Data Table on Regional Comparison - Europe

12.4.1 Germany - Market size and forecast 2024-2029

Chart on Germany - Market size and forecast 2024-2029 ($ million)
Data Table on Germany - Market size and forecast 2024-2029 ($ million)
Chart on Germany - Year-over-year growth 2024-2029 (%)
Data Table on Germany - Year-over-year growth 2024-2029 (%)

12.4.2 UK - Market size and forecast 2024-2029

Chart on UK - Market size and forecast 2024-2029 ($ million)
Data Table on UK - Market size and forecast 2024-2029 ($ million)
Chart on UK - Year-over-year growth 2024-2029 (%)
Data Table on UK - Year-over-year growth 2024-2029 (%)

12.4.3 France - Market size and forecast 2024-2029

Chart on France - Market size and forecast 2024-2029 ($ million)
Data Table on France - Market size and forecast 2024-2029 ($ million)
Chart on France - Year-over-year growth 2024-2029 (%)
Data Table on France - Year-over-year growth 2024-2029 (%)

12.4.4 Italy - Market size and forecast 2024-2029

Chart on Italy - Market size and forecast 2024-2029 ($ million)
Data Table on Italy - Market size and forecast 2024-2029 ($ million)
Chart on Italy - Year-over-year growth 2024-2029 (%)
Data Table on Italy - Year-over-year growth 2024-2029 (%)

12.4.5 Spain - Market size and forecast 2024-2029

Chart on Spain - Market size and forecast 2024-2029 ($ million)
Data Table on Spain - Market size and forecast 2024-2029 ($ million)
Chart on Spain - Year-over-year growth 2024-2029 (%)
Data Table on Spain - Year-over-year growth 2024-2029 (%)

12.4.6 The Netherlands - Market size and forecast 2024-2029

Chart on The Netherlands - Market size and forecast 2024-2029 ($ million)
Data Table on The Netherlands - Market size and forecast 2024-2029 ($ million)
Chart on The Netherlands - Year-over-year growth 2024-2029 (%)
Data Table on The Netherlands - Year-over-year growth 2024-2029 (%)

12.5 APAC - Market size and forecast 2024-2029

Chart on APAC - Market size and forecast 2024-2029 ($ million)
Data Table on APAC - Market size and forecast 2024-2029 ($ million)
Chart on APAC - Year-over-year growth 2024-2029 (%)
Data Table on APAC - Year-over-year growth 2024-2029 (%)
Chart on Regional Comparison - APAC
Data Table on Regional Comparison - APAC

12.5.1 China - Market size and forecast 2024-2029

Chart on China - Market size and forecast 2024-2029 ($ million)
Data Table on China - Market size and forecast 2024-2029 ($ million)
Chart on China - Year-over-year growth 2024-2029 (%)
Data Table on China - Year-over-year growth 2024-2029 (%)

12.5.2 India - Market size and forecast 2024-2029

Chart on India - Market size and forecast 2024-2029 ($ million)
Data Table on India - Market size and forecast 2024-2029 ($ million)
Chart on India - Year-over-year growth 2024-2029 (%)
Data Table on India - Year-over-year growth 2024-2029 (%)

12.5.3 Japan - Market size and forecast 2024-2029

Chart on Japan - Market size and forecast 2024-2029 ($ million)
Data Table on Japan - Market size and forecast 2024-2029 ($ million)
Chart on Japan - Year-over-year growth 2024-2029 (%)
Data Table on Japan - Year-over-year growth 2024-2029 (%)

12.5.4 South Korea - Market size and forecast 2024-2029

Chart on South Korea - Market size and forecast 2024-2029 ($ million)
Data Table on South Korea - Market size and forecast 2024-2029 ($ million)
Chart on South Korea - Year-over-year growth 2024-2029 (%)
Data Table on South Korea - Year-over-year growth 2024-2029 (%)

12.5.5 Indonesia - Market size and forecast 2024-2029

Chart on Indonesia - Market size and forecast 2024-2029 ($ million)
Data Table on Indonesia - Market size and forecast 2024-2029 ($ million)
Chart on Indonesia - Year-over-year growth 2024-2029 (%)
Data Table on Indonesia - Year-over-year growth 2024-2029 (%)

12.5.6 Australia - Market size and forecast 2024-2029

Chart on Australia - Market size and forecast 2024-2029 ($ million)
Data Table on Australia - Market size and forecast 2024-2029 ($ million)
Chart on Australia - Year-over-year growth 2024-2029 (%)
Data Table on Australia - Year-over-year growth 2024-2029 (%)

12.6 Middle East and Africa - Market size and forecast 2024-2029

Chart on Middle East and Africa - Market size and forecast 2024-2029 ($ million)
Data Table on Middle East and Africa - Market size and forecast 2024-2029 ($ million)
Chart on Middle East and Africa - Year-over-year growth 2024-2029 (%)
Data Table on Middle East and Africa - Year-over-year growth 2024-2029 (%)
Chart on Regional Comparison - Middle East and Africa
Data Table on Regional Comparison - Middle East and Africa

12.6.1 Saudi Arabia - Market size and forecast 2024-2029

Chart on Saudi Arabia - Market size and forecast 2024-2029 ($ million)
Data Table on Saudi Arabia - Market size and forecast 2024-2029 ($ million)
Chart on Saudi Arabia - Year-over-year growth 2024-2029 (%)
Data Table on Saudi Arabia - Year-over-year growth 2024-2029 (%)

12.6.2 UAE - Market size and forecast 2024-2029

Chart on UAE - Market size and forecast 2024-2029 ($ million)
Data Table on UAE - Market size and forecast 2024-2029 ($ million)
Chart on UAE - Year-over-year growth 2024-2029 (%)
Data Table on UAE - Year-over-year growth 2024-2029 (%)

12.6.3 South Africa - Market size and forecast 2024-2029

Chart on South Africa - Market size and forecast 2024-2029 ($ million)
Data Table on South Africa - Market size and forecast 2024-2029 ($ million)
Chart on South Africa - Year-over-year growth 2024-2029 (%)
Data Table on South Africa - Year-over-year growth 2024-2029 (%)

12.6.4 Qatar - Market size and forecast 2024-2029

Chart on Qatar - Market size and forecast 2024-2029 ($ million)
Data Table on Qatar - Market size and forecast 2024-2029 ($ million)
Chart on Qatar - Year-over-year growth 2024-2029 (%)
Data Table on Qatar - Year-over-year growth 2024-2029 (%)

12.6.5 Egypt - Market size and forecast 2024-2029

Chart on Egypt - Market size and forecast 2024-2029 ($ million)
Data Table on Egypt - Market size and forecast 2024-2029 ($ million)
Chart on Egypt - Year-over-year growth 2024-2029 (%)
Data Table on Egypt - Year-over-year growth 2024-2029 (%)

12.7 South America - Market size and forecast 2024-2029

Chart on South America - Market size and forecast 2024-2029 ($ million)
Data Table on South America - Market size and forecast 2024-2029 ($ million)
Chart on South America - Year-over-year growth 2024-2029 (%)
Data Table on South America - Year-over-year growth 2024-2029 (%)
Chart on Regional Comparison - South America
Data Table on Regional Comparison - South America

12.7.1 Brazil - Market size and forecast 2024-2029

Chart on Brazil - Market size and forecast 2024-2029 ($ million)
Data Table on Brazil - Market size and forecast 2024-2029 ($ million)
Chart on Brazil - Year-over-year growth 2024-2029 (%)
Data Table on Brazil - Year-over-year growth 2024-2029 (%)

12.7.2 Argentina - Market size and forecast 2024-2029

Chart on Argentina - Market size and forecast 2024-2029 ($ million)
Data Table on Argentina - Market size and forecast 2024-2029 ($ million)
Chart on Argentina - Year-over-year growth 2024-2029 (%)
Data Table on Argentina - Year-over-year growth 2024-2029 (%)

12.7.3 Chile - Market size and forecast 2024-2029

Chart on Chile - Market size and forecast 2024-2029 ($ million)
Data Table on Chile - Market size and forecast 2024-2029 ($ million)
Chart on Chile - Year-over-year growth 2024-2029 (%)
Data Table on Chile - Year-over-year growth 2024-2029 (%)

12.8 Market opportunity by geography

Market opportunity by geography ($ million)
Data Tables on Market opportunity by geography ($ million)

13. Drivers, Challenges, and Opportunity

13.1 Market drivers

Accelerated expansion of the global construction industry
Increasing adoption in the automotive and transportation sector
Continuous advancements in polyurea technology and formulations

13.2 Market challenges

Volatile raw material costs and persistent supply chain disruptions
Intensifying environmental regulations and the ascendancy of sustainable alternatives
High initial investment and potent competition from alternative technologies

13.3 Impact of drivers and challenges

Impact of drivers and challenges in 2024 and 2029

13.4 Market opportunities

Intensified focus on sustainable and eco-friendly polyurea formulations
Expansion into high-performance and specialized applications
Advancements in application technology and formulation innovation

14. Competitive Landscape

14.1 Overview

14.2

Overview on criticality of inputs and factors of differentiation

14.3 Landscape disruption

Overview on factors of disruption

14.4 Industry risks

Impact of key risks on business

15. Competitive Analysis

15.1 Companies profiled

Companies covered

15.2 Company ranking index

15.3 Market positioning of companies

Matrix on companies position and classification

15.4 American Polymers Corp.

American Polymers Corp. - Overview
American Polymers Corp. - Product / Service
American Polymers Corp. - Key offerings
SWOT

15.5 BASF SE

BASF SE - Overview
BASF SE - Business segments
BASF SE - Key news
BASF SE - Key offerings
BASF SE - Segment focus
SWOT

15.6 Covestro AG

Covestro AG - Overview
Covestro AG - Business segments
Covestro AG - Key news
Covestro AG - Key offerings
Covestro AG - Segment focus
SWOT

15.7 Huntsman International LLC

Huntsman International LLC - Overview
Huntsman International LLC - Business segments
Huntsman International LLC - Key news
Huntsman International LLC - Key offerings
Huntsman International LLC - Segment focus
SWOT

15.8 Krypton Chemical S.L.

Krypton Chemical S.L. - Overview
Krypton Chemical S.L. - Product / Service
Krypton Chemical S.L. - Key offerings
SWOT

15.9 Nukote Coating Systems Intl.

Nukote Coating Systems Intl. - Overview
Nukote Coating Systems Intl. - Product / Service
Nukote Coating Systems Intl. - Key offerings
SWOT

15.10 POLYFLEX AND WASSER

POLYFLEX AND WASSER - Overview
POLYFLEX AND WASSER - Product / Service
POLYFLEX AND WASSER - Key offerings
SWOT

15.11 PPG Industries Inc.

PPG Industries Inc. - Overview
PPG Industries Inc. - Business segments
PPG Industries Inc. - Key news
PPG Industries Inc. - Key offerings
PPG Industries Inc. - Segment focus
SWOT

15.12 Rhino Linings Corp.

Rhino Linings Corp. - Overview
Rhino Linings Corp. - Product / Service
Rhino Linings Corp. - Key offerings
SWOT

15.13 Scorpion Protective Coatings Inc.

Scorpion Protective Coatings Inc. - Overview
Scorpion Protective Coatings Inc. - Product / Service
Scorpion Protective Coatings Inc. - Key offerings
SWOT

15.14 Specialty Products Inc.

Specialty Products Inc. - Overview
Specialty Products Inc. - Product / Service
Specialty Products Inc. - Key offerings
SWOT

15.15 Sprayroq Inc.

Sprayroq Inc. - Overview
Sprayroq Inc. - Product / Service
Sprayroq Inc. - Key offerings
SWOT

15.16 Teknos Group Oy

Teknos Group Oy - Overview
Teknos Group Oy - Product / Service
Teknos Group Oy - Key offerings
SWOT

15.17 The Sherwin Williams Co.

The Sherwin Williams Co. - Overview
The Sherwin Williams Co. - Business segments
The Sherwin Williams Co. - Key offerings
The Sherwin Williams Co. - Segment focus
SWOT

15.18 VersaFlex Inc.

VersaFlex Inc. - Overview
VersaFlex Inc. - Product / Service
VersaFlex Inc. - Key offerings
SWOT

16. Appendix

16.1 Scope of the report

Market definition
Objectives
Notes and caveats

16.2 Inclusions and exclusions checklist

Inclusions checklist
Exclusions checklist

16.3 Currency conversion rates for US$

16.4 Research methodology

16.5 Data procurement

Information sources

16.6 Data validation

16.7 Validation techniques employed for market sizing

16.8 Data synthesis

16.9 360 degree market analysis

16.10 List of abbreviations

Research Methodology

Technavio presents a detailed picture of the market by way of study, synthesis, and summation of data from multiple sources. The analysts have presented the various facets of the market with a particular focus on identifying the key industry influencers. The data thus presented is comprehensive, reliable, and the result of extensive research, both primary and secondary.

INFORMATION SOURCES

Primary sources

  • Manufacturers and suppliers
  • Channel partners
  • Industry experts
  • Strategic decision makers

Secondary sources

  • Industry journals and periodicals
  • Government data
  • Financial reports of key industry players
  • Historical data
  • Press releases

DATA ANALYSIS

Data Synthesis

  • Collation of data
  • Estimation of key figures
  • Analysis of derived insights

Data Validation

  • Triangulation with data models
  • Reference against proprietary databases
  • Corroboration with industry experts

REPORT WRITING

Qualitative

  • Market drivers
  • Market challenges
  • Market trends
  • Five forces analysis

Quantitative

  • Market size and forecast
  • Market segmentation
  • Geographical insights
  • Competitive landscape

Interested in this report?

Get your sample now to see our research methodology and insights!

Download Now

Frequently Asked Questions

Polyurea market growth will increase by USD 503.7 million during 2025-2029.

The Polyurea market is expected to grow at a CAGR of 6.5% during 2025-2029.

Polyurea market is segmented by Product (Coatings, Lining, Sealants) Raw material (Aliphatic, Aromatic) Type (Hot polyurea, Cold polyurea)

American Polymers Corp., ArmorThane USA Inc., BASF SE, Covestro AG, Dorf Ketal Chemicals India Pvt. Ltd., Huntsman International LLC, Krypton Chemical S.L., Marvel Coatings, Nukote Coating Systems Intl., POLYFLEX AND WASSER, PPG Industries Inc., Rhino Linings Corp., Scorpion Protective Coatings Inc., Specialty Products Inc., Sprayroq Inc., TECNOPOL SISTEMAS S.L., Teknos Group Oy, The Sherwin Williams Co., VersaFlex Inc., VIP Coatings International GmbH and Co. KG are a few of the key vendors in the Polyurea market.

North America will register the highest growth rate of 37.5% among the other regions. Therefore, the Polyurea market in North America is expected to garner significant business opportunities for the vendors during the forecast period.

US, Canada, Mexico, Germany, UK, France, Italy, Spain, The Netherlands, China, India, Japan, South Korea, Indonesia, Australia, Saudi Arabia, UAE, South Africa, Qatar, Egypt, Brazil, Argentina, Chile

  • Accelerated expansion of the global construction industry is the driving factor this market.

The Polyurea market vendors should focus on grabbing business opportunities from the Product segment as it accounted for the largest market share in the base year.