Polybutadiene Rubber Market Analysis, Size, and Forecast 2026-2030: APAC (China, Japan, and India), North America (US, Canada, and Mexico), Europe (Germany, UK, and France), Middle East and Africa (Saudi Arabia, South Africa, and UAE), South America (Brazil, Argentina, and Colombia), and Rest of World (ROW)

Polybutadiene Rubber Market Analysis, Size, and Forecast 2026-2030:
APAC (China, Japan, and India), North America (US, Canada, and Mexico), Europe (Germany, UK, and France), Middle East and Africa (Saudi Arabia, South Africa, and UAE), South America (Brazil, Argentina, and Colombia), and Rest of World (ROW)

Published: Dec 2025 291 Pages SKU: IRTNTR46413

Market Overview at a Glance

$3.22 B
Market Opportunity
4.7%
CAGR 2025 - 2030
58.5%
APAC Growth
$8.67 B
Tires segment 2024

Polybutadiene Rubber Market Size 2026-2030

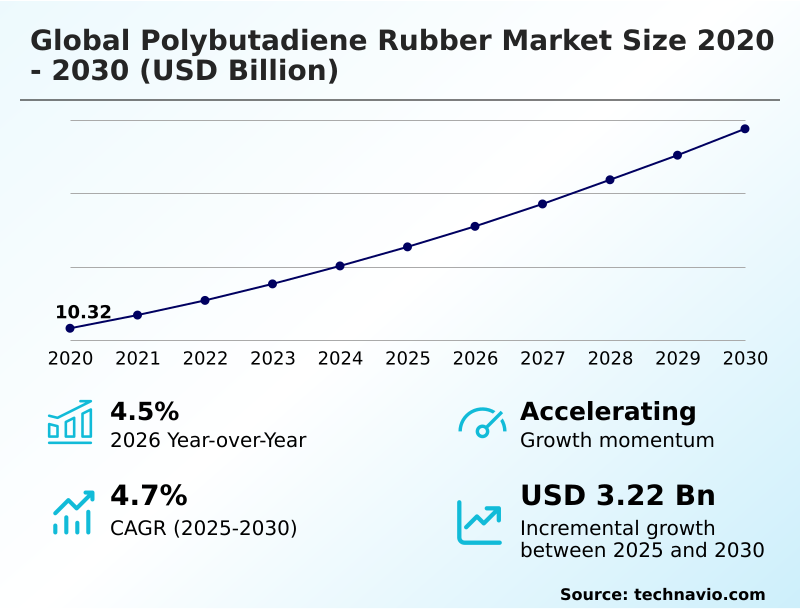
The polybutadiene rubber market size is valued to increase by USD 3.22 billion, at a CAGR of 4.7% from 2025 to 2030. Increasing demand from automotive industry will drive the polybutadiene rubber market.

Major Market Trends & Insights

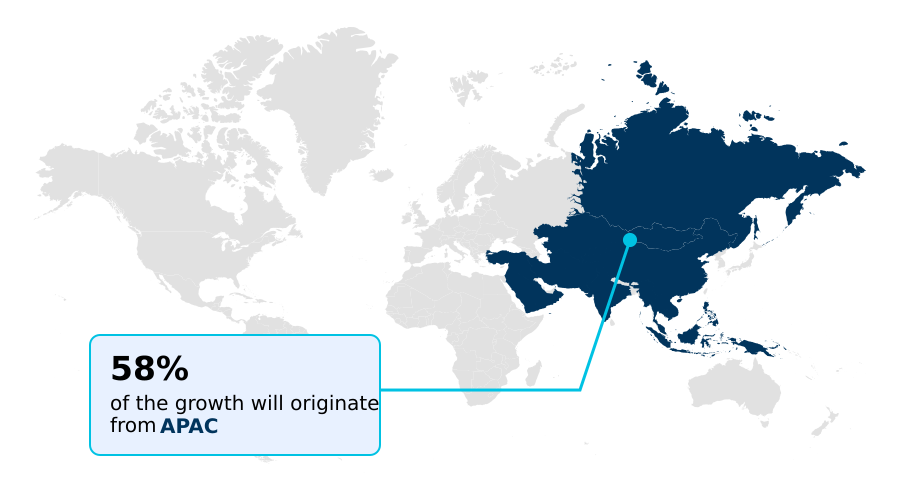
  • APAC dominated the market and accounted for a 58.5% growth during the forecast period.
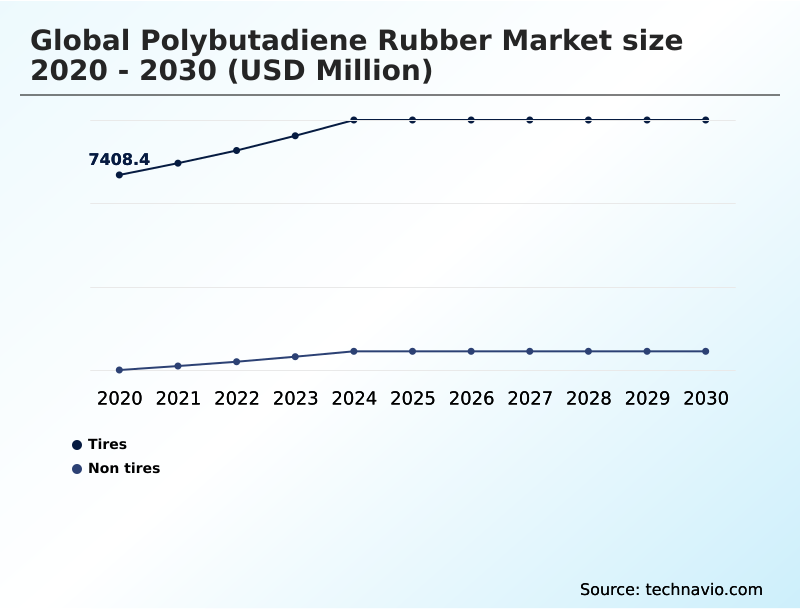
  • By Application - Tires segment was valued at USD 8.67 billion in 2024
  • By End-user - Automotive segment accounted for the largest market revenue share in 2024

Market Size & Forecast

  • Market Opportunities: USD 5.44 billion
  • Market Future Opportunities: USD 3.22 billion
  • CAGR from 2025 to 2030 : 4.7%

Market Summary

  • The polybutadiene rubber market is characterized by its integral role in high-performance applications, primarily driven by the automotive sector's demand for durable and efficient tires. Market dynamics are shaped by a continuous push for innovation, such as the development of functionalized polybutadiene rubber and the adoption of green tire technology to meet stringent environmental standards.
  • Another significant trend is the shift toward sustainable material sourcing, with research into bio-based isoprene and circular economy solutions gaining momentum. A key business scenario involves tire manufacturers balancing raw material volatility against the need to invest in advanced polymer science.
  • These companies must navigate a complex feedstock supply chain, where the price of butadiene feedstock can fluctuate, impacting production costs. To remain competitive, they must optimize elastomer blending and leverage new polymer processing technology to create eco-friendly tires with low rolling resistance without sacrificing wear resistance or safety, aligning product development with both performance demands and corporate sustainability goals.

What will be the Size of the Polybutadiene Rubber Market during the forecast period?

Get Key Insights on Market Forecast (PDF) Request Free Sample

How is the Polybutadiene Rubber Market Segmented?

The polybutadiene rubber industry research report provides comprehensive data (region-wise segment analysis), with forecasts and estimates in "USD million" for the period 2026-2030, as well as historical data from 2020-2024 for the following segments.

  • Application
    • Tires
    • Non tires
  • End-user
    • Automotive
    • Construction
    • Others
  • Distribution channel
    • Offline
    • Online
  • Geography
    • APAC
      • China
      • Japan
      • India
    • North America
      • US
      • Canada
      • Mexico
    • Europe
      • Germany
      • UK
      • France
    • Middle East and Africa
      • Saudi Arabia
      • South Africa
      • UAE
    • South America
      • Brazil
      • Argentina
      • Colombia
    • Rest of World (ROW)

By Application Insights

The tires segment is estimated to witness significant growth during the forecast period.

The tire segment, a cornerstone of the performance polymer market, accounts for approximately 70% of polybutadiene rubber consumption.

Its use is critical in automotive elastomer applications, specifically for formulating advanced tire tread compound materials that deliver superior abrasion resistance and low rolling resistance.

The ongoing tire manufacturing process innovation focuses on creating high-performance tires and eco-friendly tires by blending this high resilience elastomer with materials like styrene-butadiene rubber (SBR).

This segment's growth is tied to the demand for high-performance elastomers that pass rigorous elastomer property testing, ensuring optimal cold temperature performance and safety.

As vehicle specifications evolve, so does the need for these specialized rubber compounds, maintaining the segment's central role in the market.

Request Free Sample

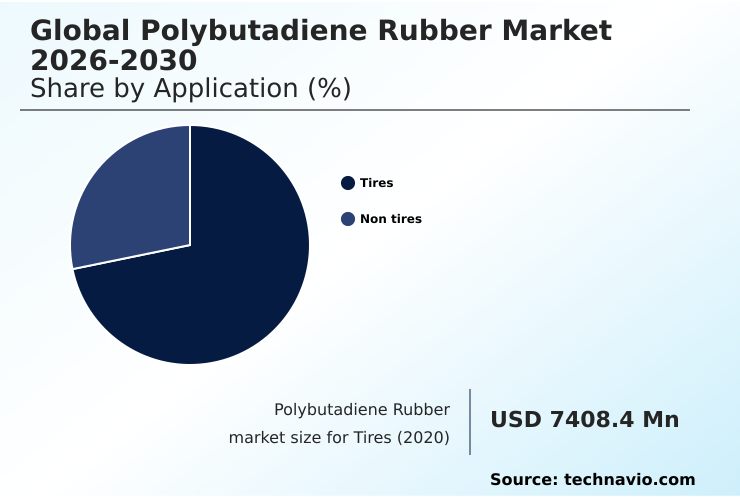
The Tires segment was valued at USD 8.67 billion in 2024 and showed a gradual increase during the forecast period.

Request Free Sample

Regional Analysis

APAC is estimated to contribute 58.5% to the growth of the global market during the forecast period.Technavio’s analysts have elaborately explained the regional trends and drivers that shape the market during the forecast period.

See How Polybutadiene Rubber Market Demand is Rising in APAC Request Free Sample

The geographic landscape of the polybutadiene rubber market is dominated by the APAC region, which accounts for over 58% of incremental growth, driven by its massive automotive and industrial sectors.

This region is a production hub for high-cis polybutadiene and neodymium-catalyzed polybutadiene (Nd-PBR), with producers implementing advanced rubber compounding techniques to meet local demand.

In contrast, North America and Europe focus on high-value applications, using PBR as a crucial impact modifier and vibration damping material in specialized products. These mature markets emphasize innovation in synthetic rubber formulation and rubber recycling technology.

Investment in specialty chemical additives is enabling producers to enhance low temperature flexibility, with some achieving a 10% improvement in performance for advanced rubber compounds.

This regional specialization shapes the global supply chain, balancing high-volume production with demand for niche, high-performance materials like elastomers for EV tires.

Market Dynamics

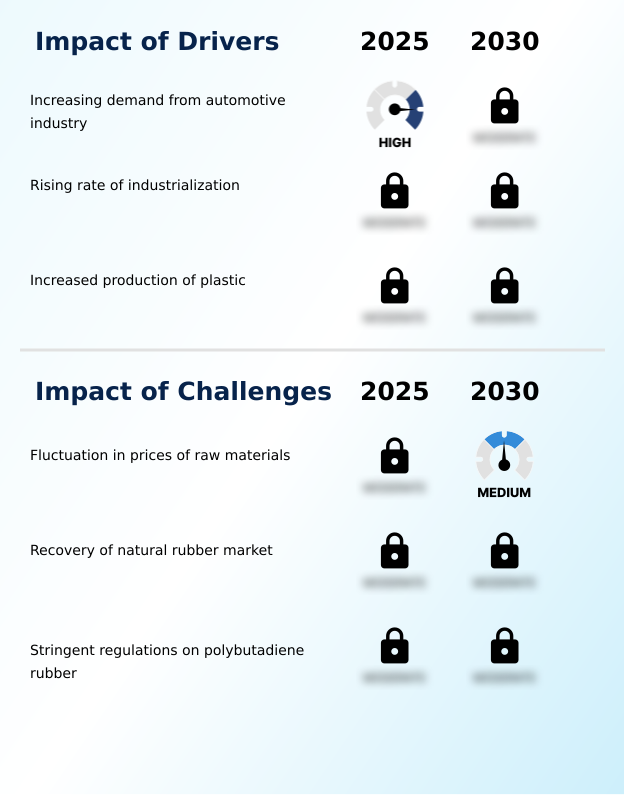
Our researchers analyzed the data with 2025 as the base year, along with the key drivers, trends, and challenges. A holistic analysis of drivers will help companies refine their marketing strategies to gain a competitive advantage.

  • Strategic decision-making in the polybutadiene rubber market is increasingly focused on specific high-value applications and material comparisons. The development of polybutadiene rubber for electric vehicle tires is a primary focus, as these applications require unique properties compared to conventional tires, making supply chain management for synthetic rubber approximately 20% more complex.
  • Concurrently, innovation in using neodymium-catalyzed polybutadiene for green tires addresses the demand for sustainability and efficiency. The longstanding debate of comparing polybutadiene rubber vs natural rubber continues, with each material offering distinct advantages in performance and cost. A significant trend is the use of bio-isoprene as a polybutadiene rubber alternative, aligning with circular economy principles.
  • Beyond tires, improving plastic toughness with polybutadiene rubber is critical for consumer electronics housing and other molded parts, particularly in the impact modification of HIPS with polybutadiene. Other key areas include developing polybutadiene rubber in high-performance footwear soles, where its rebound is essential, and its use as an asphalt modifier to enhance road durability.
  • The inherent low temperature flexibility of polybutadiene rubber makes it ideal for components in harsh environments. Understanding the benefits of functionalized polybutadiene rubber is crucial for optimizing polybutadiene rubber in elastomer blends. The role of polybutadiene rubber in the circular economy, challenges in butadiene feedstock sourcing, and the regulatory impact on polybutadiene rubber production are key strategic considerations.
  • Niche growth areas include polybutadiene rubber for industrial conveyor belts, leveraging its vibration damping properties of polybutadiene rubber and enhancing abrasion resistance in tire treads, and exploring polybutadiene rubber grades for medical devices.

What are the key market drivers leading to the rise in the adoption of Polybutadiene Rubber Industry?

  • The primary market driver is the increasing demand from the automotive industry, particularly for tire and non-tire applications.

  • Market growth is fundamentally driven by robust demand from end-use industries. The automotive sector's need for high-performance elastomer for EV tires and conventional vehicles remains the primary catalyst.
  • In plastics, PBR serves as a vital polymer modification agent for high-impact polystyrene (HIPS) and acrylonitrile-butadiene-styrene (ABS), improving the wear resistance of components in consumer goods manufacturing and industrial machinery components.
  • The expansion of the construction material enhancement sector further fuels demand. Ongoing synthetic rubber production and the development of new thermoplastic elastomer grades are meeting the need for durable polymer materials across various applications.
  • The use of PBR in tire sidewall compound formulations and other industrial rubber goods has demonstrated a 20% improvement in durability under stress testing. Innovations in vulcanizable plasticizers are also expanding the material's application scope.

What are the market trends shaping the Polybutadiene Rubber Industry?

  • Innovation and product development are a key market trend, driven by the need for advanced materials that satisfy the rigorous performance requirements of modern applications.

  • Market trends are centered on product innovation and sustainability, driven by advanced polymer science. The development of functionalized polybutadiene rubber through new solution polymerization techniques is enhancing synthetic rubber properties for specialized applications. A major push towards green tire technology is fueling research into bio-based feedstock, such as bio-based isoprene, and circular economy solutions that prioritize sustainable material sourcing.
  • Polymer processing technology advancements are enabling the creation of durable polymer materials with improved performance, including lithium butadiene rubber. In one instance, the adoption of specialized catalyst systems has improved the consistency of asphalt modifier formulations by 15%.
  • These trends underscore a market shift towards higher-value, eco-conscious products, with some manufacturers reporting a 10% increase in material lifespan for certain applications.

What challenges does the Polybutadiene Rubber Industry face during its growth?

  • A key challenge affecting industry growth is the significant price fluctuation of essential raw materials, which creates market uncertainty.

  • The market faces significant challenges rooted in supply chain and regulatory pressures. Persistent raw material volatility, especially concerning butadiene feedstock derived from ethylene steam cracking, creates considerable feedstock price fluctuation. This instability complicates production planning and has led to cost variations of up to 30% within a single quarter for some producers.
  • The entire feedstock supply chain is vulnerable to geopolitical and operational disruptions, testing supply chain resilience. Additionally, rising regulatory compliance costs associated with emissions from petrochemical by-products are pressuring margins. These factors affect the economics of elastomer blending with materials like solution-styrene butadiene rubber and the production of polymer-modified bitumen (PMB).
  • Navigating these challenges requires advanced risk management for chemical intermediates and sourcing strategies for heavy-duty applications.

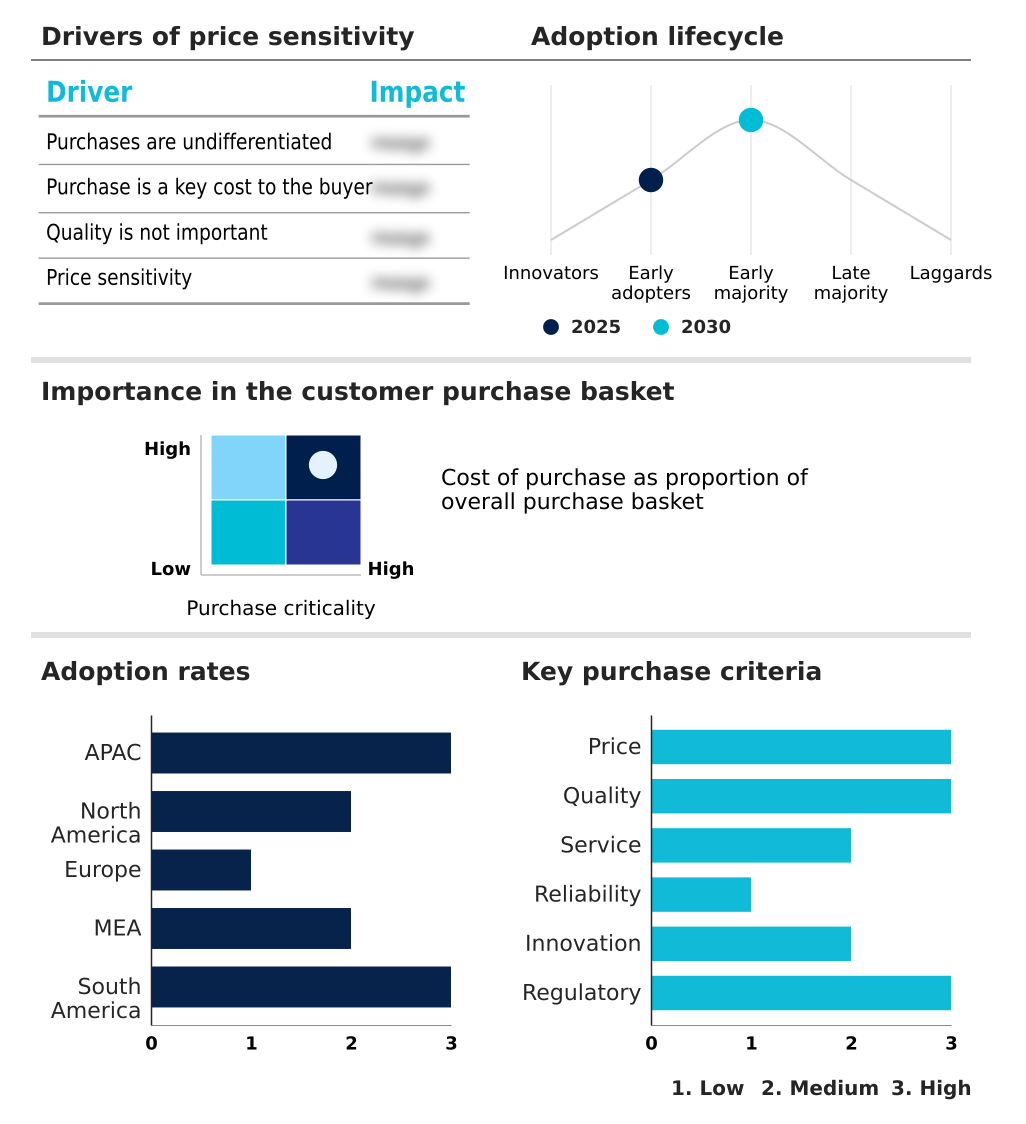
Exclusive Technavio Analysis on Customer Landscape

The polybutadiene rubber market forecasting report includes the adoption lifecycle of the market, covering from the innovator’s stage to the laggard’s stage. It focuses on adoption rates in different regions based on penetration. Furthermore, the polybutadiene rubber market report also includes key purchase criteria and drivers of price sensitivity to help companies evaluate and develop their market growth analysis strategies.

Customer Landscape of Polybutadiene Rubber Industry

Competitive Landscape

Companies are implementing various strategies, such as strategic alliances, polybutadiene rubber market forecast, partnerships, mergers and acquisitions, geographical expansion, and product/service launches, to enhance their presence in the industry.

ARLANXEO - Provides a portfolio of advanced polybutadiene rubber grades, driving innovation in elastomer technology for high-performance tire and industrial applications.

The industry research and growth report includes detailed analyses of the competitive landscape of the market and information about key companies, including:

  • ARLANXEO
  • China National Petroleum Corp.
  • China Petrochemical Corp.
  • Evonik Industries AG
  • JSR Corp.
  • Kumho Petrochemical Co. Ltd.
  • KURARAY Co. Ltd.
  • Lanxess AG
  • LG Chem Ltd.
  • Nippon Soda Co. Ltd.
  • Reliance Industries Ltd.
  • Saudi Basic Industries
  • SIBUR International GmbH
  • Synthomer Plc
  • Synthos SA
  • The Goodyear Tire and Rubber Co.
  • Ube Corp.
  • Versalis S.p.A
  • Zeon Corp.

Qualitative and quantitative analysis of companies has been conducted to help clients understand the wider business environment as well as the strengths and weaknesses of key industry players. Data is qualitatively analyzed to categorize companies as pure play, category-focused, industry-focused, and diversified; it is quantitatively analyzed to categorize companies as dominant, leading, strong, tentative, and weak.

Recent Development and News in Polybutadiene rubber market

  • In September 2024, ARLANXEO announced a strategic partnership with a leading EV tire manufacturer to co-develop next-generation functionalized polybutadiene rubber grades, aiming to produce tires with a 15% reduction in rolling resistance for extended battery range (Source: ARLANXEO Press Release).
  • In November 2024, SABIC launched its new line of certified circular polybutadiene rubber, produced from advanced recycling of post-consumer plastic waste, offering a drop-in solution with a lower carbon footprint for tire and industrial applications (Source: SABIC Corporate News).
  • In February 2025, Reliance Industries Ltd. confirmed the successful commissioning of its new 50,000 metric ton per annum neodymium-catalyzed polybutadiene rubber production line in India, primarily to meet rising demand from the domestic high-performance tire sector (Source: Reuters).
  • In May 2025, Lanxess AG completed the acquisition of a European polymer technology startup for approximately EUR 80 million, gaining proprietary catalyst technology expected to enhance the abrasion resistance of its PBR grades by up to 20% (Source: Bloomberg).

Dive into Technavio’s robust research methodology, blending expert interviews, extensive data synthesis, and validated models for unparalleled Polybutadiene Rubber Market insights. See full methodology.

Market Scope
Page number 291
Base year 2025
Historic period 2020-2024
Forecast period 2026-2030
Growth momentum & CAGR Accelerate at a CAGR of 4.7%
Market growth 2026-2030 USD 3217.9 million
Market structure Fragmented
YoY growth 2025-2026(%) 4.5%
Key countries China, Japan, India, South Korea, Indonesia, Australia, US, Canada, Mexico, Germany, UK, France, Italy, Spain, The Netherlands, Saudi Arabia, South Africa, UAE, Israel, Turkey, Brazil, Argentina and Colombia
Competitive landscape Leading Companies, Market Positioning of Companies, Competitive Strategies, and Industry Risks

Request Free Sample

Research Analyst Overview

  • The polybutadiene rubber market is defined by continuous material science advancements and its critical role in industrial and automotive sectors. Key developments focus on enhancing synthetic rubber properties, such as abrasion resistance and low rolling resistance, through technologies like solution polymerization and the use of neodymium-catalyzed polybutadiene (Nd-PBR). High-cis polybutadiene remains a cornerstone for high-performance tires, including specialized eco-friendly tires.
  • Boardroom decisions are increasingly influenced by sustainability mandates, compelling a strategic shift toward bio-based isoprene and a resilient feedstock supply chain. This requires significant R&D investment in functionalized polybutadiene rubber and advanced elastomer blending techniques. The use of PBR as an impact modifier for high-impact polystyrene (HIPS) and acrylonitrile-butadiene-styrene (ABS) is a major non-tire application.
  • Innovations in solution-styrene butadiene rubber and lithium butadiene rubber are also notable. The industry contends with raw material volatility, particularly in butadiene feedstock from ethylene steam cracking. Recent adoption of new catalyst technology has reduced curing times by 10%, a tangible efficiency gain.
  • The versatility of PBR is evident in its use as an asphalt modifier, in tire sidewall compound, industrial rubber goods, and as a polymer modification agent for thermoplastic elastomers, showcasing its wide-ranging industrial importance.

What are the Key Data Covered in this Polybutadiene Rubber Market Research and Growth Report?

  • What is the expected growth of the Polybutadiene Rubber Market between 2026 and 2030?

    • USD 3.22 billion, at a CAGR of 4.7%

  • What segmentation does the market report cover?

    • The report is segmented by Application (Tires, and Non tires), End-user (Automotive, Construction, and Others), Distribution Channel (Offline, and Online) and Geography (APAC, North America, Europe, Middle East and Africa, South America)

  • Which regions are analyzed in the report?

    • APAC, North America, Europe, Middle East and Africa and South America

  • What are the key growth drivers and market challenges?

    • Increasing demand from automotive industry, Fluctuation in prices of raw materials

  • Who are the major players in the Polybutadiene Rubber Market?

    • ARLANXEO, China National Petroleum Corp., China Petrochemical Corp., Evonik Industries AG, JSR Corp., Kumho Petrochemical Co. Ltd., KURARAY Co. Ltd., Lanxess AG, LG Chem Ltd., Nippon Soda Co. Ltd., Reliance Industries Ltd., Saudi Basic Industries, SIBUR International GmbH, Synthomer Plc, Synthos SA, The Goodyear Tire and Rubber Co., Ube Corp., Versalis S.p.A and Zeon Corp.

Market Research Insights

  • The polybutadiene rubber market is shaped by intense industrial demand, where performance enhancements drive strategic decisions. The adoption of advanced rubber compounds has improved wear resistance in heavy-duty applications by over 15%, a critical factor for industrial machinery components. In construction material enhancement, polymer modification agents improve the durability of infrastructure assets, extending service life by up to 25%.
  • Furthermore, innovations in synthetic rubber production have enabled the creation of specialized elastomers for EV tires, which now account for a growing share of the automotive segment. These shifts reflect a market where specialized catalyst systems and advanced polymer science are paramount, impacting everything from consumer goods manufacturing to the development of vulcanizable plasticizers and other durable polymer materials.

We can help! Our analysts can customize this polybutadiene rubber market research report to meet your requirements.

Get in touch

1. Executive Summary

1.1 Market overview

Executive Summary - Chart on Market Overview
Executive Summary - Data Table on Market Overview
Executive Summary - Chart on Global Market Characteristics
Executive Summary - Chart on Market by Geography
Executive Summary - Chart on Market Segmentation by Application
Executive Summary - Chart on Market Segmentation by End-user
Executive Summary - Chart on Market Segmentation by Distribution Channel
Executive Summary - Chart on Incremental Growth
Executive Summary - Data Table on Incremental Growth
Executive Summary - Chart on Company Market Positioning

2. Technavio Analysis

2.1 Analysis of price sensitivity, lifecycle, customer purchase basket, adoption rates, and purchase criteria

2.2 Criticality of inputs and Factors of differentiation

Chart on Overview on criticality of inputs and factors of differentiation

2.3 Factors of disruption

Chart on Overview on factors of disruption

2.4 Impact of drivers and challenges

Chart on Impact of drivers and challenges in 2025 and 2030

3. Market Landscape

3.1 Market ecosystem

Chart on Parent Market
Data Table on - Parent Market

3.2 Market characteristics

Chart on Market characteristics analysis

3.3 Value chain analysis

Chart on Value chain analysis

4. Market Sizing

4.1 Market definition

Data Table on Offerings of companies included in the market definition

4.2 Market segment analysis

Market segments

4.3 Market size 2025

4.4 Market outlook: Forecast for 2025-2030

Chart on Global - Market size and forecast 2025-2030 ($ million)
Data Table on Global - Market size and forecast 2025-2030 ($ million)
Chart on Global Market: Year-over-year growth 2025-2030 (%)
Data Table on Global Market: Year-over-year growth 2025-2030 (%)

5. Historic Market Size

5.1 Global Polybutadiene Rubber Market 2020 - 2024

Historic Market Size - Data Table on Global Polybutadiene Rubber Market 2020 - 2024 ($ million)

5.2 Application segment analysis 2020 - 2024

Historic Market Size - Application Segment 2020 - 2024 ($ million)

5.3 End-user segment analysis 2020 - 2024

Historic Market Size - End-user Segment 2020 - 2024 ($ million)

5.4 Distribution Channel segment analysis 2020 - 2024

Historic Market Size - Distribution Channel Segment 2020 - 2024 ($ million)

5.5 Geography segment analysis 2020 - 2024

Historic Market Size - Geography Segment 2020 - 2024 ($ million)

5.6 Country segment analysis 2020 - 2024

Historic Market Size - Country Segment 2020 - 2024 ($ million)

6. Qualitative Analysis

6.1 The AI impact on Global Polybutadiene Rubber Market

7. Five Forces Analysis

7.1 Five forces summary

Five forces analysis - Comparison between 2025 and 2030

7.2 Bargaining power of buyers

Bargaining power of buyers - Impact of key factors 2025 and 2030

7.3 Bargaining power of suppliers

Bargaining power of suppliers - Impact of key factors in 2025 and 2030

7.4 Threat of new entrants

Threat of new entrants - Impact of key factors in 2025 and 2030

7.5 Threat of substitutes

Threat of substitutes - Impact of key factors in 2025 and 2030

7.6 Threat of rivalry

Threat of rivalry - Impact of key factors in 2025 and 2030

7.7 Market condition

Chart on Market condition - Five forces 2025 and 2030

8. Market Segmentation by Application

8.1 Market segments

Chart on Application - Market share 2025-2030 (%)
Data Table on Application - Market share 2025-2030 (%)

8.2 Comparison by Application

Chart on Comparison by Application
Data Table on Comparison by Application

8.3 Tires - Market size and forecast 2025-2030

Chart on Tires - Market size and forecast 2025-2030 ($ million)
Data Table on Tires - Market size and forecast 2025-2030 ($ million)
Chart on Tires - Year-over-year growth 2025-2030 (%)
Data Table on Tires - Year-over-year growth 2025-2030 (%)

8.4 Non tires - Market size and forecast 2025-2030

Chart on Non tires - Market size and forecast 2025-2030 ($ million)
Data Table on Non tires - Market size and forecast 2025-2030 ($ million)
Chart on Non tires - Year-over-year growth 2025-2030 (%)
Data Table on Non tires - Year-over-year growth 2025-2030 (%)

8.5 Market opportunity by Application

Market opportunity by Application ($ million)
Data Table on Market opportunity by Application ($ million)

9. Market Segmentation by End-user

9.1 Market segments

Chart on End-user - Market share 2025-2030 (%)
Data Table on End-user - Market share 2025-2030 (%)

9.2 Comparison by End-user

Chart on Comparison by End-user
Data Table on Comparison by End-user

9.3 Automotive - Market size and forecast 2025-2030

Chart on Automotive - Market size and forecast 2025-2030 ($ million)
Data Table on Automotive - Market size and forecast 2025-2030 ($ million)
Chart on Automotive - Year-over-year growth 2025-2030 (%)
Data Table on Automotive - Year-over-year growth 2025-2030 (%)

9.4 Construction - Market size and forecast 2025-2030

Chart on Construction - Market size and forecast 2025-2030 ($ million)
Data Table on Construction - Market size and forecast 2025-2030 ($ million)
Chart on Construction - Year-over-year growth 2025-2030 (%)
Data Table on Construction - Year-over-year growth 2025-2030 (%)

9.5 Others - Market size and forecast 2025-2030

Chart on Others - Market size and forecast 2025-2030 ($ million)
Data Table on Others - Market size and forecast 2025-2030 ($ million)
Chart on Others - Year-over-year growth 2025-2030 (%)
Data Table on Others - Year-over-year growth 2025-2030 (%)

9.6 Market opportunity by End-user

Market opportunity by End-user ($ million)
Data Table on Market opportunity by End-user ($ million)

10. Market Segmentation by Distribution Channel

10.1 Market segments

Chart on Distribution Channel - Market share 2025-2030 (%)
Data Table on Distribution Channel - Market share 2025-2030 (%)

10.2 Comparison by Distribution Channel

Chart on Comparison by Distribution Channel
Data Table on Comparison by Distribution Channel

10.3 Offline - Market size and forecast 2025-2030

Chart on Offline - Market size and forecast 2025-2030 ($ million)
Data Table on Offline - Market size and forecast 2025-2030 ($ million)
Chart on Offline - Year-over-year growth 2025-2030 (%)
Data Table on Offline - Year-over-year growth 2025-2030 (%)

10.4 Online - Market size and forecast 2025-2030

Chart on Online - Market size and forecast 2025-2030 ($ million)
Data Table on Online - Market size and forecast 2025-2030 ($ million)
Chart on Online - Year-over-year growth 2025-2030 (%)
Data Table on Online - Year-over-year growth 2025-2030 (%)

10.5 Market opportunity by Distribution Channel

Market opportunity by Distribution Channel ($ million)
Data Table on Market opportunity by Distribution Channel ($ million)

11. Customer Landscape

11.1 Customer landscape overview

Analysis of price sensitivity, lifecycle, customer purchase basket, adoption rates, and purchase criteria

12. Geographic Landscape

12.1 Geographic segmentation

Chart on Market share by geography 2025-2030 (%)
Data Table on Market share by geography 2025-2030 (%)

12.2 Geographic comparison

Chart on Geographic comparison
Data Table on Geographic comparison

12.3 APAC - Market size and forecast 2025-2030

Chart on APAC - Market size and forecast 2025-2030 ($ million)
Data Table on APAC - Market size and forecast 2025-2030 ($ million)
Chart on APAC - Year-over-year growth 2025-2030 (%)
Data Table on APAC - Year-over-year growth 2025-2030 (%)
Chart on Regional Comparison - APAC
Data Table on Regional Comparison - APAC

12.3.1 China - Market size and forecast 2025-2030

Chart on China - Market size and forecast 2025-2030 ($ million)
Data Table on China - Market size and forecast 2025-2030 ($ million)
Chart on China - Year-over-year growth 2025-2030 (%)
Data Table on China - Year-over-year growth 2025-2030 (%)

12.3.2 Japan - Market size and forecast 2025-2030

Chart on Japan - Market size and forecast 2025-2030 ($ million)
Data Table on Japan - Market size and forecast 2025-2030 ($ million)
Chart on Japan - Year-over-year growth 2025-2030 (%)
Data Table on Japan - Year-over-year growth 2025-2030 (%)

12.3.3 India - Market size and forecast 2025-2030

Chart on India - Market size and forecast 2025-2030 ($ million)
Data Table on India - Market size and forecast 2025-2030 ($ million)
Chart on India - Year-over-year growth 2025-2030 (%)
Data Table on India - Year-over-year growth 2025-2030 (%)

12.3.4 South Korea - Market size and forecast 2025-2030

Chart on South Korea - Market size and forecast 2025-2030 ($ million)
Data Table on South Korea - Market size and forecast 2025-2030 ($ million)
Chart on South Korea - Year-over-year growth 2025-2030 (%)
Data Table on South Korea - Year-over-year growth 2025-2030 (%)

12.3.5 Indonesia - Market size and forecast 2025-2030

Chart on Indonesia - Market size and forecast 2025-2030 ($ million)
Data Table on Indonesia - Market size and forecast 2025-2030 ($ million)
Chart on Indonesia - Year-over-year growth 2025-2030 (%)
Data Table on Indonesia - Year-over-year growth 2025-2030 (%)

12.3.6 Australia - Market size and forecast 2025-2030

Chart on Australia - Market size and forecast 2025-2030 ($ million)
Data Table on Australia - Market size and forecast 2025-2030 ($ million)
Chart on Australia - Year-over-year growth 2025-2030 (%)
Data Table on Australia - Year-over-year growth 2025-2030 (%)

12.4 North America - Market size and forecast 2025-2030

Chart on North America - Market size and forecast 2025-2030 ($ million)
Data Table on North America - Market size and forecast 2025-2030 ($ million)
Chart on North America - Year-over-year growth 2025-2030 (%)
Data Table on North America - Year-over-year growth 2025-2030 (%)
Chart on Regional Comparison - North America
Data Table on Regional Comparison - North America

12.4.1 US - Market size and forecast 2025-2030

Chart on US - Market size and forecast 2025-2030 ($ million)
Data Table on US - Market size and forecast 2025-2030 ($ million)
Chart on US - Year-over-year growth 2025-2030 (%)
Data Table on US - Year-over-year growth 2025-2030 (%)

12.4.2 Canada - Market size and forecast 2025-2030

Chart on Canada - Market size and forecast 2025-2030 ($ million)
Data Table on Canada - Market size and forecast 2025-2030 ($ million)
Chart on Canada - Year-over-year growth 2025-2030 (%)
Data Table on Canada - Year-over-year growth 2025-2030 (%)

12.4.3 Mexico - Market size and forecast 2025-2030

Chart on Mexico - Market size and forecast 2025-2030 ($ million)
Data Table on Mexico - Market size and forecast 2025-2030 ($ million)
Chart on Mexico - Year-over-year growth 2025-2030 (%)
Data Table on Mexico - Year-over-year growth 2025-2030 (%)

12.5 Europe - Market size and forecast 2025-2030

Chart on Europe - Market size and forecast 2025-2030 ($ million)
Data Table on Europe - Market size and forecast 2025-2030 ($ million)
Chart on Europe - Year-over-year growth 2025-2030 (%)
Data Table on Europe - Year-over-year growth 2025-2030 (%)
Chart on Regional Comparison - Europe
Data Table on Regional Comparison - Europe

12.5.1 Germany - Market size and forecast 2025-2030

Chart on Germany - Market size and forecast 2025-2030 ($ million)
Data Table on Germany - Market size and forecast 2025-2030 ($ million)
Chart on Germany - Year-over-year growth 2025-2030 (%)
Data Table on Germany - Year-over-year growth 2025-2030 (%)

12.5.2 UK - Market size and forecast 2025-2030

Chart on UK - Market size and forecast 2025-2030 ($ million)
Data Table on UK - Market size and forecast 2025-2030 ($ million)
Chart on UK - Year-over-year growth 2025-2030 (%)
Data Table on UK - Year-over-year growth 2025-2030 (%)

12.5.3 France - Market size and forecast 2025-2030

Chart on France - Market size and forecast 2025-2030 ($ million)
Data Table on France - Market size and forecast 2025-2030 ($ million)
Chart on France - Year-over-year growth 2025-2030 (%)
Data Table on France - Year-over-year growth 2025-2030 (%)

12.5.4 Italy - Market size and forecast 2025-2030

Chart on Italy - Market size and forecast 2025-2030 ($ million)
Data Table on Italy - Market size and forecast 2025-2030 ($ million)
Chart on Italy - Year-over-year growth 2025-2030 (%)
Data Table on Italy - Year-over-year growth 2025-2030 (%)

12.5.5 Spain - Market size and forecast 2025-2030

Chart on Spain - Market size and forecast 2025-2030 ($ million)
Data Table on Spain - Market size and forecast 2025-2030 ($ million)
Chart on Spain - Year-over-year growth 2025-2030 (%)
Data Table on Spain - Year-over-year growth 2025-2030 (%)

12.5.6 The Netherlands - Market size and forecast 2025-2030

Chart on The Netherlands - Market size and forecast 2025-2030 ($ million)
Data Table on The Netherlands - Market size and forecast 2025-2030 ($ million)
Chart on The Netherlands - Year-over-year growth 2025-2030 (%)
Data Table on The Netherlands - Year-over-year growth 2025-2030 (%)

12.6 Middle East and Africa - Market size and forecast 2025-2030

Chart on Middle East and Africa - Market size and forecast 2025-2030 ($ million)
Data Table on Middle East and Africa - Market size and forecast 2025-2030 ($ million)
Chart on Middle East and Africa - Year-over-year growth 2025-2030 (%)
Data Table on Middle East and Africa - Year-over-year growth 2025-2030 (%)
Chart on Regional Comparison - Middle East and Africa
Data Table on Regional Comparison - Middle East and Africa

12.6.1 Saudi Arabia - Market size and forecast 2025-2030

Chart on Saudi Arabia - Market size and forecast 2025-2030 ($ million)
Data Table on Saudi Arabia - Market size and forecast 2025-2030 ($ million)
Chart on Saudi Arabia - Year-over-year growth 2025-2030 (%)
Data Table on Saudi Arabia - Year-over-year growth 2025-2030 (%)

12.6.2 South Africa - Market size and forecast 2025-2030

Chart on South Africa - Market size and forecast 2025-2030 ($ million)
Data Table on South Africa - Market size and forecast 2025-2030 ($ million)
Chart on South Africa - Year-over-year growth 2025-2030 (%)
Data Table on South Africa - Year-over-year growth 2025-2030 (%)

12.6.3 UAE - Market size and forecast 2025-2030

Chart on UAE - Market size and forecast 2025-2030 ($ million)
Data Table on UAE - Market size and forecast 2025-2030 ($ million)
Chart on UAE - Year-over-year growth 2025-2030 (%)
Data Table on UAE - Year-over-year growth 2025-2030 (%)

12.6.4 Israel - Market size and forecast 2025-2030

Chart on Israel - Market size and forecast 2025-2030 ($ million)
Data Table on Israel - Market size and forecast 2025-2030 ($ million)
Chart on Israel - Year-over-year growth 2025-2030 (%)
Data Table on Israel - Year-over-year growth 2025-2030 (%)

12.6.5 Turkey - Market size and forecast 2025-2030

Chart on Turkey - Market size and forecast 2025-2030 ($ million)
Data Table on Turkey - Market size and forecast 2025-2030 ($ million)
Chart on Turkey - Year-over-year growth 2025-2030 (%)
Data Table on Turkey - Year-over-year growth 2025-2030 (%)

12.7 South America - Market size and forecast 2025-2030

Chart on South America - Market size and forecast 2025-2030 ($ million)
Data Table on South America - Market size and forecast 2025-2030 ($ million)
Chart on South America - Year-over-year growth 2025-2030 (%)
Data Table on South America - Year-over-year growth 2025-2030 (%)
Chart on Regional Comparison - South America
Data Table on Regional Comparison - South America

12.7.1 Brazil - Market size and forecast 2025-2030

Chart on Brazil - Market size and forecast 2025-2030 ($ million)
Data Table on Brazil - Market size and forecast 2025-2030 ($ million)
Chart on Brazil - Year-over-year growth 2025-2030 (%)
Data Table on Brazil - Year-over-year growth 2025-2030 (%)

12.7.2 Argentina - Market size and forecast 2025-2030

Chart on Argentina - Market size and forecast 2025-2030 ($ million)
Data Table on Argentina - Market size and forecast 2025-2030 ($ million)
Chart on Argentina - Year-over-year growth 2025-2030 (%)
Data Table on Argentina - Year-over-year growth 2025-2030 (%)

12.7.3 Colombia - Market size and forecast 2025-2030

Chart on Colombia - Market size and forecast 2025-2030 ($ million)
Data Table on Colombia - Market size and forecast 2025-2030 ($ million)
Chart on Colombia - Year-over-year growth 2025-2030 (%)
Data Table on Colombia - Year-over-year growth 2025-2030 (%)

12.8 Market opportunity by geography

Market opportunity by geography ($ million)
Data Tables on Market opportunity by geography ($ million)

13. Drivers, Challenges, and Opportunity

13.1 Market drivers

Increasing demand from automotive industry
Rising rate of industrialization
Increased production of plastic

13.2 Market challenges

Fluctuation in prices of raw materials
Recovery of natural rubber market
Stringent regulations on polybutadiene rubber

13.3 Impact of drivers and challenges

Impact of drivers and challenges in 2025 and 2030

13.4 Market opportunities

Innovation and product development
Gaining popularity of bio-adhesives
Use of bio-based materials in tire manufacturing

14. Competitive Landscape

14.1 Overview

14.2

Overview on criticality of inputs and factors of differentiation

14.3 Landscape disruption

Overview on factors of disruption

14.4 Industry risks

Impact of key risks on business

15. Competitive Analysis

15.1 Companies profiled

Companies covered

15.2 Company ranking index

15.3 Market positioning of companies

Matrix on companies position and classification

15.4 ARLANXEO

ARLANXEO - Overview
ARLANXEO - Product / Service
ARLANXEO - Key offerings
SWOT

15.5 China National Petroleum Corp.

China National Petroleum Corp. - Overview
China National Petroleum Corp. - Product / Service
China National Petroleum Corp. - Key offerings
SWOT

15.6 China Petrochemical Corp.

China Petrochemical Corp. - Overview
China Petrochemical Corp. - Business segments
China Petrochemical Corp. - Key offerings
China Petrochemical Corp. - Segment focus
SWOT

15.7 JSR Corp.

JSR Corp. - Overview
JSR Corp. - Business segments
JSR Corp. - Key offerings
JSR Corp. - Segment focus
SWOT

15.8 Kumho Petrochemical Co. Ltd.

Kumho Petrochemical Co. Ltd. - Overview
Kumho Petrochemical Co. Ltd. - Product / Service
Kumho Petrochemical Co. Ltd. - Key offerings
SWOT

15.9 KURARAY Co. Ltd.

KURARAY Co. Ltd. - Overview
KURARAY Co. Ltd. - Business segments
KURARAY Co. Ltd. - Key news
KURARAY Co. Ltd. - Key offerings
KURARAY Co. Ltd. - Segment focus
SWOT

15.10 Lanxess AG

Lanxess AG - Overview
Lanxess AG - Business segments
Lanxess AG - Key news
Lanxess AG - Key offerings
Lanxess AG - Segment focus
SWOT

15.11 LG Chem Ltd.

LG Chem Ltd. - Overview
LG Chem Ltd. - Business segments
LG Chem Ltd. - Key news
LG Chem Ltd. - Key offerings
LG Chem Ltd. - Segment focus
SWOT

15.12 Reliance Industries Ltd.

Reliance Industries Ltd. - Overview
Reliance Industries Ltd. - Business segments
Reliance Industries Ltd. - Key news
Reliance Industries Ltd. - Key offerings
Reliance Industries Ltd. - Segment focus
SWOT

15.13 Saudi Basic Industries

Saudi Basic Industries - Overview
Saudi Basic Industries - Business segments
Saudi Basic Industries - Key offerings
Saudi Basic Industries - Segment focus
SWOT

15.14 SIBUR International GmbH

SIBUR International GmbH - Overview
SIBUR International GmbH - Product / Service
SIBUR International GmbH - Key offerings
SWOT

15.15 Synthomer Plc

Synthomer Plc - Overview
Synthomer Plc - Business segments
Synthomer Plc - Key offerings
Synthomer Plc - Segment focus
SWOT

15.16 Ube Corp.

Ube Corp. - Overview
Ube Corp. - Business segments
Ube Corp. - Key offerings
Ube Corp. - Segment focus
SWOT

15.17 Versalis S.p.A

Versalis S.p.A - Overview
Versalis S.p.A - Business segments
Versalis S.p.A - Key offerings
Versalis S.p.A - Segment focus
SWOT

15.18 Zeon Corp.

Zeon Corp. - Overview
Zeon Corp. - Business segments
Zeon Corp. - Key news
Zeon Corp. - Key offerings
Zeon Corp. - Segment focus
SWOT

16. Appendix

16.1 Scope of the report

Market definition
Objectives
Notes and caveats

16.2 Inclusions and exclusions checklist

Inclusions checklist
Exclusions checklist

16.3 Currency conversion rates for US$

16.4 Research methodology

16.5 Data procurement

Information sources

16.6 Data validation

16.7 Validation techniques employed for market sizing

16.8 Data synthesis

16.9 360 degree market analysis

16.10 List of abbreviations

Research Methodology

Technavio presents a detailed picture of the market by way of study, synthesis, and summation of data from multiple sources. The analysts have presented the various facets of the market with a particular focus on identifying the key industry influencers. The data thus presented is comprehensive, reliable, and the result of extensive research, both primary and secondary.

INFORMATION SOURCES

Primary sources

  • Manufacturers and suppliers
  • Channel partners
  • Industry experts
  • Strategic decision makers

Secondary sources

  • Industry journals and periodicals
  • Government data
  • Financial reports of key industry players
  • Historical data
  • Press releases

DATA ANALYSIS

Data Synthesis

  • Collation of data
  • Estimation of key figures
  • Analysis of derived insights

Data Validation

  • Triangulation with data models
  • Reference against proprietary databases
  • Corroboration with industry experts

REPORT WRITING

Qualitative

  • Market drivers
  • Market challenges
  • Market trends
  • Five forces analysis

Quantitative

  • Market size and forecast
  • Market segmentation
  • Geographical insights
  • Competitive landscape

Interested in this report?

Get your sample now to see our research methodology and insights!

Download Now

Frequently Asked Questions

Polybutadiene Rubber market growth will increase by USD 3217.9 million during 2026-2030.

The Polybutadiene Rubber market is expected to grow at a CAGR of 4.7% during 2026-2030.

Polybutadiene Rubber market is segmented by Application (Tires, Non tires) End-user (Automotive, Construction, Others) Distribution channel (Offline, Online)

ARLANXEO, China National Petroleum Corp., China Petrochemical Corp., Evonik Industries AG, JSR Corp., Kumho Petrochemical Co. Ltd., KURARAY Co. Ltd., Lanxess AG, LG Chem Ltd., Nippon Soda Co. Ltd., Reliance Industries Ltd., Saudi Basic Industries, SIBUR International GmbH, Synthomer Plc, Synthos SA, The Goodyear Tire and Rubber Co., Ube Corp., Versalis S.p.A, Zeon Corp. are a few of the key vendors in the Polybutadiene Rubber market.

APAC will register the highest growth rate of 58.5% among the other regions. Therefore, the Polybutadiene Rubber market in APAC is expected to garner significant business opportunities for the vendors during the forecast period.

China, Japan, India, South Korea, Indonesia, Australia, US, Canada, Mexico, Germany, UK, France, Italy, Spain, The Netherlands, Saudi Arabia, South Africa, UAE, Israel, Turkey, Brazil, Argentina, Colombia

  • Increasing demand from automotive industry is the driving factor this market.

The Polybutadiene Rubber market vendors should focus on grabbing business opportunities from the Application segment as it accounted for the largest market share in the base year.