Police And Law Enforcement Equipment Market Analysis, Size, and Forecast 2025-2029: North America (US and Canada), Europe (France, Germany, Italy, and UK), APAC (China, India, Japan, and South Korea), and Rest of World (ROW)

Police And Law Enforcement Equipment Market Analysis, Size, and Forecast 2025-2029:
North America (US and Canada), Europe (France, Germany, Italy, and UK), APAC (China, India, Japan, and South Korea), and Rest of World (ROW)

Published: May 2025 232 Pages SKU: IRTNTR74736

Market Overview at a Glance

$1.51 B
Market Opportunity
6.7%
CAGR
6.1
YoY growth 2024-2025(%)

Police And Law Enforcement Equipment Market Size 2025-2029

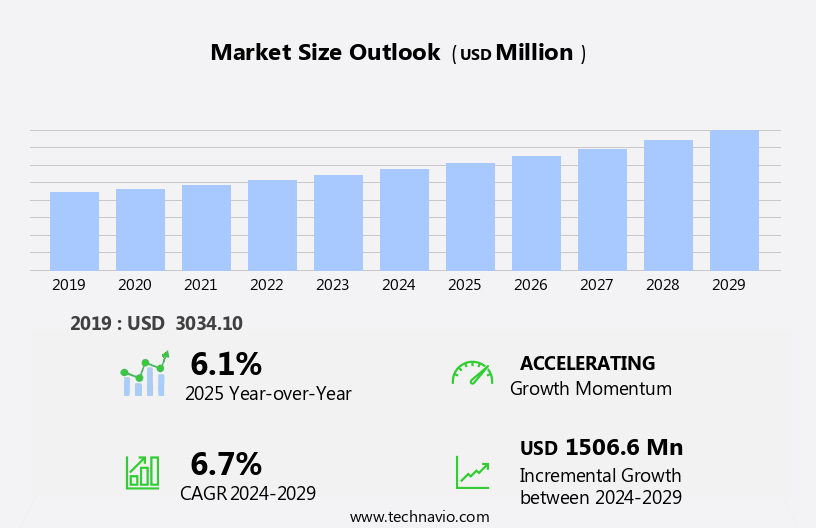
The police and law enforcement equipment market size is forecast to increase by USD 1.51 billion, at a CAGR of 6.7% between 2024 and 2029.

  • The market is witnessing significant growth, driven by the increasing prioritization of public place protection in the wake of heightened security concerns.The law enforcement equipment market continues to evolve, driven by the ever-changing needs of various sectors. Mobile data terminals enable officers to access real-time information, enhancing response times and decision-making capabilities. Night vision equipment and thermal imaging cameras expand the scope of investigations, particularly in low-light conditions.
  • Speed detection devices and radar systems ensure road safety, while DNA analysis tools aid in forensic investigations. Emergency response vehicles are equipped with advanced communication systems and dispatch console systems for efficient coordination. Shot detection systems and taser deployment systems prioritize officer safety. Cybersecurity solutions protect sensitive data, and criminal database systems facilitate effective investigations.

Major Market Trends & Insights

  • North America dominated the market and accounted for a 41% share in 2023.
  • The market is expected to grow significantly in Europe region as well over the forecast period.
  • Based on the End-user, the police segment led the market and was valued at USD 1.74 billion of the global revenue in 2023.
  • Based on the Product, the lethal and non-lethal weapons segment accounted for the largest market revenue share in 2023.

Market Size & Forecast

  • Market Opportunities: USD 3.92 Billion
  • Future Opportunities: USD 1.51 Billion
  • CAGR (2024-2029): 6.7%
  • North America: Largest market in 2023

What will be the Size of the Police And Law Enforcement Equipment Market during the forecast period?

Police And Law Enforcement Equipment Market Size

Explore in-depth regional segment analysis with market size data - historical 2019-2023 and forecasts 2025-2029 - in the full report.  
Request Free Sample

Protective gear, including ballistic vests, shields, and helmets, safeguards officers during high-risk situations. Evidence collection techniques, such as fingerprint scanners and digital forensics tools, ensure accurate and timely collection and analysis of evidence. Remote sensing technology, UAVs/drones, and facial recognition software expand the reach and capabilities of law enforcement agencies. Riot control equipment and surveillance systems deter and respond to civil unrest. Crime prevention strategies, including body-worn cameras, license-plate scanning, and conducted energy weapons (CEWs), promote transparency and accountability. Key communication tools, such as communications/radio systems, enable secure real-time coordination in the field.For instance, a large metropolitan police department implemented a digital evidence management system, resulting in a 30% increase in the number of cases solved. For instance, a large metropolitan police department implemented a digital evidence management system, resulting in a 30% increase in the number of cases solved. Tactical gear and thermal imaging are also increasingly utilized for enhanced operational readiness in low-visibility conditions.

This trend is further fueled by the integration of technology into law enforcement, such as the use of social media for investigative purposes and web real-time communication. However, the market faces challenges due to the lack of infrastructure and resources, which can hinder the adoption and effective implementation of advanced technologies and equipment.

As the demand for enhanced security solutions continues to rise, companies must navigate these challenges to capitalize on the market's potential and provide innovative, cost-effective solutions to meet the evolving needs of law enforcement agencies.

How is this Police And Law Enforcement Equipment Industry segmented?

The police and law enforcement equipment industry research report provides comprehensive data (region-wise segment analysis), with forecasts and estimates in "USD million" for the period 2025-2029, as well as historical data from 2019-2023 for the following segments.

  • End-user
    • Police
    • Court
    • Law enforcement agencies and others
  • Product
    • Lethal and non-lethal weapons
    • Surveillance systems
    • Communication systems
    • Personal protective equipment and others
  • Type
    • Body armor
    • Handguns
    • Batons
    • Restraints
    • Riot shields
  • Geography
    • North America
      • US
      • Canada
    • Europe
      • France
      • Germany
      • Italy
      • UK
    • APAC
      • China
      • India
      • Japan
      • South Korea
    • Rest of World (ROW)

By End-user Insights

The global police segment within the broader security technology market is undergoing continuous evolution, driven by the integration of advanced digital technologies into public safety operations. As law enforcement agencies modernize their operations, tools such as facial recognition systems, high-resolution CCTV cameras and digital communication platforms are playing a critical role in ensuring real-time coordination and rapid response. These solutions enable efficient information sharing and help manage complex tactical scenarios, especially during civil disturbances or high-risk operations.

Recent developments point to a marked shift in how public security and safety is maintained. The adoption of technologies like night-vision-enabled surveillance systems and AI-driven monitoring tools has become a priority, enhancing situational awareness and operational readiness. This transformation is not only technological but also structural, reflecting an institutional push for data-backed policing methods.

In terms of measurable impact, the police segment saw notable growth in 2024, continuing its trajectory due to its operational mandates. One standout indicator is that the segment is expected to grow by over 5% in the coming five years. This forecast builds upon the current expansion trend, largely fueled by the increasing number of police tactical units and the global need for enhanced law enforcement infrastructure. The market data confirms the growing momentum in adopting technology-driven tools for upholding law and order under rising security demands.

Police And Law Enforcement Equipment Market Size

Request Free Sample

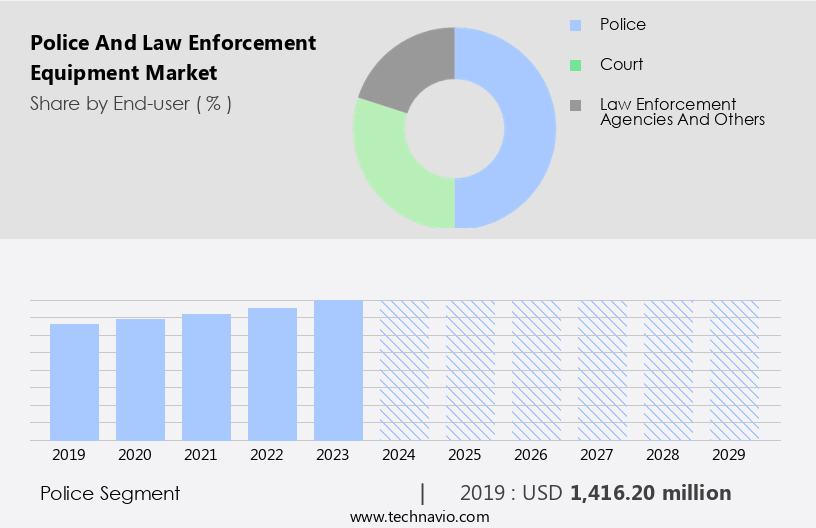
The Police segment was valued at USD 1.42 billion in 2019 and showed a gradual increase during the forecast period.

Regional Analysis

North America is estimated to contribute 41% to the growth of the global market during the forecast period. Technavio's analysts have elaborately explained the regional trends and drivers that shape the market during the forecast period.

Police And Law Enforcement Equipment Market Share by Geography

 Request Free Sample

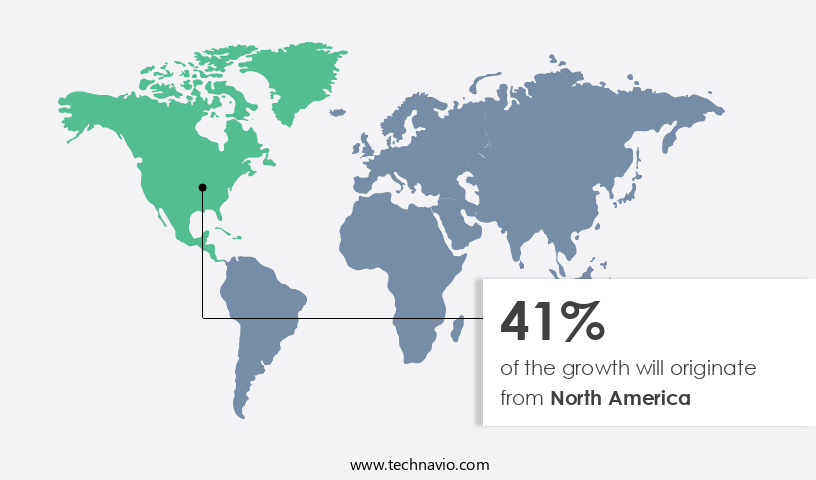
The North American market is experiencing growth in 2024, fueled by substantial government investments in public safety and crime prevention. The US Department of Justice earmarks a sizeable budget for law enforcement, with a significant portion dedicated to upgrading equipment and improving operational efficiency. The US and Canada are the major contributors to this expansion, with their policing ministries prioritizing advanced technologies and protective solutions. Leading companies in the region provide extensive portfolios of police and law enforcement equipment, ensuring readiness, coordination, and situational awareness.

These companies are introducing specialized protective gear designed for tactical operations. For instance, body-worn cameras have become increasingly popular, with their use increasing by 25% in the last five years. Additionally, the market is expected to grow by 5% annually, as demand for technologies such as facial recognition software, license plate readers, and drone surveillance systems continues to rise.

Market Dynamics

Our researchers analyzed the data with 2024 as the base year, along with the key drivers, trends, and challenges. A holistic analysis of drivers will help companies refine their marketing strategies to gain a competitive advantage.

The police and law enforcement equipment market is advancing rapidly with the integration of technologies like criminal profiling software, interrogation recording systems, and computer aided dispatch to enhance operational efficiency. Agencies now deploy emergency lighting systems, forensic laboratory equipment, and ballistic analysis software for improved field and investigative capabilities. Mobile tools such as vehicle tracking systems, bicycle patrol equipment, and foot patrol equipment support on-ground units. Key upgrades include advanced taser deployment technology, cloud based forensic software solutions, and emergency response vehicle maintenance systems. Surveillance is enhanced with high resolution surveillance camera systems, next generation facial recognition, and real time shot detection systems. Departments employ non lethal weapon deployment strategies, portable speed detection device, and in car video evidence management. Innovations like high definition body worn camera systems, improved ballistic vest materials, integrated crime scene investigation kits, mobile fingerprint scanner technology, rapid DNA analysis techniques, and secure police communication infrastructure improve safety and accuracy. Additionally, automatic license plate recognition software, advanced police radar detection systems, digital evidence storage solutions, centralized criminal database system, and modernized dispatch console technology support strategic law enforcement efforts.

What are the key market drivers leading to the rise in the adoption of Police And Law Enforcement Equipment Industry?

  • The increasing prioritization of safeguarding public spaces serves as the primary catalyst for market growth. Over the past decade, the global concern for public safety has escalated due to an increase in violent crimes and security breaches. In response, governments and organizations have significantly invested in advanced law enforcement equipment to bolster their security infrastructure. Notably, the adoption of AI-powered surveillance cameras has become a cornerstone of this effort, with systems now capable of real-time threat detection through facial recognition and anomaly sensing. These technologies enable preemptive action against potential security threats. Furthermore, panoramic fisheye security cameras offer 360-degree coverage, ensuring comprehensive monitoring of critical areas. The presence of these advanced security systems acts as a potent deterrent to criminal activities, contributing to a reduction in crime rates.
  • According to a study, the installation of surveillance cameras in a major city led to a 51% decrease in overall crime, underscoring the significance of this investment. The law enforcement equipment market is projected to experience robust growth, with industry analysts estimating a 15% increase in revenues over the next five years.

What are the market trends shaping the Police And Law Enforcement Equipment Industry?

  • The use of social media is increasingly becoming a trend in law enforcement. This modern approach leverages various social media platforms to gather intelligence, identify suspects, and engage with the public.
  • In the contemporary landscape of law enforcement, social media has emerged as a vital and expanding tool. By 2024, its significance will be indisputable, serving as a cornerstone for crime prevention, public interaction, and transparency. Social media platforms such as Facebook, Twitter, Instagram, and YouTube enable law enforcement agencies to disseminate real-time updates, crime alerts, and safety information to the public. This direct communication fosters trust and fortifies relationships between law enforcement and communities. Furthermore, social media plays a pivotal role in crime resolution. This digital engagement complements technology integration across body-worn cameras, evidence management systems, and real-time alerts via communications/radio systems, strengthening the public safety ecosystem.Agencies can harness the power of the public by crowdsourcing information, leading to invaluable tips and leads.
  • Descriptions of suspects, missing persons, and stolen property can be shared, enhancing investigative efforts. Social media also empowers law enforcement to combat misinformation by providing accurate updates and clarifications. As of now, social media adoption in law enforcement is robust, with an estimated 70% of agencies utilizing these platforms. Looking ahead, future growth expectations are promising, with a projected 30% increase in adoption by 2026.

What challenges does the Police And Law Enforcement Equipment Industry face during its growth?

  • The insufficient infrastructure necessitates a significant challenge to the industry's growth trajectory. The market is driven by the need for advanced infrastructure to support the deployment of surveillance and security equipment including thermal imaging, license-plate scanning, and communications/radio systems. With the increasing adoption of high-definition technologies like 4K recording, the demand for efficient storage solutions has surged. However, developing and underdeveloped countries face challenges due to limited robust network infrastructure, which negatively impacts data transmission and reduces the efficiency of surveillance and security equipment.The adoption of cloud-based surveillance systems and evidence management systems further necessitates substantial bandwidth to ensure seamless operation and meet service level agreements (SLAs). For instance, a leading European city implemented a cloud-based surveillance system that increased data storage requirements by 50%. Furthermore, the market is expected to grow by over 10% annually, fueled by the increasing demand for advanced technologies such as UAVs/drones, PPE, and tactical gear, and infrastructure upgrades to support modern law enforcement needs.
  • For instance, a leading European city implemented a cloud-based surveillance system that increased data storage requirements by 50%. Furthermore, The market is expected to grow by over 10% annually, fueled by the increasing demand for advanced technologies and infrastructure upgrades.

Exclusive Customer Landscape

The police and law enforcement equipment market forecasting report includes the adoption lifecycle of the market, covering from the innovator's stage to the laggard's stage. It focuses on adoption rates in different regions based on penetration. Furthermore, the police and law enforcement equipment market report also includes key purchase criteria and drivers of price sensitivity to help companies evaluate and develop their market growth analysis strategies.
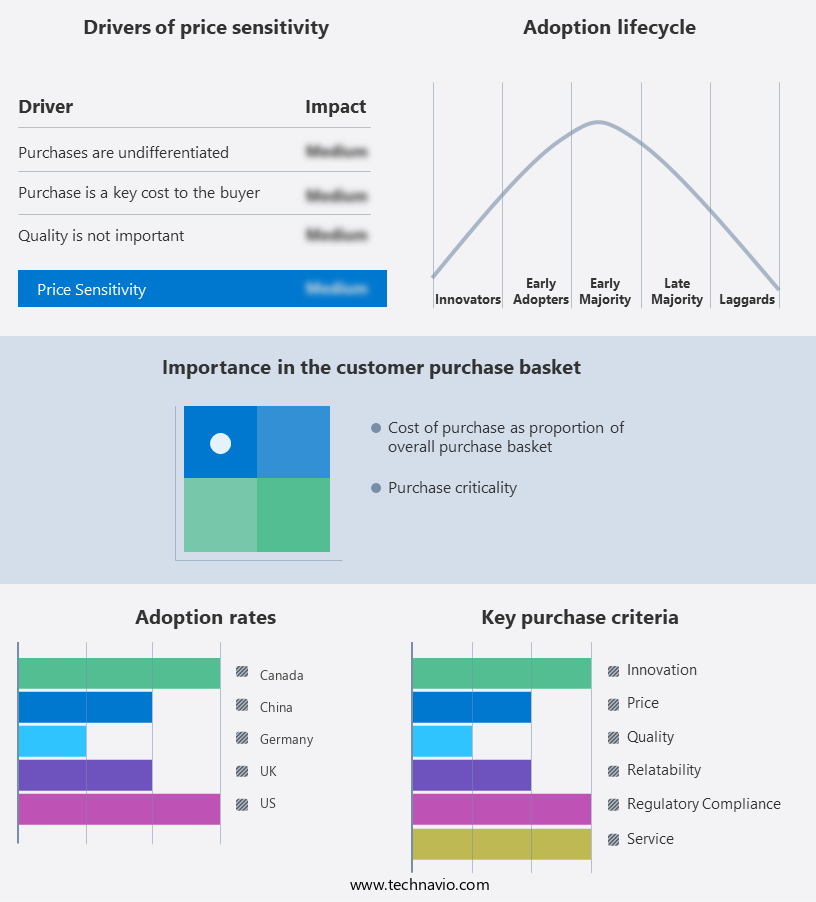
Police And Law Enforcement Equipment Market Share by Geography

 Customer Landscape

Key Companies & Market Insights

Companies are implementing various strategies, such as strategic alliances, police and law enforcement equipment market forecast, partnerships, mergers and acquisitions, geographical expansion, and product/service launches, to enhance their presence in the industry.

3M Co. - This company specializes in supplying advanced communication and protective equipment for law enforcement agencies. 

The industry research and growth report includes detailed analyses of the competitive landscape of the market and information about key companies, including:

  • 3M Co.
  • Aholdtech
  • Avon Polymer Products Ltd.
  • Axon Enterprise Inc.
  • Canon Inc.
  • Combined Systems Inc.
  • Digital Ally Inc.
  • Hard Shell
  • Haven Gear
  • Honeywell International Inc.
  • Jiangsu Kelin Police Co. Ltd
  • Mart Group LLC
  • Motorola Solutions Inc.
  • Oberon Alpha
  • Polimil Ltd.
  • Safariland LLC
  • Streichers Inc.
  • XION Protective Gear
  • Zhejiang Ganyu Police Co. Ltd.

Qualitative and quantitative analysis of companies has been conducted to help clients understand the wider business environment as well as the strengths and weaknesses of key industry players. Data is qualitatively analyzed to categorize companies as pure play, category-focused, industry-focused, and diversified; it is quantitatively analyzed to categorize companies as dominant, leading, strong, tentative, and weak.

Recent Development and News in Police And Law Enforcement Equipment Market

  • In January 2024, TASER International, a leading provider of conductive energy weapons and body-worn cameras, announced the launch of its Axon Body 4 camera system, featuring advanced Artificial intelligence capabilities for object recognition and automated incident classification (TASER International Press Release, 2024).
  • In March 2024, Axon and Microsoft Corporation entered into a strategic partnership to integrate Microsoft's Azure cloud platform with Axon's body cameras and evidence management software, enhancing data storage, processing, and analytics capabilities (Axon Press Release, 2024).
  • In April 2025, Harris Corporation, a global communications and information technology company, completed the acquisition of Leidos' Security Detection and Automated Screening Technologies business, expanding Harris' offerings in the law enforcement and security equipment market (Harris Corporation Press Release, 2025).
  • In May 2025, the European Union approved the use of facial recognition technology in law enforcement, subject to strict regulations and oversight, marking a significant policy change for the adoption of advanced biometric technologies in European police forces (European Commission Press Release, 2025).

Research Analyst Overview

  • The market for police and law enforcement equipment continues to evolve, with ongoing advancements in technology driving innovation across various sectors. Situational awareness tools, such as GPS tracking devices, body armor and crime mapping software, enable officers to respond more effectively to incidents. Firearm tracing systems and weapon detection systems support investigations, while police radio communication and tactical communication devices ensure efficient information exchange. For instance, the adoption of incident command systems has led to a 25% increase in the average response time for emergency services. Furthermore, the industry is projected to grow at a significant rate, with expectations of a 10% annual expansion.
  • This growth is fueled by the demand for secure communication networks, digital evidence preservation, and data encryption systems, among other advanced technologies. Additionally, specialized equipment like explosive detection systems, police canine equipment, and emergency medical equipment cater to unique requirements in law enforcement. Mounted patrol equipment, aircraft patrol equipment, and watercraft patrol equipment extend the reach of officers, while evidence bagging procedures and first aid kits ensure the proper handling and preservation of evidence and the safety of officers and civilians.

Dive into Technavio's robust research methodology, blending expert interviews, extensive data synthesis, and validated models for unparalleled Police And Law Enforcement Equipment Market insights. See full methodology.

Market Scope

Report Coverage

Details

Page number

232

Base year

2024

Historic period

2019-2023

Forecast period

2025-2029

Growth momentum & CAGR

Accelerate at a CAGR of 6.7%

Market growth 2025-2029

USD 1506.6 million

Market structure

Fragmented

YoY growth 2024-2025(%)

6.1

Key countries

US, China, Germany, Canada, UK, France, India, Japan, Italy, and South Korea

Competitive landscape

Leading Companies, Market Positioning of Companies, Competitive Strategies, and Industry Risks

Request Free Sample

What are the Key Data Covered in this Police And Law Enforcement Equipment Market Research and Growth Report?

  • CAGR of the Police And Law Enforcement Equipment industry during the forecast period
  • Detailed information on factors that will drive the growth and forecasting between 2025 and 2029
  • Precise estimation of the size of the market and its contribution of the industry in focus to the parent market
  • Accurate predictions about upcoming growth and trends and changes in consumer behaviour
  • Growth of the market across North America, Europe, APAC, South America, and Middle East and Africa
  • Thorough analysis of the market's competitive landscape and detailed information about companies
  • Comprehensive analysis of factors that will challenge the police and law enforcement equipment market growth of industry companies

We can help! Our analysts can customize this police and law enforcement equipment market research report to meet your requirements.

Get in touch

1 Executive Summary

  • 1.1 Market overview
    • Executive Summary - Chart on Market Overview
    • Executive Summary - Data Table on Market Overview
    • Executive Summary - Chart on Global Market Characteristics
    • Executive Summary - Chart on Market by Geography
    • Executive Summary - Chart on Market Segmentation by End-user
    • Executive Summary - Chart on Market Segmentation by Product
    • Executive Summary - Chart on Market Segmentation by Type
    • Executive Summary - Chart on Incremental Growth
    • Executive Summary - Data Table on Incremental Growth
    • Executive Summary - Chart on Company Market Positioning

2 Technavio Analysis

  • 2.1 Analysis of price sensitivity, lifecycle, customer purchase basket, adoption rates, and purchase criteria
    • Analysis of price sensitivity, lifecycle, customer purchase basket, adoption rates, and purchase criteria
  • 2.2 Criticality of inputs and Factors of differentiation
    • Overview on criticality of inputs and factors of differentiation
  • 2.3 Factors of disruption
    • Overview on factors of disruption
  • 2.4 Impact of drivers and challenges
    • Impact of drivers and challenges in 2024 and 2029

3 Market Landscape

  • 3.1 Market ecosystem
    • Parent Market
    • Data Table on - Parent Market
  • 3.2 Market characteristics
    • Market characteristics analysis
  • 3.3 Value chain analysis
    • Value chain analysis

4 Market Sizing

  • 4.1 Market definition
    • Offerings of companies included in the market definition
  • 4.2 Market segment analysis
    • Market segments
  • 4.3 Market size 2024
    • 4.4 Market outlook: Forecast for 2024-2029
      • Chart on Global - Market size and forecast 2024-2029 ($ million)
      • Data Table on Global - Market size and forecast 2024-2029 ($ million)
      • Chart on Global Market: Year-over-year growth 2024-2029 (%)
      • Data Table on Global Market: Year-over-year growth 2024-2029 (%)

    5 Historic Market Size

    • 5.1 Global Police And Law Enforcement Equipment Market 2019 - 2023
      • Historic Market Size - Data Table on Global Police And Law Enforcement Equipment Market 2019 - 2023 ($ million)
    • 5.2 End-user segment analysis 2019 - 2023
      • Historic Market Size - End-user Segment 2019 - 2023 ($ million)
    • 5.3 Product segment analysis 2019 - 2023
      • Historic Market Size - Product Segment 2019 - 2023 ($ million)
    • 5.4 Type segment analysis 2019 - 2023
      • Historic Market Size - Type Segment 2019 - 2023 ($ million)
    • 5.5 Geography segment analysis 2019 - 2023
      • Historic Market Size - Geography Segment 2019 - 2023 ($ million)
    • 5.6 Country segment analysis 2019 - 2023
      • Historic Market Size - Country Segment 2019 - 2023 ($ million)

    6 Qualitative Analysis

    • 6.1 The AI impact on global police and law enforcement equipment market

      7 Five Forces Analysis

      • 7.1 Five forces summary
        • Five forces analysis - Comparison between 2024 and 2029
      • 7.2 Bargaining power of buyers
        • Bargaining power of buyers - Impact of key factors 2024 and 2029
      • 7.3 Bargaining power of suppliers
        • Bargaining power of suppliers - Impact of key factors in 2024 and 2029
      • 7.4 Threat of new entrants
        • Threat of new entrants - Impact of key factors in 2024 and 2029
      • 7.5 Threat of substitutes
        • Threat of substitutes - Impact of key factors in 2024 and 2029
      • 7.6 Threat of rivalry
        • Threat of rivalry - Impact of key factors in 2024 and 2029
      • 7.7 Market condition
        • Chart on Market condition - Five forces 2024 and 2029

      8 Market Segmentation by End-user

      • 8.1 Market segments
        • Chart on End-user - Market share 2024-2029 (%)
        • Data Table on End-user - Market share 2024-2029 (%)
      • 8.2 Comparison by End-user
        • Chart on Comparison by End-user
        • Data Table on Comparison by End-user
      • 8.3 Police - Market size and forecast 2024-2029
        • Chart on Police - Market size and forecast 2024-2029 ($ million)
        • Data Table on Police - Market size and forecast 2024-2029 ($ million)
        • Chart on Police - Year-over-year growth 2024-2029 (%)
        • Data Table on Police - Year-over-year growth 2024-2029 (%)
      • 8.4 Court - Market size and forecast 2024-2029
        • Chart on Court - Market size and forecast 2024-2029 ($ million)
        • Data Table on Court - Market size and forecast 2024-2029 ($ million)
        • Chart on Court - Year-over-year growth 2024-2029 (%)
        • Data Table on Court - Year-over-year growth 2024-2029 (%)
      • 8.5 Others - Market size and forecast 2024-2029
        • Chart on Others - Market size and forecast 2024-2029 ($ million)
        • Data Table on Others - Market size and forecast 2024-2029 ($ million)
        • Chart on Others - Year-over-year growth 2024-2029 (%)
        • Data Table on Others - Year-over-year growth 2024-2029 (%)
      • 8.6 Market opportunity by End-user
        • Market opportunity by End-user ($ million)
        • Data Table on Market opportunity by End-user ($ million)

      9 Market Segmentation by Product

      • 9.1 Market segments
        • Chart on Product - Market share 2024-2029 (%)
        • Data Table on Product - Market share 2024-2029 (%)
      • 9.2 Comparison by Product
        • Chart on Comparison by Product
        • Data Table on Comparison by Product
      • 9.3 Lethal and non-lethal weapons - Market size and forecast 2024-2029
        • Chart on Lethal and non-lethal weapons - Market size and forecast 2024-2029 ($ million)
        • Data Table on Lethal and non-lethal weapons - Market size and forecast 2024-2029 ($ million)
        • Chart on Lethal and non-lethal weapons - Year-over-year growth 2024-2029 (%)
        • Data Table on Lethal and non-lethal weapons - Year-over-year growth 2024-2029 (%)
      • 9.4 Surveillance systems - Market size and forecast 2024-2029
        • Chart on Surveillance systems - Market size and forecast 2024-2029 ($ million)
        • Data Table on Surveillance systems - Market size and forecast 2024-2029 ($ million)
        • Chart on Surveillance systems - Year-over-year growth 2024-2029 (%)
        • Data Table on Surveillance systems - Year-over-year growth 2024-2029 (%)
      • 9.5 Communication systems - Market size and forecast 2024-2029
        • Chart on Communication systems - Market size and forecast 2024-2029 ($ million)
        • Data Table on Communication systems - Market size and forecast 2024-2029 ($ million)
        • Chart on Communication systems - Year-over-year growth 2024-2029 (%)
        • Data Table on Communication systems - Year-over-year growth 2024-2029 (%)
      • 9.6 Others - Market size and forecast 2024-2029
        • Chart on Others - Market size and forecast 2024-2029 ($ million)
        • Data Table on Others - Market size and forecast 2024-2029 ($ million)
        • Chart on Others - Year-over-year growth 2024-2029 (%)
        • Data Table on Others - Year-over-year growth 2024-2029 (%)
      • 9.7 Market opportunity by Product
        • Market opportunity by Product ($ million)
        • Data Table on Market opportunity by Product ($ million)

      10 Market Segmentation by Type

      • 10.1 Market segments
        • Chart on Type - Market share 2024-2029 (%)
        • Data Table on Type - Market share 2024-2029 (%)
      • 10.2 Comparison by Type
        • Chart on Comparison by Type
        • Data Table on Comparison by Type
      • 10.3 Body armor - Market size and forecast 2024-2029
        • Chart on Body armor - Market size and forecast 2024-2029 ($ million)
        • Data Table on Body armor - Market size and forecast 2024-2029 ($ million)
        • Chart on Body armor - Year-over-year growth 2024-2029 (%)
        • Data Table on Body armor - Year-over-year growth 2024-2029 (%)
      • 10.4 Handguns - Market size and forecast 2024-2029
        • Chart on Handguns - Market size and forecast 2024-2029 ($ million)
        • Data Table on Handguns - Market size and forecast 2024-2029 ($ million)
        • Chart on Handguns - Year-over-year growth 2024-2029 (%)
        • Data Table on Handguns - Year-over-year growth 2024-2029 (%)
      • 10.5 Batons - Market size and forecast 2024-2029
        • Chart on Batons - Market size and forecast 2024-2029 ($ million)
        • Data Table on Batons - Market size and forecast 2024-2029 ($ million)
        • Chart on Batons - Year-over-year growth 2024-2029 (%)
        • Data Table on Batons - Year-over-year growth 2024-2029 (%)
      • 10.6 Restraints - Market size and forecast 2024-2029
        • Chart on Restraints - Market size and forecast 2024-2029 ($ million)
        • Data Table on Restraints - Market size and forecast 2024-2029 ($ million)
        • Chart on Restraints - Year-over-year growth 2024-2029 (%)
        • Data Table on Restraints - Year-over-year growth 2024-2029 (%)
      • 10.7 Riot shields - Market size and forecast 2024-2029
        • Chart on Riot shields - Market size and forecast 2024-2029 ($ million)
        • Data Table on Riot shields - Market size and forecast 2024-2029 ($ million)
        • Chart on Riot shields - Year-over-year growth 2024-2029 (%)
        • Data Table on Riot shields - Year-over-year growth 2024-2029 (%)
      • 10.8 Market opportunity by Type
        • Market opportunity by Type ($ million)
        • Data Table on Market opportunity by Type ($ million)

      11 Customer Landscape

      • 11.1 Customer landscape overview
        • Analysis of price sensitivity, lifecycle, customer purchase basket, adoption rates, and purchase criteria

      12 Geographic Landscape

      • 12.1 Geographic segmentation
        • Chart on Market share by geography 2024-2029 (%)
        • Data Table on Market share by geography 2024-2029 (%)
      • 12.2 Geographic comparison
        • Chart on Geographic comparison
        • Data Table on Geographic comparison
      • 12.3 North America - Market size and forecast 2024-2029
        • Chart on North America - Market size and forecast 2024-2029 ($ million)
        • Data Table on North America - Market size and forecast 2024-2029 ($ million)
        • Chart on North America - Year-over-year growth 2024-2029 (%)
        • Data Table on North America - Year-over-year growth 2024-2029 (%)
      • 12.4 Europe - Market size and forecast 2024-2029
        • Chart on Europe - Market size and forecast 2024-2029 ($ million)
        • Data Table on Europe - Market size and forecast 2024-2029 ($ million)
        • Chart on Europe - Year-over-year growth 2024-2029 (%)
        • Data Table on Europe - Year-over-year growth 2024-2029 (%)
      • 12.5 APAC - Market size and forecast 2024-2029
        • Chart on APAC - Market size and forecast 2024-2029 ($ million)
        • Data Table on APAC - Market size and forecast 2024-2029 ($ million)
        • Chart on APAC - Year-over-year growth 2024-2029 (%)
        • Data Table on APAC - Year-over-year growth 2024-2029 (%)
      • 12.6 South America - Market size and forecast 2024-2029
        • Chart on South America - Market size and forecast 2024-2029 ($ million)
        • Data Table on South America - Market size and forecast 2024-2029 ($ million)
        • Chart on South America - Year-over-year growth 2024-2029 (%)
        • Data Table on South America - Year-over-year growth 2024-2029 (%)
      • 12.7 Middle East and Africa - Market size and forecast 2024-2029
        • Chart on Middle East and Africa - Market size and forecast 2024-2029 ($ million)
        • Data Table on Middle East and Africa - Market size and forecast 2024-2029 ($ million)
        • Chart on Middle East and Africa - Year-over-year growth 2024-2029 (%)
        • Data Table on Middle East and Africa - Year-over-year growth 2024-2029 (%)
      • 12.8 US - Market size and forecast 2024-2029
        • Chart on US - Market size and forecast 2024-2029 ($ million)
        • Data Table on US - Market size and forecast 2024-2029 ($ million)
        • Chart on US - Year-over-year growth 2024-2029 (%)
        • Data Table on US - Year-over-year growth 2024-2029 (%)
      • 12.9 China - Market size and forecast 2024-2029
        • Chart on China - Market size and forecast 2024-2029 ($ million)
        • Data Table on China - Market size and forecast 2024-2029 ($ million)
        • Chart on China - Year-over-year growth 2024-2029 (%)
        • Data Table on China - Year-over-year growth 2024-2029 (%)
      • 12.10 Germany - Market size and forecast 2024-2029
        • Chart on Germany - Market size and forecast 2024-2029 ($ million)
        • Data Table on Germany - Market size and forecast 2024-2029 ($ million)
        • Chart on Germany - Year-over-year growth 2024-2029 (%)
        • Data Table on Germany - Year-over-year growth 2024-2029 (%)
      • 12.11 Canada - Market size and forecast 2024-2029
        • Chart on Canada - Market size and forecast 2024-2029 ($ million)
        • Data Table on Canada - Market size and forecast 2024-2029 ($ million)
        • Chart on Canada - Year-over-year growth 2024-2029 (%)
        • Data Table on Canada - Year-over-year growth 2024-2029 (%)
      • 12.12 UK - Market size and forecast 2024-2029
        • Chart on UK - Market size and forecast 2024-2029 ($ million)
        • Data Table on UK - Market size and forecast 2024-2029 ($ million)
        • Chart on UK - Year-over-year growth 2024-2029 (%)
        • Data Table on UK - Year-over-year growth 2024-2029 (%)
      • 12.13 India - Market size and forecast 2024-2029
        • Chart on India - Market size and forecast 2024-2029 ($ million)
        • Data Table on India - Market size and forecast 2024-2029 ($ million)
        • Chart on India - Year-over-year growth 2024-2029 (%)
        • Data Table on India - Year-over-year growth 2024-2029 (%)
      • 12.14 France - Market size and forecast 2024-2029
        • Chart on France - Market size and forecast 2024-2029 ($ million)
        • Data Table on France - Market size and forecast 2024-2029 ($ million)
        • Chart on France - Year-over-year growth 2024-2029 (%)
        • Data Table on France - Year-over-year growth 2024-2029 (%)
      • 12.15 Japan - Market size and forecast 2024-2029
        • Chart on Japan - Market size and forecast 2024-2029 ($ million)
        • Data Table on Japan - Market size and forecast 2024-2029 ($ million)
        • Chart on Japan - Year-over-year growth 2024-2029 (%)
        • Data Table on Japan - Year-over-year growth 2024-2029 (%)
      • 12.16 Italy - Market size and forecast 2024-2029
        • Chart on Italy - Market size and forecast 2024-2029 ($ million)
        • Data Table on Italy - Market size and forecast 2024-2029 ($ million)
        • Chart on Italy - Year-over-year growth 2024-2029 (%)
        • Data Table on Italy - Year-over-year growth 2024-2029 (%)
      • 12.17 South Korea - Market size and forecast 2024-2029
        • Chart on South Korea - Market size and forecast 2024-2029 ($ million)
        • Data Table on South Korea - Market size and forecast 2024-2029 ($ million)
        • Chart on South Korea - Year-over-year growth 2024-2029 (%)
        • Data Table on South Korea - Year-over-year growth 2024-2029 (%)
      • 12.18 Market opportunity by geography
        • Market opportunity by geography ($ million)
        • Data Tables on Market opportunity by geography ($ million)

      13 Drivers, Challenges, and Opportunity/Restraints

      • 13.1 Market drivers
        • 13.2 Market challenges
          • 13.3 Impact of drivers and challenges
            • Impact of drivers and challenges in 2024 and 2029
          • 13.4 Market opportunities/restraints

            14 Competitive Landscape

            • 14.1 Overview
              • 14.2 Competitive Landscape
                • Overview on criticality of inputs and factors of differentiation
              • 14.3 Landscape disruption
                • Overview on factors of disruption
              • 14.4 Industry risks
                • Impact of key risks on business

              15 Competitive Analysis

              • 15.1 Companies profiled
                • Companies covered
              • 15.2 Company ranking index
                • Company ranking index
              • 15.3 Market positioning of companies
                • Matrix on companies position and classification
              • 3M Co.
                • 3M Co. - Overview
                • 3M Co. - Business segments
                • 3M Co. - Key news
                • 3M Co. - Key offerings
                • 3M Co. - Segment focus
                • SWOT
              • 15.5 Avon Polymer Products Ltd.
                • Avon Polymer Products Ltd. - Overview
                • Avon Polymer Products Ltd. - Product / Service
                • Avon Polymer Products Ltd. - Key offerings
                • SWOT
              • 15.6 Axon Enterprise Inc.
                • Axon Enterprise Inc. - Overview
                • Axon Enterprise Inc. - Business segments
                • Axon Enterprise Inc. - Key news
                • Axon Enterprise Inc. - Key offerings
                • Axon Enterprise Inc. - Segment focus
                • SWOT
              • 15.7 Canon Inc.
                • Canon Inc. - Overview
                • Canon Inc. - Business segments
                • Canon Inc. - Key news
                • Canon Inc. - Key offerings
                • Canon Inc. - Segment focus
                • SWOT
              • 15.8 Combined Systems Inc.
                • Combined Systems Inc. - Overview
                • Combined Systems Inc. - Product / Service
                • Combined Systems Inc. - Key offerings
                • SWOT
              • 15.9 Digital Ally Inc.
                • Digital Ally Inc. - Overview
                • Digital Ally Inc. - Product / Service
                • Digital Ally Inc. - Key offerings
                • SWOT
              • 15.10 Honeywell International Inc.
                • Honeywell International Inc. - Overview
                • Honeywell International Inc. - Business segments
                • Honeywell International Inc. - Key news
                • Honeywell International Inc. - Key offerings
                • Honeywell International Inc. - Segment focus
                • SWOT
              • 15.11 Jiangsu Kelin Police Co. Ltd
                • Jiangsu Kelin Police Co. Ltd - Overview
                • Jiangsu Kelin Police Co. Ltd - Product / Service
                • Jiangsu Kelin Police Co. Ltd - Key offerings
                • SWOT
              • 15.12 Mart Group LLC
                • Mart Group LLC - Overview
                • Mart Group LLC - Product / Service
                • Mart Group LLC - Key offerings
                • SWOT
              • 15.13 Motorola Solutions Inc.
                • Motorola Solutions Inc. - Overview
                • Motorola Solutions Inc. - Business segments
                • Motorola Solutions Inc. - Key news
                • Motorola Solutions Inc. - Key offerings
                • Motorola Solutions Inc. - Segment focus
                • SWOT
              • 15.14 Oberon Alpha
                • Oberon Alpha - Overview
                • Oberon Alpha - Product / Service
                • Oberon Alpha - Key offerings
                • SWOT
              • 15.15 Polimil Ltd.
                • Polimil Ltd. - Overview
                • Polimil Ltd. - Product / Service
                • Polimil Ltd. - Key offerings
                • SWOT
              • 15.16 Safariland LLC
                • Safariland LLC - Overview
                • Safariland LLC - Product / Service
                • Safariland LLC - Key offerings
                • SWOT
              • 15.17 Streichers Inc.
                • Streichers Inc. - Overview
                • Streichers Inc. - Product / Service
                • Streichers Inc. - Key offerings
                • SWOT
              • 15.18 XION Protective Gear
                • XION Protective Gear - Overview
                • XION Protective Gear - Product / Service
                • XION Protective Gear - Key offerings
                • SWOT

              16 Appendix

              • 16.1 Scope of the report
                • 16.2 Inclusions and exclusions checklist
                  • Inclusions checklist
                  • Exclusions checklist
                • 16.3 Currency conversion rates for US$
                  • Currency conversion rates for US$
                • 16.4 Research methodology
                  • Research methodology
                • 16.5 Data procurement
                  • Information sources
                • 16.6 Data validation
                  • Data validation
                • 16.7 Validation techniques employed for market sizing
                  • Validation techniques employed for market sizing
                • 16.8 Data synthesis
                  • Data synthesis
                • 16.9 360 degree market analysis
                  • 360 degree market analysis
                • 16.10 List of abbreviations
                  • List of abbreviations

                Research Methodology

                Technavio presents a detailed picture of the market by way of study, synthesis, and summation of data from multiple sources. The analysts have presented the various facets of the market with a particular focus on identifying the key industry influencers. The data thus presented is comprehensive, reliable, and the result of extensive research, both primary and secondary.

                INFORMATION SOURCES

                Primary sources

                • Manufacturers and suppliers
                • Channel partners
                • Industry experts
                • Strategic decision makers

                Secondary sources

                • Industry journals and periodicals
                • Government data
                • Financial reports of key industry players
                • Historical data
                • Press releases

                DATA ANALYSIS

                Data Synthesis

                • Collation of data
                • Estimation of key figures
                • Analysis of derived insights

                Data Validation

                • Triangulation with data models
                • Reference against proprietary databases
                • Corroboration with industry experts

                REPORT WRITING

                Qualitative

                • Market drivers
                • Market challenges
                • Market trends
                • Five forces analysis

                Quantitative

                • Market size and forecast
                • Market segmentation
                • Geographical insights
                • Competitive landscape

                Interested in this report?

                Get your sample now to see our research methodology and insights!

                Download Now

                Frequently Asked Questions

                Police And Law Enforcement Equipment market growth will increase by $ 1506.6 mn during 2025-2029.

                The Police And Law Enforcement Equipment market is expected to grow at a CAGR of 6.7% during 2025-2029.

                Police And Law Enforcement Equipment market is segmented by End-user( Police, Court, Law enforcement agencies and others) Product( Lethal and non-lethal weapons, Surveillance systems, Communication systems, Personal protective equipment and others) Type( Body armor, Handguns, Batons, Restraints, Riot shields)

                3M Co., Aholdtech, Avon Polymer Products Ltd., Axon Enterprise Inc., Canon Inc., Combined Systems Inc., Digital Ally Inc., Hard Shell, Haven Gear, Honeywell International Inc., Jiangsu Kelin Police Co. Ltd, Mart Group LLC, Motorola Solutions Inc., Oberon Alpha, Polimil Ltd., Safariland LLC, Streichers Inc., XION Protective Gear, Zhejiang Ganyu Police Co. Ltd. are a few of the key vendors in the Police And Law Enforcement Equipment market.

                North America will register the highest growth rate of 41% among the other regions. Therefore, the Police And Law Enforcement Equipment market in North America is expected to garner significant business opportunities for the vendors during the forecast period.

                US, China, Germany, Canada, UK, France, India, Japan, Italy, South Korea

                • Growing focus on public place protectionOver the past decade is the driving factor this market.
                • public security has become a growing concern due to incidents involving violent crimes and security breaches. In response is the driving factor this market.
                • governments and organizations worldwide have strengthened their surveillance infrastructure by installing advanced security cameras in key locations such as government buildings is the driving factor this market.
                • hospitals is the driving factor this market.
                • airports is the driving factor this market.
                • universities is the driving factor this market.
                • and stock exchanges.Enhancement of Public SafetyModern surveillance cameras now integrate AI-powered analytics that enable real-time threat detection. These systems can recognize faces is the driving factor this market.
                • detect unusual activities is the driving factor this market.
                • and even predict potential security threats is the driving factor this market.
                • allowing law enforcement to take preemptive action. Additionally is the driving factor this market.
                • panoramic fisheye security cameras provide 360 degree seamless surveillance is the driving factor this market.
                • ensuring comprehensive monitoring of critical areas.Crime Prevention and ReductionThe presence of surveillance cameras acts as a deterrent to criminal activities. With advancements in edge computing is the driving factor this market.
                • security footage is processed locally is the driving factor this market.
                • reducing response time and enabling quicker decision-making. Criminals are less likely to engage in unlawful activities when they know they are being monitored.Identification and Capture of CriminalsFacial recognition technology has significantly improved is the driving factor this market.
                • allowing authorities to identify suspects with greater accuracy. AI-driven surveillance systems can match faces against criminal databases is the driving factor this market.
                • increasing the chances of apprehending offenders. Additionally is the driving factor this market.
                • high-resolution 4K cameras provide crystal-clear images is the driving factor this market.
                • making it easier to track individuals involved in crimes.Provision of Evidence and Investigation SupportSurveillance footage serves as critical evidence in legal proceedings. The latest night vision surveillance cameras offer enhanced clarity is the driving factor this market.
                • even in low-light conditions is the driving factor this market.
                • ensuring that crimes committed in dark areas are recorded effectively. Furthermore is the driving factor this market.
                • IoT-integrated security systems allow seamless communication between surveillance cameras and other security devices is the driving factor this market.
                • strengthening overall public safety.Regulatory and Cybersecurity MeasuresGovernments have introduced stricter regulations to enhance the cybersecurity of surveillance systems. In India is the driving factor this market.
                • for example is the driving factor this market.
                • all CCTV cameras must comply with stringent security standards is the driving factor this market.
                • including network encryption and penetration testing is the driving factor this market.
                • to prevent unauthorized access. These measures ensure that surveillance data remains secure and protected from cyber threats. These benefits will drive the growth of the global police and law enforcement equipment market during the forecast period. is the driving factor this market.

                The Police And Law Enforcement Equipment market vendors should focus on grabbing business opportunities from the Police segment as it accounted for the largest market share in the base year.